

Abstract
Quinine has been employed in the treatment of malaria for centuries and is still used against severe Plasmodium falciparum malaria. However, its interactions with the parasite remain poorly understood and subject to debate. In this study, we used the Saccharomyces cerevisiae eukaryotic model to better understand quinine's mode of action and the mechanisms underlying the cell response to the drug. We obtained a transcriptomic profile of the yeast's early response to quinine, evidencing a marked activation of genes involved in the low-glucose response (e.g., CAT8, ADR1, MAL33, MTH1, and SNF3). We used a low inhibitory quinine concentration with no detectable effect on plasma membrane function, consistent with the absence of a general nutrient starvation response and suggesting that quinine-induced glucose limitation is a specific response. We have further shown that transport of [14C]glucose is inhibited by quinine, with kinetic data indicating competitive inhibition. Also, tested mutant strains deleted for genes encoding high- and low-affinity hexose transporters (HXT1 to HXT5, HXT8, and HXT10) exhibit resistance phenotypes, correlating with reduced levels of quinine accumulation in the mutants examined. These results suggest that the hexose transporters are facilitators of quinine uptake in S. cerevisiae, possibly through a competitive inhibition mechanism. Interestingly, P. falciparum is highly dependent on glucose uptake, which is mediated by the single-copy transporter PfHT1, a protein with high homology to yeast's hexose transporters. We propose that PfHT1 is an interesting candidate quinine target possibly involved in quinine import in P. falciparum, an uptake mechanism postulated in recent studies to occur through a still-unidentified importer(s).
Cinchona alkaloids have been used in the treatment of malaria since the 17th century. Quinine (QN) (6′-methoxycinchonidine), the active ingredient of the cinchona bark, remained the antimalarial drug of choice until the 1940s, when more-effective and safer drugs took over, namely, the synthetic 4-aminoquinoline, chloroquine. However, following widespread development of chloroquine resistance in Plasmodium falciparum (the most virulent parasite, responsible for fatal malaria in humans), QN reemerged as an important antimalarial drug. QN is the mainstay for treatment of severe and complicated chloroquine-resistant falciparum malaria (1), notwithstanding its slow but gradual loss of efficacy (59). QN and especially its diastereomer quinidine are also used as antiarrhythmic compounds as a result of the drugs' blocking action on human cardiac potassium channels (15, 47). Understandably, the effects of these drugs in human cells are better understood than those in the Plasmodium parasite, where the antimalarial mode of action and mechanisms of resistance to QN remain unclear. It has been suggested that QN shares some common features with other quinoline antimalarial drugs, such as chloroquine, that kill the parasite by inhibiting heme detoxification in the parasite's digestive vacuole (43, 49). Also, although it is believed that QN accumulates in the acidic digestive vacuole of parasites as a result of passive distribution according to intracellular pH gradients (52, 56), due to its weak basic character, there is a scant supply of biochemical data available on the factors that determine QN accumulation by P. falciparum parasites. However, recent studies have demonstrated that this passive transport across the plasma membrane can make up only a small fraction of the drug accumulated by Plasmodium parasites, suggesting that a carrier-mediated import system is probably involved (43). Interestingly, QN has been shown to be both a substrate and an inhibitor of the human multidrug efflux pump P glycoprotein and of its P. falciparum homologue, the PfMDR1 gene product (18, 42).
We used the yeast Saccharomyces cerevisiae to investigate the global mechanisms of QN action. After more than a decade of postgenomic research, the unicellular eukaryote S. cerevisiae provides a powerful model system to increase our understanding of the effects and targets of drugs and drug resistance mechanisms on more complex and less accessible organisms. Genome-wide expression analyses in yeast have been successfully used to assess the cellular and molecular changes imposed by antimalarials, anticancer drugs, fungicides, herbicides, etc. (7, 20, 50). Previous studies of yeast have identified a number of cellular processes that are affected by quinoline antimalarial drugs (7, 53, 54). It has been shown by our group that quinidine strongly impairs potassium uptake and accumulation in yeast cells, providing a physiological advantage for cells under quinidine-induced stress (53). It was also demonstrated that quinidine affects the homeostasis of intracellular pH, whose maintenance within a permissive range for the functionality of pH-sensitive cellular processes is crucial to cell physiology (53, 54). Another interesting study of yeast uncovered a relationship between chloroquine toxicity and iron acquisition and demonstrated that chloroquine is a competitive inhibitor of iron uptake and accumulation (7). Furthermore, genes of the iron uptake pathway are activated at the diauxic shift under the control of the Snf1 kinase (16), one of the main regulators of glucose-repressed genes.
In this study, we performed transcriptional profiling of the yeast response to a QN concentration that exerted a very slight effect on cellular growth. Among the genes that were overexpressed in response to QN, a significant number are involved in carbohydrate transport and metabolism, mimicking the yeast response to glucose limitation (5, 23, 60). In line with these results, the uptake of glucose was shown to be inhibited by QN. We tested a number of membrane hexose transporter deletion mutants with a resistance phenotype for QN and found that these mutant cells show reduced levels of drug accumulation. Our results suggest that QN may be imported into the cell by several membrane transporters, including (but not exclusive to) a number of hexose transporters, thereby competitively inhibiting glucose uptake into the cell. The possible implications of these results in a P. falciparum context are also discussed.
MATERIALS AND METHODS
Strains and growth media.
The haploid parental strain Saccharomyces cerevisiae BY4741 (MATa his3Δ1 leu2Δ0 met15Δ0 ura3Δ0) and the EUROSCARF-derived mutant strains described in Table 1 were used, with the indicated open reading frames (ORFs) individually deleted with the kanMX cassette. Cells were batch cultured at 30°C with orbital agitation (250 rpm). The minimal growth medium, MM4 (pH 4.5), used for cultivation of BY4741 and derived deletion mutants, contained (per liter) 1.7 g yeast nitrogen base without amino acids or NH4+ (Difco Laboratories, Detroit, MI), 20 g glucose, 2.65 g (NH4)2SO4, 20 mg methionine, 20 mg histidine, 60 mg leucine, and 20 mg uracil, all from Sigma (Spain). This basal medium was supplemented or not with adequate concentrations of the antimalarial drug QN (from Sigma). YPD solid medium contained (per liter) 20 g glucose, 20 g yeast extract (Difco), 10 g BactoPeptone (Difco), and 20 g of agar (IberAgar SA, Barreiro, Portugal).
TABLE 1.
Saccharomyces cerevisiae deletion strains used in this study and obtained from EUROSCARFa
| Category and deleted ORF | Gene name | Gene product function | QN susceptibilityb |
|---|---|---|---|
| Regulation of metabolism | |||
| YDR216w | ADR1 | Carbon source-responsive zinc finger transcription factor | — |
| YMR280c | CAT8 | Transcriptional activator necessary for derepression of genes under nonfermentative growth conditions | — |
| YNL027w | CRZ1 | Transcription factor that activates transcription of genes involved in stress response | S++ |
| YPL248c | GAL4 | Transcription factor required for activation of GAL genes in response to galactose | R |
| YDR096w | GIS1 | Transcription factor involved in expression of genes during nutrient limitation | — |
| YHR187w | HAP2 | Subunit of Elongator complex | S |
| YOR358w | HAP5 | Subunit of heme-activated, glucose-repressed Hap2p/3p/4p/5p CCAAT-binding complex | — |
| YBR297w | MAL33 | MAL activator protein | S+ |
| YGL035c | MIG1 | Transcription factor involved in glucose repression | — |
| YGL209w | MIG2 | Involved in repression, along with Mig1p, of gene expression induced by high levels of glucose | S |
| YBR066c | NRG2 | Transcriptional repressor that mediates glucose repression and negatively regulates filamentous growth | R |
| YPR065w | ROX1 | Heme-dependent repressor of hypoxic genes | — |
| YNL167c | SKO1 | Basic leucine zipper (bZIP) transcription factor | S |
| YDR463w | STP1 | Transcription factor; activates transcription of amino acid permease genes | R |
| YHR006w | STP2 | Transcription factor; activates transcription of amino acid permease genes | S++ |
| YIR018w | YAP5 | Basic leucine zipper (bZIP) transcription factor | R |
| Signal transduction | |||
| YFR014c | CMK1 | Calmodulin-dependent protein kinase; may play role in stress response | — |
| YNL173c | MDG1 | Plasma membrane protein involved in G-protein-mediated pheromone signaling pathway | — |
| YDR277c | MTH1 | Negative regulator of glucose-sensing signal transduction pathway | — |
| YPL026c | SKS1 | Serine/threonine protein kinase, involved in adaptation to low concentrations of glucose | R+ |
| YDL194w | SNF3 | Plasma membrane glucose sensor that regulates glucose transport | R+ |
| Response to stress | |||
| YPR005c | HAL1 | Cytoplasmic protein involved in halotolerance | — |
| YMR037c | MSN2 | Transcriptional activator related to Msn4p, activated under stress conditions | — |
| YKL062w | MSN4 | Transcriptional activator related to Msn2p, activated under stress conditions | — |
| YDL106c | PHO2 | Homeobox transcription factor; regulatory targets include genes involved in phosphate metabolism | S+ |
| YFR034c | PHO4 | Basic helix-loop-helix (bHLH) transcription factor of Myc family | R |
| YML007w | YAP1 | Basic leucine zipper (bZIP) transcription factor required for oxidative stress tolerance | S+ |
| Membrane transport | |||
| YCL025c | AGP1 | Low-affinity amino acid permease with broad substrate range | R |
| YHR094c | HXT1 | Low-affinity glucose transporter | R |
| YMR011w | HXT2 | High-affinity glucose transporter | R+ |
| YDR345c | HXT3 | Low-affinity glucose transporter | R+ |
| YHR092c | HXT4 | High-affinity glucose transporter | R |
| YHR096c | HXT5 | Hexose transporter with moderate affinity for glucose | R |
| YJL214w | HXT8 | Protein of unknown function with similarity to hexose transporter family members | R |
| YFL011w | HXT10 | Putative hexose transporter | R |
| YKL217w | JEN1 | Lactate transporter, required for uptake of lactate and pyruvate | — |
| YHL036w | MUP3 | Low-affinity methionine permease | S |
| YML123c | PHO84 | High-affinity inorganic phosphate (Pi) transporter | R |
| YCR037c | PHO87 | Low-affinity inorganic phosphate (Pi) transporter | — |
| YBR106w | PHO88 | Probable membrane protein, involved in phosphate transport | S |
| YBR296c | PHO89 | Na+/Pi cotransporter, active in early growth phase | S+ |
| YFL054c | YFL054c | Putative channel-like protein | — |
Comparative levels of susceptibility for the deletion mutant strains tested are given. Boldface type indicates that the gene was upregulated in response to QN as indicated by microarray analysis.
—, susceptibility identical to that of the wild-type strain; S, S+, and S++, increased susceptibility levels compared to that of parental strain BY4741. R and R+, decreased susceptibility levels compared to that of parental strain BY4741.
Sample preparation and hybridization to Affymetrix GeneChips.
Cells of S. cerevisiae BY4741 grown in MM4 medium were harvested in mid-exponential phase (standardized optical density at 600 nm [OD600] = 0.5 ± 0.05) and reinoculated into fresh medium supplemented or not with 3.1 mM (1 g·liter−1) of QN dissolved in ethanol (final concentration, 0.7% [vol/vol]). After a 15-min incubation in the absence (sample A) or presence (sample B) of the antimalarial drug, cells were harvested, immediately frozen in liquid nitrogen, and kept at −80°C until RNA extraction. Total RNA extraction was performed according to the hot phenol method (25). RNA was processed for use on Affymetrix (Santa Clara, CA) Yeast Genome S98 GeneChip arrays according to the manufacturer's instructions. Briefly, RNA quality and quantity were assessed with an RNA 6000 nanoassay (Agilent Technologies, Palo Alto, CA) using an Agilent Technologies 2100 bioanalyzer with Biosizing software. Eight micrograms of total RNA was used in a reverse transcription reaction (Superscript II reverse transcriptase kit; Invitrogen, Carlsbad, CA) to generate first-strand cDNA. After second-strand synthesis, also accomplished using the Superscript II reverse transcriptase kit, double-stranded cDNA was purified with the GeneChip Sample CleanUp module (Affymetrix). Double-stranded cDNA was then used in an in vitro transcription reaction to generate biotinylated cRNA through the Enzo BioArray High Yield RNA transcript labeling kit (Enzo Diagnostics, Farmingdale, NY). After purification, achieved using the GeneChip Sample CleanUp module (Affymetrix), and subsequent fragmentation, the cRNA quality and its level of fragmentation were assessed using an Agilent 2100 bioanalyzer (Agilent Technologies). Fifteen micrograms of fragmented cRNA was used in a 300-μl hybridization cocktail containing added hybridization controls. Two hundred microliters of mixture was hybridized on arrays for 16 h at 45°C. Standard posthybridization wash and double-stain protocols (EukGE-WS2v4) were used on an Affymetrix GeneChip Fluidics Station 400. Arrays were scanned on an Affymetrix GeneChip 2500 scanner.
Microarray data analysis.
Scanned microarrays were analyzed in a first step using the Affymetrix MAS 5.0 software program in order to determine absent/present calls and to ensure that all quality parameters were within the recommended range. For subsequent analysis, the dChip 1.3 software program (http://www.dchip.org; Cheng Li laboratory, Harvard University) was used. The following conditions were applied to ensure the reliability of the analyses. First, each GeneChip experiment was performed with biological replicates. Replicate data for the same sample were weighted genewise by using inverse squared standard errors as weights; second, normalized CEL intensities of a total of 10 arrays were used to obtain model-based gene expression indices based on a perfect match-only model (29). Four arrays, corresponding to two replicates of each condition under study, were analyzed. The remaining six arrays were used only to build the reference model. Only genes called “present” in at least one of the arrays and within replicate arrays with a variation of 0 < median (standard deviation/mean) < 0.5 were kept for downstream analysis. Thus, genes called “absent” in all arrays and genes with inconsistent expression levels within replicate arrays were excluded. Finally, all genes compared were considered to be differentially expressed if they were called “present” in at least one of the arrays and if the 90% lower confidence bound of the n-fold change between the experimental and baseline levels was above 1.2. Using these criteria, only median expression changes above 2.0 or below −2.0 were considered in the analysis of the transcriptional response to QN carried out in this study.
The genes up- and downregulated in response to QN were clustered according to biological process gene ontology assignments and subsequent manual adjustment according to Saccharomyces Genome Database reports (www.yeastgenome.org). The main functional clusters of up- or downregulated genes were identified using a hypergeometric statistical test with a Bonferroni correction for multiple testing (software available online; GOToolBox [http://burgundy.cmmt.ubc.ca/GOToolBox/] [33]). The documented regulators of genes whose transcript levels are altered in response to QN and the respective regulatory associations were obtained using the YEASTRACT available tools (www.yeastract.com [51]).
QN susceptibility assays.
Susceptibilities of the BY4741 parental strain and selected derived deletion mutant strains (listed in Table 1) to QN were assessed by spot assays and/or batch cultivation. Cell suspensions used to inoculate the agar plates or the liquid medium were grown to mid-exponential phase without drugs at 30°C with orbital agitation (250 rpm) in MM4 medium until a culture OD600 of 0.5 ± 0.05 was reached. Growth curves were followed by measuring the culture OD600 and the concentration of viable cells, assessed as the number of CFU after a 2-day incubation at 30°C. The cellular suspensions used to prepare the spot assays were grown to mid-exponential phase (OD600 = 0.5 ± 0.05) and diluted to a standardized OD600 of 0.025 ± 0.005. These cell suspensions and two subsequent dilutions (1:5 and 1:10) were applied as 4-μl spots onto the surface of MM4 agarized medium supplemented with adequate concentrations of QN. Plates were incubated at 30°C for 2 to 5 days, depending on the severity of growth inhibition.
β-Galactosidase activity assays.
The level of expression for HXT7 was tested during growth with or without 3.1 mM QN and was estimated based on the β-galactosidase activity of the HXT7-lacZ fusion plasmid, a kind gift from Eckhard Boles (Dusseldorf University, Germany). The lacZ reporter fusion plasmid was introduced in parental BY4741 cells using the lithium acetate method of Gietz et al. (13) with minor modifications. Transformed cells were cultivated in medium supplemented or not with QN, and growth was followed. Culture samples were harvested at adequate time intervals, and cells were filtered and kept at −20°C until used to assay β-galactosidase activity, described as being the enzyme-specific activity units-Miller units and defined as the increase in the A420 min−1 (OD600)−1 × 1,000 (6).
Assays of glucose transport.
Initial glucose uptake rates were determined with radiolabeled d-[U-14C]glucose (GE Healthcare, United Kingdom, 299 mCi·mmol−1 and 11.1 GBq·mmol−1) and using a methodology previously described with minor alterations (10, 48). Briefly, cultured cells were grown aerobically in shaking flasks to exponential phase in MM4 medium. The cells were harvested, washed with 5 ml ice-cold TM buffer (0.1 M morpholineethanesulfonic acid, 41 mM Tris, pH 5.5), and resuspended to a density of 3 × 10⁸ cells·ml−1. Aliquots of 20 μl [14C]glucose at various concentrations (10× concentrated for final concentrations between 0.5 mM and 200 mM) were dispensed to 5-ml Röhren tubes. Reactions were started with the addition of 180 μl of cellular suspensions thermoequilibrated for 5 min at 30°C and stopped after 5 s by vigorous quenching in 3.5 ml ice-cold demineralized water. Cells were collected immediately and washed on Whatman GF/C glass microfiber membranes. The filters were transferred to scintillation vials containing 7 ml liquid scintillation cocktail Ultima Gold MV (Perkin-Elmer), and radioactivity was measured in a Beckman LS 5000TD scintillation counter. Transport rates were obtained in triplicate for each sugar concentration. The control time values (0 s) were obtained in a similar manner, but the [14C]glucose solutions were diluted in ice-cold water before addition of the cell suspensions. The results from at least three independent experiments were fitted to the Michaelis-Menten model by using computational assisted nonlinear regression (Origin; OriginLab Corporation). Kinetic parameters were estimated from this analysis or from Eadie-Hofstee plots. For inhibition studies, solutions of 100×-concentrated QN were mixed with radiolabeled glucose in the respective assay tubes, and the reactions proceeded as described above. The entire glucose concentration range (0.5 mM to 200 mM) was tested with or without 4.6 mM (1.5 g·liter−1) QN. Alternatively, uptake of 25 mM [14C]glucose was assayed with increasing concentrations of QN.
QN intracellular accumulation assays.
To estimate the intracellular concentration of QN in yeast cells, the parental strain BY4741 and selected HXT deletion mutant strains were grown to mid-exponential phase in MM4 medium until a culture OD600 of 0.5 ± 0.05 was reached. QN was added to a final concentration of 3.1 mM, and incubation proceeded for an additional period of 15 min. Cells were collected by filtration, washed three times with 10 ml ice-cold water, and resuspended in 10% perchloric acid-2 M sodium methanesulfonate. An equal volume of acid-washed glass beads was added, and the cell suspensions were disrupted by three cycles of 1-min vortexing followed by 1 min on ice. The acid-soluble supernatants were collected by centrifugation at maximum speed for 5 min. The fluorescence emission spectra of QN were detected in a Varian Cary Elipse fluorescence spectrophotometer. Samples were excited at 350 nm, and emission was recorded from 380 nm to 520 nm; QN peaks were detected at ∼450 nm. Spectra obtained from samples derived from controls without QN were subtracted to eliminate the background signal and were normalized to the cellular OD600. Results from at least three independent experiments are shown.
Nucleotide sequence accession number.
The entire set of microarray data is deposited in the GEO public database with the accession number GSE18037.
RESULTS
Genome-wide transcriptional alterations of S. cerevisiae in response to mild QN-induced stress.
In this study, we have examined the early global transcriptional response of yeast to QN following 15 min of exposure to a very moderately toxic QN concentration (3.1 mM). The exposure of an unadapted population of S. cerevisiae in the exponential phase of growth to 3.1 mM QN results in a very slight inhibition of the specific growth rate (Fig. 1). No detectable reduction of cellular viability was registered in response to a sudden addition of the antimalarial drug, and no period of adaptation to QN stress was observed.
FIG. 1.
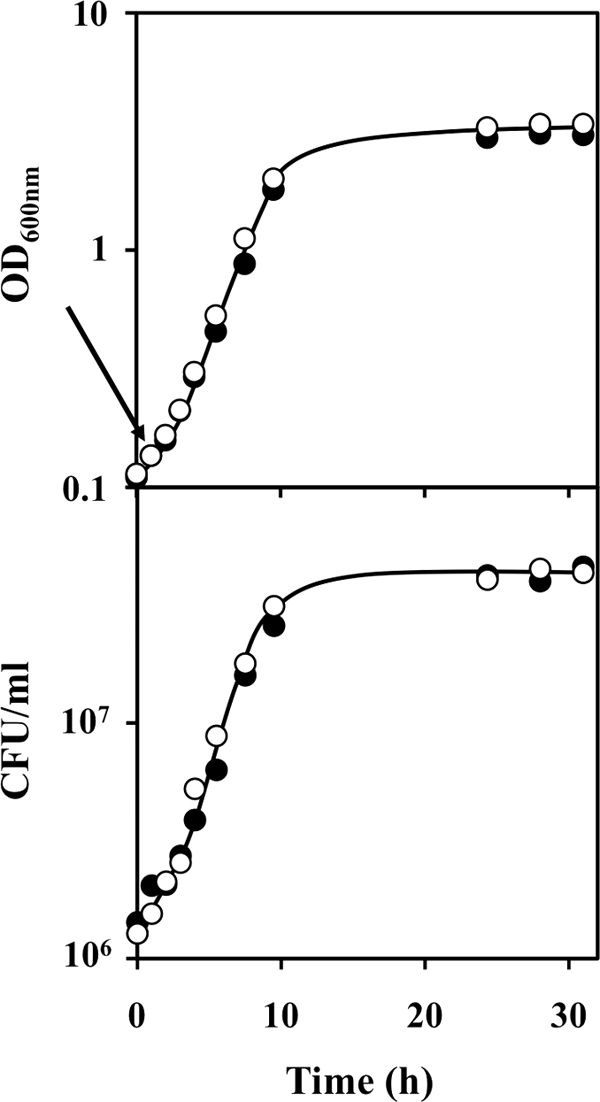
Comparison of the growth curves of Saccharomyces cerevisiae BY4741 in MM4 medium (open symbols) and in the same basal medium supplemented with a very mildly inhibitory concentration of QN (filled symbols). Growth was followed by measuring the OD600 or by determination of viable cell concentrations, assessed as the number of CFU per ml of cell culture. The results are representative of at least three independent growth experiments. The arrow indicates the time of incubation at which samples for microarray hybridization were harvested.
The transcriptomic profile yielded 156 genes that were differentially expressed in response to QN (applying a twofold threshold cutoff), out of which 80 were transcriptionally activated and 76 were downregulated (see Tables S1 and S2 in the supplemental material). In total, less than 3% of the annotated genome's transcripts were significantly changed. A marked percentage of both data sets (26% of the activated genes and 13% of the repressed genes) corresponds to uncharacterized ORFs or genes with poorly known functions. The remaining genes were clustered in functional categories based on known or inferred biological functions (see Tables S1 and S2 in the supplemental material) (Fig. 2). The genes that are upregulated by QN were grouped into four distinct functional categories: nutrient and energy metabolism, regulation of metabolism, membrane transport, and signal transduction. A similar analysis of the downregulated genes revealed an effect on processes of cell growth and/or maintenance, macromolecule metabolism, and nucleobase, nucleoside, nucleotide, and nucleic acid metabolism.
FIG. 2.

Functional categorization of genes differentially transcribed in response to QN. Genes showing an activation (upregulated) or repression (downregulated) level equal or greater than twofold after a 15-min treatment with 3.1 mM QN were clustered by functional categories based on the Gene Ontology resource (2) with manual adjustments.
A GOToolBox analysis (33) of the upregulated gene data set identified three functional categories that are significantly enriched compared to the entire yeast genome (Fig. 3), namely, “carbohydrate transport” (P = 7 × 10⁻⁶), “carbohydrate metabolism” (P = 0.006), and “monocarboxylic acid metabolic process” (P = 2 × 10⁻³). The first class includes genes that encode sugar membrane transporters (HXT2, HXT4, HXT6, HXT7, MAL11, and MAL31) and a member of the glucose-sensing signal transduction pathway (MTH1). The activation levels of HXT7, a high-affinity hexose transporter gene that is highly expressed at the transcriptional level under low-hexose conditions but is strongly repressed under high-glucose concentrations (62), were determined under QN stress. Consistent with the microarray data, HXT7 transcription was strongly activated following yeast cell exposure to 3.1 mM QN, as indicated by β-galactosidase assay of an HXT7-lacZ reporter fusion plasmid (Fig. 4). Moreover, HXT7 expression increased during the exponential phase of growth under QN stress, reaching an eightfold change by the end of the exponential phase.
FIG. 3.
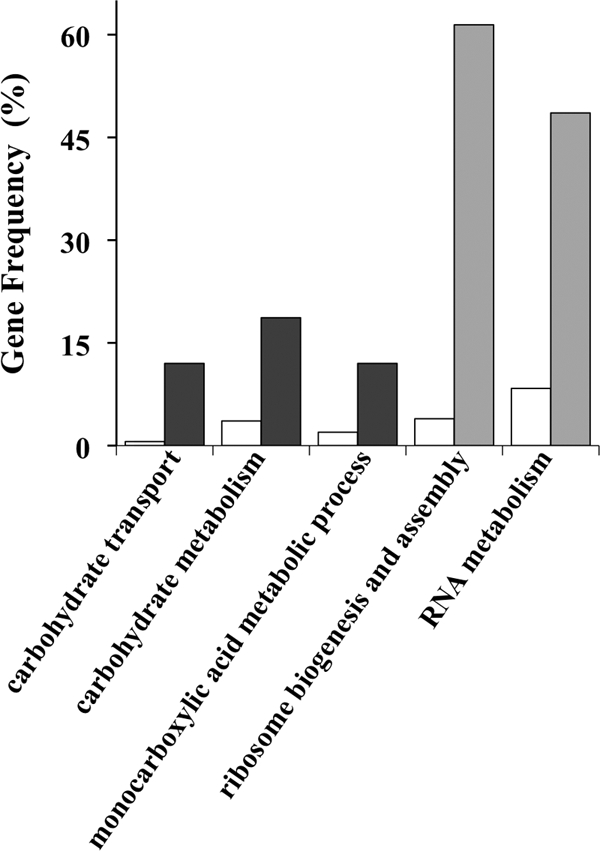
Schematic representation of the data set obtained from the transcriptomic profile of the yeast response to QN (dark bars, upregulated data set; gray bars, downregulated data set). Genes with altered transcription levels were grouped in functional categories according to the GOToolBox database and compared to the entire yeast genome (white bars). A hypergeometric test with Bonferroni correction was performed with a cutoff level of 6 (33). Only categories with statistical significance (P < 0.01) are shown.
FIG. 4.
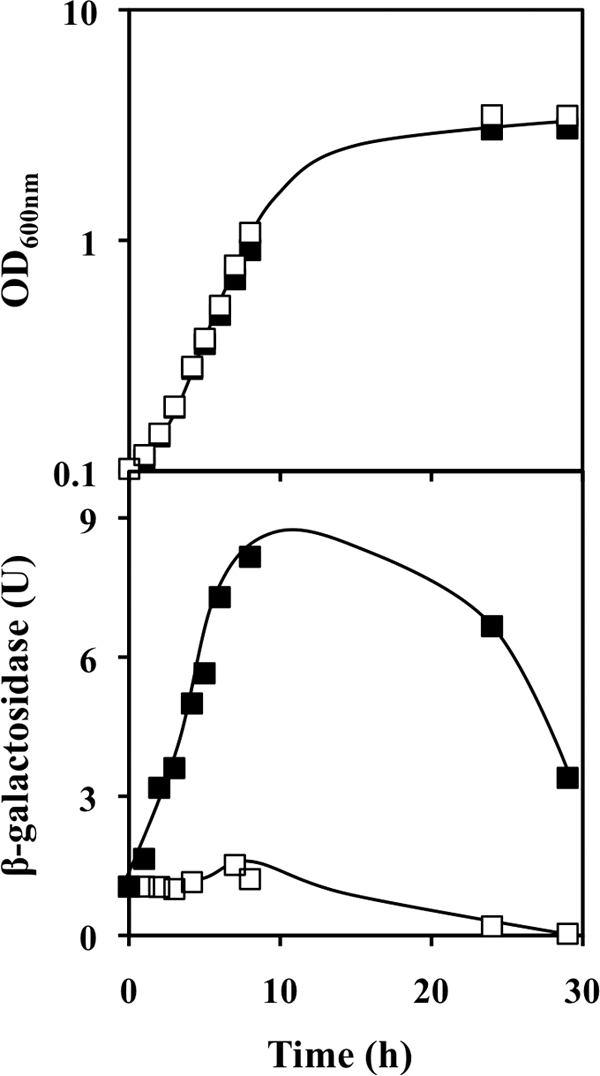
Expression of the high-affinity glucose transporter gene HXT7 is activated during the exponential phase of growth with a QN challenge. Yeast cells harboring an HXT7-lacZ fusion plasmid were grown in MM4 medium in the absence (open symbols) or presence (filled symbols) of 3.1 mM QN, and the respective β-galactosidase activities were recorded.
The enriched “carbohydrate metabolism” category includes genes encoding transcription factors that are involved in the low-glucose response (ADR1, GAL4, HAP4, and CAT8) and genes implicated in metabolism of glycogen (GSY1, GLG1, and GLC3), isocitrate (ICL1), citrate (CIT3), trehalose (ATH1), succinate (SDH2), and fructose bisphosphate (PFK27). The third enriched category, “monocarboxylic acid metabolic process,” again includes the transcriptional activator CAT8, as well as genes involved in metabolism of acetate (ALD6), citrate and isocitrate (CIT3 and ICL1), and pyruvate (PYK2). Conversely, among the genes downregulated in response to QN, the classes “ribosome biogenesis and assembly” (P = 3 × 10−36) and “RNA metabolism” (P = 2 × 10⁻¹¹) were enriched (Fig. 3), which is a typical feature of the yeast general stress response (12). In fact, ca. 80% of the genes that are downregulated under QN stress (see Table S2 in the supplemental material) are also downregulated in response to several other stresses, being part of the environmental stress response program (12).
QN induces glucose limitation response.
A considerable number of the genes found to be upregulated in response to QN (see Table S1 in the supplemental material) are usually activated under glucose limitation and are involved in the metabolism of alternative carbon sources and mobilization of energy reserves. In particular, the upregulation of a number of transcription factors involved in glucose derepression was observed. These include Cat8p and Adr1p, implicated in the regulation of a large number of genes required for the catabolism of nonfermentable carbon sources (17, 63). Similarly, Gis1p is involved in the expression of genes that control a broad range of adaptive mechanisms in response to nutrient limitation (39), while Gal4p and Mal33p regulate genes implicated in the utilization of galactose (4, 22) and maltose (9), respectively. Hap4p is a subunit of a glucose-repressed complex that is a global regulator known to activate genes expressed abundantly in aerobically growing cells (46). Among these transcription factors, Cat8p, Gal4p, and Hap4p are all gene targets of Mig1p, a transcriptional repressor with a central role in catabolite repression by glucose (11). Furthermore, the information and tools gathered in the YEASTRACT database (51) revealed that the documented gene targets of these regulators represent a large percentage of the QN-upregulated data set, more specifically, 13% for Cat8p, 4% for Gal4p, 24% for Hap4p, and 14% for Mig1p. Other important regulators of the upregulated data set known to be involved in the response to limiting glucose concentrations include Adr1p (30%), Nrg1p (25%), Nrg2p (19%), Mig2p (10%), Mig3p (4%), and Gis1p (6%).
There are several other glucose signaling and transport pathway elements that are upregulated in QN-exposed cells, namely, Snf3p, a plasma membrane glucose sensor that regulates glucose uptake (36); Mth1p, a protein that negatively regulates the glucose-sensing signal transduction pathway (28); Sks1, a putative serine/threonine protein kinase which is involved in the adaptation to limiting concentrations of glucose independently of the Snf3p-regulated pathway (61); and Csr2p, a nuclear protein with a potential regulatory role in the utilization of galactose and other nonfermentable carbon sources (24). Significantly, the four hexose transporters that form the moderate- and high-affinity glucose uptake system (Hxt2p, Hxt4p, and Hxt6/7p [32]) all showed different levels of activation in response to QN (see Table S1 in the supplemental material).
Using the information compiled in the YEASTRACT database (51) and the upregulated data set as input, we obtained a network of transcriptional associations for the regulators that had a previously described role in the glucose limitation response (Fig. 5a). The cellular response to QN treatment may thus follow a hypothetical chain of regulation comprising these regulators, where Mig1p is a central player, with a repression effect on several other network elements. Mig2p is a Mig1p paralogue with a similar role in glucose repression, as is Mig3p, but with a more modest contribution (31). MTH1 and SNF3 expression is repressed by glucose due to the combined action of Mig1p, Mig2p, and Mig3p, a repression that is turned on when high concentrations of glucose are available. Nrg1p is involved in the repression of several glucose-repressed genes and interacts physically with Snf1, a protein kinase essential for transcription of glucose-repressed genes in S. cerevisiae and involved in utilization of alternative carbon sources and gluconeogenesis (55); NRG1 transcript levels are elevated in response to glucose limitation or growth in nonfermentable carbon sources (3).
FIG. 5.

(a) A hypothetical network of transcriptional regulatory associations for the yeast cell response to glucose limitation under QN stress. The regulatory network was based on the microarray results listed in Table S1 in the supplemental material and on the documented regulatory associations between transcription factors and their target genes, as compiled in the YEASTRACT database (www.yeastract.com) (51). The entire upregulated data set was entered as target genes and grouped according to the respective regulators. Only transcription factors that have been described in the literature as regulators under glucose-limited conditions were included in the model network, together with MTH1 and SNF3, two target genes (white boxes) of the glucose-sensing pathway that are activated in response to QN. Documented associations may be direct, e.g., immunoprecipitation experiments (solid lines), or indirect, e.g., microarray data (dashed lines). The percentage of genes regulated by each transcription factor relative to the total number of genes in the data set is shown. The light-gray boxes indicate transcription factors that are included in the QN-upregulated data set. (b) The growth inhibition phenotype of S. cerevisiae cells induced by QN is reverted upon supplementation of medium with glucose. Suspensions of BY4741 parental strain cells grown to mid-exponential phase in basal medium were serially diluted and spotted on QN-containing MM4 plates, supplemented or not with 1% glucose (for a final 3% concentration). OD600s of cell cultures, from top to bottom, were 0.025, 0.005, and 0.0025.
This entire set of experimental results suggests that QN induces a glucose limitation response, further corroborated by the observation that increasing the glucose concentration in the growth medium to 3% alleviated the yeast growth inhibition phenotype induced by 5.2 mM QN in solid medium (Fig. 5b).
Deletion of hexose transport-related genes increases yeast resistance to QN.
A phenotypic analysis of deletion strains for various genes of interest (Table 1), including several that were upregulated in response to QN, as well as deletion strains for genes encoding proteins involved in low-glucose regulatory pathways, was performed. Among the strains tested, those deleted for HAP2 and MIG2 (involved in repression of gene expression by high levels of glucose); CRZ1, SKO1, and STP2 (implicated in regulation of metabolic processes); PHO2 and YAP1 (involved in particular in response to phosphate starvation and oxidative stress, respectively); and MUP3, PHO88, and PHO89 (encoding membrane transporters for methionine or inorganic phosphate uptake) were found to exhibit different degrees of increased susceptibility to QN (Table 1). In contrast, increased resistance to QN was observed in strains with single eliminations of several genes, such as of GAL4 or NRG2. Deletion of the signal transducers encoded by the genes SKS1 and SNF3, both involved in adaptation to low-glucose conditions via independent signaling pathways, also resulted in increased resistance to QN. Interestingly, the transmembrane Snf3p protein is a glucose sensor required for induction of HXT2 and HXT4 under glucose-limited conditions. Most remarkably, the same resistant phenotype was observed for strains deleted for genes encoding the hexose transporter proteins Hxt1p, Hxt2p, Hxt3p, Hxt4p, Hxt5p, Hxt8p, and Hxt10p (Fig. 6). Because HXT6 and HXT7 encode nearly identical proteins, differing in only two amino acids over the entire sequence, deletion strains for these transporters were not available in the EUROSCARF collection for testing. These results, taken together with what has been described so far, suggest that while these hexose transporters can be targets of QN, leading to inhibition of glucose uptake, it is also possible that they are involved in the uptake of QN into the yeast cell in competition with glucose import.
FIG. 6.

Deletion of hexose transporter-encoding genes increases yeast tolerance to QN. The susceptibilities to QN of S. cerevisiae parental strain BY4741 cells and of hexose transporter deletion mutants were compared by spot assays. Cellular suspensions grown to mid-exponential phase in basal medium were serially diluted and spotted on QN-containing MM4 plates, supplemented or not with 1% glucose (for a final 3% concentration). OD600s of cell cultures, from left to right, are 0.025, 0.005, and 0.0025.
Glucose uptake is inhibited by QN.
The kinetics of uptake of glucose into yeast cells challenged with QN were examined. To that effect, patterns of d-glucose uptake were obtained using 14C-labeled d-glucose with S. cerevisiae parental-strain cells grown in 2% glucose medium and harvested from mid-exponential cultures. Initial uptake of [14C]glucose was measured in the presence of QN in cells that had been incubated for 5 min at 30°C in the presence or absence of 4.6 mM QN. This higher drug concentration was increased from the 3.1 mM concentration used for the microarray experiments in order to account for the high cellular density required for the glucose uptake assays. Indeed, due to the poor solubility of QN in aqueous buffers, 4.6 mM is the maximum QN concentration that could be assayed in these experiments. For all conditions tested, the kinetics of glucose uptake were of the Michaelis-Menten type, and QN inhibited glucose uptake (Fig. 7). Remarkably, the calculated kinetic parameters point to a competitive inhibition of glucose uptake by QN in the cells that were incubated with drug and glucose simultaneously for only 5 s. Specifically, the maximum glucose uptake rates (Vmax) were 16.6 ± 2.6 or 16.8 ± 3.2 μmol·h−1 ·10−8 cells in the absence or presence of drug, respectively, while the affinity coefficient Km was increased from 26 ± 0.7 mM (for control cells) to 55.5 ± 2.1 mM (for cells with QN). However, when the cells were preincubated with the drug for 5 min before starting the uptake assay, the kinetics of glucose inhibition by QN were characteristic of a mixed inhibition. Under these conditions, the decrease in the Vmax was higher, reaching 11.1 μmol·h−1·10−8 cells, while the Km parameter also reached 51.9 mM (Fig. 7). These observations might be indicative of both competitive and noncompetitive effects of QN on glucose uptake. This mixed kinetics is probably related to an additional effect of the lipophilic QN over plasma membrane organization, thus affecting the function of the embedded hexose transporters. Indeed, we also performed these experiments following a 15-min preincubation with QN, with the objective of mimicking the glucose inhibitory effect registered for the microarray experiments, but observed that the Michaelis-Menten analysis for the longer incubation period yielded kinetic parameters similar to those calculated for the 5-min preincubation (data not shown). When the initial uptake of 25 mM [14C]glucose was determined in the presence of different QN concentrations for 5 s, the uptake rate was decreased with a dose-dependent effect up to 2.5 mM QN (Fig. 8).
FIG. 7.

QN has an inhibitory effect on glucose uptake. The initial rates of uptake of d-[U-14C]glucose were measured in glucose-grown S. cerevisiae cells in the absence (open circles) or presence (filled symbols) of 4.6 mM QN. The drug was either added simultaneously with labeled glucose (filled circles) or preincubated with cells for 5 min (triangles). Plots predicted by computational nonlinear regression (Origin; OriginLab Corporation) are drawn as solid lines. The resulting kinetic parameters are also shown. The data presented are results from at least three independent experiments, each performed in triplicate.
FIG. 8.
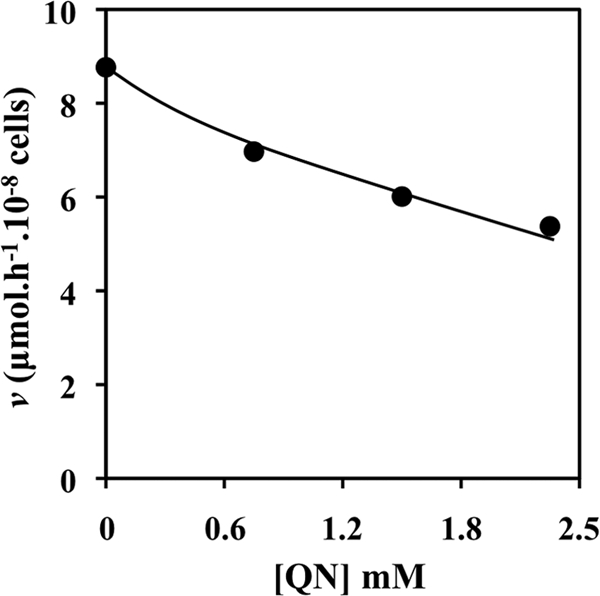
Inhibition of the initial glucose uptake rate by increasing concentrations of QN. Uptake of d-[U-14C]glucose was assayed in the presence of the indicated concentrations of QN. Uptake was measured for 5 s with 25 mM glucose. The resulting curve represents means ± standard errors (<2%), averaged from three independent experiments, each performed in triplicate.
Deletion of Hxt1p or Hxt2p leads to reduced accumulation of QN.
The demonstration that QN inhibits glucose uptake, presumably competitively during the first seconds of QN challenge, led us to again focus on the hexose transporters as putative facilitators of uptake of QN into the cell. To determine whether the resistance phenotype exhibited by the strains deleted for genes encoding each hexose transporter (Fig. 6) can be correlated with a reduced QN accumulation in the yeast cell, the levels of QN intracellular accumulation following a 15-min incubation with 3.1 mM QN were compared for the parental strain and for the Δhxt1 and Δhxt2 deletion mutant strains based on QN fluorescence. Utilization of isotopically labeled QN for these intracellular accumulation assays proved to be highly unreliable due to detectable QN precipitation, both in the low-volume reaction mix and on the filter. This fact led us to adapt and use a methodology based on fluorescence spectroscopy for the quantitative measurement of QN. This approach allowed the use of cellular suspensions under the same conditions used for the microarray experiments, where the larger volumes of cell suspensions used and the whole experimental design reduced the impact of experimental variation due to the low solubility of QN. For the deleted genes, we chose HXT1 and HXT2 since they represent the low- and moderate- to high-affinity glucose transporters, usually expressed under different conditions. The mutant cells, which display a marked resistance phenotype for QN (Fig. 6), were found to accumulate less drug intracellularly than the parental strain cells. Specifically, the accumulation levels of QN were approximately 20% lower in the mutant cells devoid of each hexose transporter (Fig. 9).
FIG. 9.
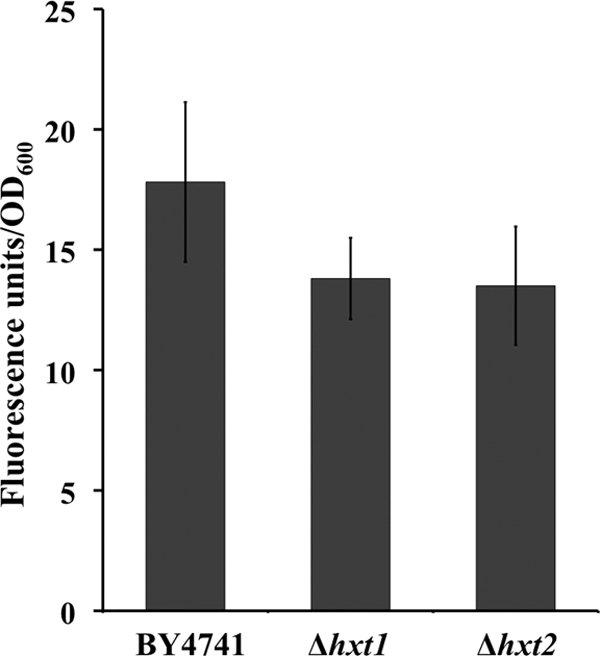
Comparison of the intracellular accumulations of QN in the parental strain and in the hexose transporter deletion mutants. The intracellular concentrations of QN in the different yeast strains were assayed by fluorescence spectroscopy after a 15-min incubation with 4.6 mM QN. The results represent means ± standard errors, averaged from three independent experiments.
DISCUSSION
QN was the first effective treatment against malaria and is still used today against severe Plasmodium falciparum malaria. But in spite of centuries of successful use, the antimalarial mode of action and the mechanisms underlying the emergence of resistance to QN are still a field of debate and active research. Studies of Plasmodium quinoline-resistant strains have led to various hypotheses being proposed to explain drug resistance (21), but nonetheless this remains a field of intense dispute (19, 27). In this study, we aimed to contribute to the elucidation of the antimalarial mechanisms of action of QN, using S. cerevisiae as an experimental eukaryotic model to obtain the transcriptional profile of the response to a very mild concentration of QN. This gentle treatment minimized the disturbing effects of QN on plasma membrane spatial organization, a characteristic trait of the action of lipophilic drugs. This experimental design resulted in the observation of a more specific response of the yeast cell to QN instead of a broader stress response with extensive nutrient starvation that is typical of significant plasma membrane disorganization. Indeed, many chemogenomic studies that have been carried out with yeast were performed under severe growth inhibition conditions or even during stress-induced death in the adaptation phase, where the most specific drug effects might be masked by the more general stress response. Our experimental strategy yielded a relatively small data set, comprising only 156 genes that were differentially expressed.
The transcriptional profile obtained is representative of a glucose limitation response to the drug, even though glucose is present in the growth medium at saturation concentrations. This response is underlined by the activation, among others, of SNF3, MTH1, HXT2, HXT4, HXT6, and HXT7 expression. Furthermore, the transcriptomic profile is reminiscent of recent global profilings of the yeast transcriptomic response to glucose limitation (5, 26, 60). Up to 30% of our entire upregulated data set is coincident with the subset of ORFs with specifically higher expression under glucose limitation conditions in those studies. Glucose is the universal carbon and energy source for most living organisms. In S. cerevisiae, glucose levels regulate gene expression via the glucose induction and glucose repression pathways (for a comprehensive review, see reference 45), intertwined in a regulatory network with feedback and feedforward components (23). The yeast genome encodes 18 putative glucose transporters, several of which have been extensively characterized and display various substrate affinities, as well as sophisticated glucose sensing and signaling mechanisms, allowing for an efficient use of glucose under different environmental conditions (38, 40). However, the most important hexose transporters under physiological conditions seem to be Hxt1 to -4 and Hxt6 and -7. Transcription of the high-affinity hexose transporters HXT6 and HXT7 is induced only by low levels of glucose, and the same is observed for the HXT2 and HXT4 genes, which are induced via a pathway that responds to signaling of Snf3p (34), a low-glucose transmembrane sensor. Snf3p and Mth1p are both repressed by glucose in a Mig1p-dependent pathway (23). Interestingly, the transcriptional level of the uncharacterized ORF YKR075c was 4.1-fold activated in our screen; this gene has also been suggested to operate under low levels of glucose, with a pattern of transcriptional regulation similar to those of HXT2 and HXT4 (31, 37). Our results point to a relief of the glucose repression phenotype that has the transcriptional repressor Mig1p at its core. Indeed, this protein is found at the center of a hypothetical regulatory network obtained for this data set. When glucose repression through Mig1p and Mig2p is relieved, MTH1 and SNF3 are activated (23), which is in tandem with the 9-fold and 3.4-fold activations registered for MTH1 and SNF3, respectively. These insights are further corroborated by the observed activation of hexose transporters with moderate and high affinity for glucose.
The glucose limitation response found in the presence of QN is probably a consequence of glucose transport inhibition by QN, either competitively or not. Glucose transport is inhibited by QN, with the affinity constant Km for glucose significantly increased when QN is added simultaneously with glucose while maintaining the Vmax. The fact that the inhibition is much more extensive (with a decreased Vmax in addition to a higher Km) when the cells are preincubated with QN before initiating the transport assays might be a reflection of this lipophilic drug's action on the plasma membrane. The observed inhibition of glucose uptake is thus probably a consequence of mixed effects with different specificities in its mechanisms of action. The component of competitive inhibition is suggestive of the uptake of QN mediated by the hexose transporters in competition with glucose uptake. Two experimental lines of evidence support this hypothesis: (i) the individual deletion of seven hexose transporter-encoding genes (HXT1, HXT2, HXT3, HXT4, HXT5, HXT8, and HXT10) resulted in increased QN resistance for the corresponding deletion strains; (ii) the intracellular accumulation of QN in the deletion mutants tested (Δhxt1 and Δhxt2 mutants) was reduced from that for parental strain cells. The measured reduction (ca. 20%) is not very significant but can be explained by a complementation effect provided by the redundant set of glucose transporters expressed at any time. Interestingly, drug uptake by the yeast hexose permeases has been previously described for arsenic trioxide (30), and those authors argue that this promiscuity by the hexose transporters is due to possible conformational similarities between glucose and arsenic trioxide molecules. In the case of QN, such similarities apparently cannot be invoked, but still, the experimental evidences shown point to a direct action of QN over the hexose transporters, which might be drug targets and/or have a role in QN import.
On the other hand, even if glucose uptake inhibition is the major effect of QN identified in this study, the results also suggest that the hexose transporter proteins might not be the sole targets of QN in yeast cells. Namely, the different levels of drug susceptibility exhibited by seemingly unrelated deletion strains (Table 1), as well as the kinetics of glucose uptake when cells have been preincubated with QN, are indicative that a set of nonidentified factors may be operating, possibly as part of the yeast general stress response program.
The results obtained in this study with the yeast model can be tentatively extrapolated to Plasmodium falciparum. The intraerythrocytic malaria parasite depends totally on the uptake of glucose from the external medium to fuel glycolysis and thereby generate ATP (58). Remarkably, while the yeast genome encodes a multitude of hexose uptake and sensing systems for low or high levels of sugar availability, glucose uptake in P. falciparum is mediated by the PfHT1 gene, a single-copy gene with no close paralogues, encoding a hexose transporter with a high level of homology with those corresponding to the yeast hexose transporter genes (41, 58). PfHT1, being the sole importer of the parasite's key energy substrate, is a worthy drug target for antimalarial therapy. Interestingly, studies are being performed for that objective, and hexose transport across the parasite's plasma membrane has been shown to be inhibited in vitro by an O-3-hexose derivative (41). On the other hand, the mechanisms that contribute to QN import and accumulation in Plasmodium cells are still a topic of study and debate. Passive diffusion of the drug across the parasite's membrane, which has been accepted for years to explain QN uptake into the cell, is now thought to account for only a fraction of QN accumulation. Indeed, the very high uptake rate of chloroquine into Plasmodium cells has raised questions pertaining to the existence of permeases that import quinoline drugs into the parasite cell (8, 14, 44), and recent work by Sanchez and coworkers (43) sustains that high accumulation of QN in the parasite is brought about by a carrier-mediated import system, but this putative QN transporter(s) was not identified. Comparable observations have been made for yeast with quinidine, a diastereomer of QN whose uptake into the yeast cell is extremely rapid (35). The uptake assays reported by the authors were carried out at an external pH of 5.5, at which quinidine (and QN) is basically in the single protonated form and not in the highly lipophilic unprotonated form which could pass freely through the plasma membrane by passive diffusion (57), implying the existence of alternative permeation pathways for quinidine in yeast. In conclusion, we believe that PfHT1 should be examined as an interesting candidate for these unknown QN carrier systems in P. falciparum. Our observations that QN inhibits glucose uptake in vivo in yeast suggest that this compound might have an antimalarial effect due to inhibition of PfHT1, with the consequent deprivation of the parasite of glucose. Interestingly, a similar substrate and inhibitory role of QN has already been described by several authors for the P. falciparum drug pump encoded by the PfMDR1 gene (18, 42). We conclude that PfHT1 is an interesting candidate target of QN, and this working hypothesis is considered to be worth testing in Plasmodium studies.
Supplementary Material
Acknowledgments
This research was supported by FEDER and Fundação para a Ciência e a Tecnologia (FCT) (contracts POCTI/BME/46526/2002 and PTDC/EIA/67722/2006 and grants to S.C.S. [SFRH/BD/32479/2006], M.P. [SFRH/BD/27663/2006], and S.T. [SFRH/BPD/5649/2001]).
Footnotes
Published ahead of print on 5 October 2009.
Supplemental material for this article may be found at http://aac.asm.org/.
REFERENCES
- 1.AlKadi, H. O. 2007. Antimalarial drug toxicity: a review. Chemotherapy 53:385-391. [DOI] [PubMed] [Google Scholar]
- 2.Ashburner, M., C. A. Ball, J. A. Blake, D. Botstein, H. Butler, J. M. Cherry, A. P. Davis, K. Dolinski, S. S. Dwight, J. T. Eppig, M. A. Harris, D. P. Hill, L. Issel-Tarver, A. Kasarskis, S. Lewis, J. C. Matese, J. E. Richardson, M. Ringwald, G. M. Rubin, and G. Sherlock. 2000. Gene ontology: tool for the unification of biology. The Gene Ontology Consortium. Nat. Genet. 25:25-29. [DOI] [PMC free article] [PubMed] [Google Scholar]
- 3.Berkey, C. D., V. K. Vyas, and M. Carlson. 2004. Nrg1 and Nrg2 transcriptional repressors are differently regulated in response to carbon source. Eukaryot. Cell 3:311-317. [DOI] [PMC free article] [PubMed] [Google Scholar]
- 4.Bhat, P. J., and T. V. Murthy. 2001. Transcriptional control of the GAL/MEL regulon of yeast Saccharomyces cerevisiae: mechanism of galactose-mediated signal transduction. Mol. Microbiol. 40:1059-1066. [DOI] [PubMed] [Google Scholar]
- 5.Boer, V. M., J. H. de Winde, J. T. Pronk, and M. D. Piper. 2003. The genome-wide transcriptional responses of Saccharomyces cerevisiae grown on glucose in aerobic chemostat cultures limited for carbon, nitrogen, phosphorus, or sulfur. J. Biol. Chem. 278:3265-3274. [DOI] [PubMed] [Google Scholar]
- 6.Brôco, N., S. Tenreiro, C. A. Viegas, and I. Sá-Correia. 1999. FLR1 gene (ORF YBR008c) is required for benomyl and methotrexate resistance in Saccharomyces cerevisiae and its benomyl-induced expression is dependent on Pdr3 transcriptional regulator. Yeast 15:1595-1608. [DOI] [PubMed] [Google Scholar]
- 7.Emerson, L. R., M. E. Nau, R. K. Martin, D. E. Kyle, M. Vahey, and D. F. Wirth. 2002. Relationship between chloroquine toxicity and iron acquisition in Saccharomyces cerevisiae. Antimicrob. Agents Chemother. 46:787-796. [DOI] [PMC free article] [PubMed] [Google Scholar]
- 8.Ferrari, V., and D. J. Cutler. 1991. Simulation of kinetic data on the influx and efflux of chloroquine by erythrocytes infected with Plasmodium falciparum. Evidence for a drug-importer in chloroquine-sensitive strains. Biochem. Pharmacol. 42(Suppl.):S167-S179. [DOI] [PubMed] [Google Scholar]
- 9.Feuermann, M., L. Charbonnel, J. De Montigny, J. C. Bloch, S. Potier, and J. L. Souciet. 1995. Sequence of a 9.8 kb segment of yeast chromosome II including the three genes of the MAL3 locus and three unidentified open reading frames. Yeast 11:667-672. [DOI] [PubMed] [Google Scholar]
- 10.Fonseca, C., R. Romao, H. Rodrigues de Sousa, B. Hahn-Hagerdal, and I. Spencer-Martins. 2007. L-Arabinose transport and catabolism in yeast. FEBS J. 274:3589-3600. [DOI] [PubMed] [Google Scholar]
- 11.Gancedo, J. M. 1998. Yeast carbon catabolite repression. Microbiol. Mol. Biol. Rev. 62:334-361. [DOI] [PMC free article] [PubMed] [Google Scholar]
- 12.Gasch, A. P., P. T. Spellman, C. M. Kao, O. Carmel-Harel, M. B. Eisen, G. Storz, D. Botstein, and P. O. Brown. 2000. Genomic expression programs in the response of yeast cells to environmental changes. Mol. Biol. Cell 11:4241-4257. [DOI] [PMC free article] [PubMed] [Google Scholar]
- 13.Gietz, D., A. St Jean, R. A. Woods, and R. H. Schiestl. 1992. Improved method for high efficiency transformation of intact yeast cells. Nucleic Acids Res. 20:1425. [DOI] [PMC free article] [PubMed] [Google Scholar]
- 14.Ginsburg, H., and T. G. Geary. 1987. Current concepts and new ideas on the mechanism of action of quinoline-containing antimalarials. Biochem. Pharmacol. 36:1567-1576. [DOI] [PubMed] [Google Scholar]
- 15.Gribble, F. M., T. M. Davis, C. E. Higham, A. Clark, and F. M. Ashcroft. 2000. The antimalarial agent mefloquine inhibits ATP-sensitive K-channels. Br. J. Pharmacol. 131:756-760. [DOI] [PMC free article] [PubMed] [Google Scholar]
- 16.Haurie, V., H. Boucherie, and F. Sagliocco. 2003. The Snf1 protein kinase controls the induction of genes of the iron uptake pathway at the diauxic shift in Saccharomyces cerevisiae. J. Biol. Chem. 278:45391-45396. [DOI] [PubMed] [Google Scholar]
- 17.Haurie, V., M. Perrot, T. Mini, P. Jeno, F. Sagliocco, and H. Boucherie. 2001. The transcriptional activator Cat8p provides a major contribution to the reprogramming of carbon metabolism during the diauxic shift in Saccharomyces cerevisiae. J. Biol. Chem. 276:76-85. [DOI] [PubMed] [Google Scholar]
- 18.Hayeshi, R., C. Masimirembwa, S. Mukanganyama, and A. L. Ungell. 2006. The potential inhibitory effect of antiparasitic drugs and natural products on P-glycoprotein mediated efflux. Eur. J. Pharm. Sci. 29:70-81. [DOI] [PubMed] [Google Scholar]
- 19.Hayward, R., K. J. Saliba, and K. Kirk. 2006. The pH of the digestive vacuole of Plasmodium falciparum is not associated with chloroquine resistance. J. Cell Sci. 119:1016-1025. [DOI] [PubMed] [Google Scholar]
- 20.Hellauer, K., G. Lesage, A.-M. Sdicu, and B. Turcotte. 2005. Large-scale analysis of genes that alter sensitivity to the anticancer drug tirapazamine in Saccharomyces cerevisiae. Mol. Pharmacol. 68:1365-1375. [DOI] [PubMed] [Google Scholar]
- 21.Jiang, H., D. A. Joy, T. Furuya, and X. Z. Su. 2006. Current understanding of the molecular basis of chloroquine-resistance in Plasmodium falciparum. J. Postgrad. Med. 52:271-276. [PubMed] [Google Scholar]
- 22.Johnston, M. 1987. A model fungal gene regulatory mechanism: the GAL genes of Saccharomyces cerevisiae. Microbiol. Rev. 51:458-476. [DOI] [PMC free article] [PubMed] [Google Scholar]
- 23.Kaniak, A., Z. Xue, D. Macool, J. H. Kim, and M. Johnston. 2004. Regulatory network connecting two glucose signal transduction pathways in Saccharomyces cerevisiae. Eukaryot. Cell 3:221-231. [DOI] [PMC free article] [PubMed] [Google Scholar]
- 24.Khanday, F. A., M. Saha, and P. J. Bhat. 2002. Molecular characterization of MRG19 of Saccharomyces cerevisiae. Implication in the regulation of galactose and nonfermentable carbon source utilization. Eur. J. Biochem. 269:5840-5850. [DOI] [PubMed] [Google Scholar]
- 25.Kohrer, K., and H. Domdey. 1991. Preparation of high molecular weight RNA. Methods Enzymol. 194:398-405. [DOI] [PubMed] [Google Scholar]
- 26.Kolkman, A., P. Daran-Lapujade, A. Fullaondo, M. M. Olsthoorn, J. T. Pronk, M. Slijper, and A. J. Heck. 2006. Proteome analysis of yeast response to various nutrient limitations. Mol. Syst. Biol. 2:2006.0026. [DOI] [PMC free article] [PubMed] [Google Scholar]
- 27.Kuhn, Y., P. Rohrbach, and M. Lanzer. 2007. Quantitative pH measurements in Plasmodium falciparum-infected erythrocytes using pHluorin. Cell. Microbiol. 9:1004-1013. [DOI] [PubMed] [Google Scholar]
- 28.Lafuente, M. J., C. Gancedo, J. C. Jauniaux, and J. M. Gancedo. 2000. Mth1 receives the signal given by the glucose sensors Snf3 and Rgt2 in Saccharomyces cerevisiae. Mol. Microbiol. 35:161-172. [DOI] [PubMed] [Google Scholar]
- 29.Li, C., and W. Hung Wong. 2001. Model-based analysis of oligonucleotide arrays: model validation, design issues and standard error application. Genome Biol. 2:RESEARCH0032. [DOI] [PMC free article] [PubMed] [Google Scholar]
- 30.Liu, Z., E. Boles, and B. P. Rosen. 2004. Arsenic trioxide uptake by hexose permeases in Saccharomyces cerevisiae. J. Biol. Chem. 279:17312-17318. [DOI] [PubMed] [Google Scholar]
- 31.Lutfiyya, L. L., V. R. Iyer, J. DeRisi, M. J. DeVit, P. O. Brown, and M. Johnston. 1998. Characterization of three related glucose repressors and genes they regulate in Saccharomyces cerevisiae. Genetics 150:1377-1391. [DOI] [PMC free article] [PubMed] [Google Scholar]
- 32.Maier, A., B. Volker, E. Boles, and G. F. Fuhrmann. 2002. Characterisation of glucose transport in Saccharomyces cerevisiae with plasma membrane vesicles (countertransport) and intact cells (initial uptake) with single Hxt1, Hxt2, Hxt3, Hxt4, Hxt6, Hxt7 or Gal2 transporters. FEMS Yeast Res. 2:539-550. [DOI] [PubMed] [Google Scholar]
- 33.Martin, D., C. Brun, E. Remy, P. Mouren, D. Thieffry, and B. Jacq. 2004. GOToolBox: functional analysis of gene datasets based on Gene Ontology. Genome Biol. 5:R101. [DOI] [PMC free article] [PubMed] [Google Scholar]
- 34.Mosley, A. L., J. Lakshmanan, B. K. Aryal, and S. Ozcan. 2003. Glucose-mediated phosphorylation converts the transcription factor Rgt1 from a repressor to an activator. J. Biol. Chem. 278:10322-10327. [DOI] [PubMed] [Google Scholar]
- 35.Nunes, P. A., S. Tenreiro, and I. Sá-Correia. 2001. Resistance and adaptation to quinidine in Saccharomyces cerevisiae: role of QDR1 (YIL120w), encoding a plasma membrane transporter of the major facilitator superfamily required for multidrug resistance. Antimicrob. Agents Chemother. 45:1528-1534. [DOI] [PMC free article] [PubMed] [Google Scholar]
- 36.Ozcan, S., J. Dover, and M. Johnston. 1998. Glucose sensing and signaling by two glucose receptors in the yeast Saccharomyces cerevisiae. EMBO J. 17:2566-2573. [DOI] [PMC free article] [PubMed] [Google Scholar]
- 37.Ozcan, S., J. Dover, A. G. Rosenwald, S. Wolfl, and M. Johnston. 1996. Two glucose transporters in Saccharomyces cerevisiae are glucose sensors that generate a signal for induction of gene expression. Proc. Natl. Acad. Sci. USA 93:12428-12432. [DOI] [PMC free article] [PubMed] [Google Scholar]
- 38.Ozcan, S., and M. Johnston. 1999. Function and regulation of yeast hexose transporters. Microbiol. Mol. Biol. Rev. 63:554-569. [DOI] [PMC free article] [PubMed] [Google Scholar]
- 39.Pedruzzi, I., N. Burckert, P. Egger, and C. De Virgilio. 2000. Saccharomyces cerevisiae Ras/cAMP pathway controls post-diauxic shift element-dependent transcription through the zinc finger protein Gis1. EMBO J. 19:2569-2579. [DOI] [PMC free article] [PubMed] [Google Scholar]
- 40.Rolland, F., J. Winderickx, and J. M. Thevelein. 2002. Glucose-sensing and -signalling mechanisms in yeast. FEMS Yeast Res. 2:183-201. [DOI] [PubMed] [Google Scholar]
- 41.Saliba, K. J., S. Krishna, and K. Kirk. 2004. Inhibition of hexose transport and abrogation of pH homeostasis in the intraerythrocytic malaria parasite by an O-3-hexose derivative. FEBS Lett. 570:93-96. [DOI] [PubMed] [Google Scholar]
- 42.Sanchez, C. P., A. Rotmann, W. D. Stein, and M. Lanzer. 2008. Polymorphisms within PfMDR1 alter the substrate specificity for anti-malarial drugs in Plasmodium falciparum. Mol. Microbiol. 70:786-798. [DOI] [PubMed] [Google Scholar]
- 43.Sanchez, C. P., W. D. Stein, and M. Lanzer. 2008. Dissecting the components of quinine accumulation in Plasmodium falciparum. Mol. Microbiol. 67:1081-1093. [DOI] [PubMed] [Google Scholar]
- 44.Sanchez, C. P., S. Wunsch, and M. Lanzer. 1997. Identification of a chloroquine importer in Plasmodium falciparum. Differences in import kinetics are genetically linked with the chloroquine-resistant phenotype. J. Biol. Chem. 272:2652-2658. [DOI] [PubMed] [Google Scholar]
- 45.Santangelo, G. M. 2006. Glucose signaling in Saccharomyces cerevisiae. Microbiol. Mol. Biol. Rev. 70:253-282. [DOI] [PMC free article] [PubMed] [Google Scholar]
- 46.Schuller, H. J. 2003. Transcriptional control of nonfermentative metabolism in the yeast Saccharomyces cerevisiae. Curr. Genet. 43:139-160. [DOI] [PubMed] [Google Scholar]
- 47.Snyders, D. J., and S. W. Yeola. 1995. Determinants of antiarrhythmic drug action. Electrostatic and hydrophobic components of block of the human cardiac hKv1.5 channel. Circ. Res. 77:575-583. [DOI] [PubMed] [Google Scholar]
- 48.Spencer-Martins, I., and N. van Uden. 1985. Catabolite interconversion of glucose transport systems in the yeast Candida wickerhamii. Biochim. Biophys. Acta 812:168-172. [DOI] [PubMed] [Google Scholar]
- 49.Sullivan, D. J., Jr., I. Y. Gluzman, D. G. Russell, and D. E. Goldberg. 1996. On the molecular mechanism of chloroquine's antimalarial action. Proc. Natl. Acad. Sci. USA 93:11865-11870. [DOI] [PMC free article] [PubMed] [Google Scholar]
- 50.Teixeira, M. C., A. R. Fernandes, N. P. Mira, J. D. Becker, and I. Sá-Correia. 2006. Early transcriptional response of Saccharomyces cerevisiae to stress imposed by the herbicide 2,4-dichlorophenoxyacetic acid. FEMS Yeast Res. 6:230-248. [DOI] [PubMed] [Google Scholar]
- 51.Teixeira, M. C., P. Monteiro, P. Jain, S. Tenreiro, A. Fernandes, N. P. Mira, M. Alenquer, A. T. Freitas, A. L. Oliveira, and I. Sá-Correia. 2006. The YEASTRACT database: a tool for the analysis of transcription regulatory associations in Saccharomyces cerevisiae. Nucleic Acids Res. 34:D446-D451. [DOI] [PMC free article] [PubMed] [Google Scholar]
- 52.van Es, H. H., H. Renkema, H. Aerts, and E. Schurr. 1994. Enhanced lysosomal acidification leads to increased chloroquine accumulation in CHO cells expressing the pfmdr1 gene. Mol. Biochem. Parasitol. 68:209-219. [DOI] [PubMed] [Google Scholar]
- 53.Vargas, R. C., R. Garcìa-Salcedo, S. Tenreiro, M. C. Teixeira, A. R. Fernandes, J. Ramos, and I. Sá-Correia. 2007. Saccharomyces cerevisiae multidrug resistance transporter Qdr2 is implicated in potassium uptake, providing a physiological advantage to quinidine-stressed cells. Eukaryot. Cell 6:134-142. [DOI] [PMC free article] [PubMed] [Google Scholar]
- 54.Vargas, R. C., S. Tenreiro, M. C. Teixeira, A. R. Fernandes, and I. Sá-Correia. 2004. Saccharomyces cerevisiae multidrug transporter Qdr2p (Yil121wp): localization and function as a quinidine resistance determinant. Antimicrob. Agents Chemother. 48:2531-2537. [DOI] [PMC free article] [PubMed] [Google Scholar]
- 55.Vyas, V. K., S. Kuchin, and M. Carlson. 2001. Interaction of the repressors Nrg1 and Nrg2 with the Snf1 protein kinase in Saccharomyces cerevisiae. Genetics 158:563-572. [DOI] [PMC free article] [PubMed] [Google Scholar]
- 56.Warhurst, D. C., J. C. Craig, I. S. Adagu, D. J. Meyer, and S. Y. Lee. 2003. The relationship of physico-chemical properties and structure to the differential antiplasmodial activity of the cinchona alkaloids. Malar. J. 2:26-39. [DOI] [PMC free article] [PubMed] [Google Scholar]
- 57.Warhurst, D. C., J. C. Craig, I. S. Adagu, D. J. Meyer, and S. Y. Lee. 2003. The relationship of physico-chemical properties and structure to the differential antiplasmodial activity of the cinchona alkaloids. Malar. J. 2:26. [DOI] [PMC free article] [PubMed] [Google Scholar]
- 58.Woodrow, C. J., J. I. Penny, and S. Krishna. 1999. Intraerythrocytic Plasmodium falciparum expresses a high affinity facilitative hexose transporter. J. Biol. Chem. 274:7272-7277. [DOI] [PubMed] [Google Scholar]
- 59.World Health Organization. 2006. Guidelines for the treatment of malaria. World Health Organization, Geneva, Switzerland.
- 60.Wu, J., N. Zhang, A. Hayes, K. Panoutsopoulou, and S. G. Oliver. 2004. Global analysis of nutrient control of gene expression in Saccharomyces cerevisiae during growth and starvation. Proc. Natl. Acad. Sci. USA 101:3148-3153. [DOI] [PMC free article] [PubMed] [Google Scholar]
- 61.Yang, Z., and L. F. Bisson. 1996. The SKS1 protein kinase is a multicopy suppressor of the snf3 mutation of Saccharomyces cerevisiae. Yeast 12:1407-1419. [DOI] [PubMed] [Google Scholar]
- 62.Ye, L., J. A. Berden, K. van Dam, and A. L. Kruckeberg. 2001. Expression and activity of the Hxt7 high-affinity hexose transporter of Saccharomyces cerevisiae. Yeast 18:1257-1267. [DOI] [PubMed] [Google Scholar]
- 63.Young, E. T., K. M. Dombek, C. Tachibana, and T. Ideker. 2003. Multiple pathways are coregulated by the protein kinase Snf1 and the transcription factors Adr1 and Cat8. J. Biol. Chem. 278:26146-26158. [DOI] [PubMed] [Google Scholar]
Associated Data
This section collects any data citations, data availability statements, or supplementary materials included in this article.