Abstract
Assimilable organic carbon (AOC) is an important parameter governing the growth of heterotrophic bacteria in drinking water. Despite the recognition that variations in treatment practices (e.g., disinfection, coagulation, selection of filter media, and watershed protection) can have dramatic impacts on AOC levels in drinking water, few water utilities routinely measure AOC levels because of the difficulty of the method. To simplify the method, the Pseudomonas fluorescens P-17 and Spirillum sp. strain NOX test bacteria were mutagenized by using luxCDABE operon fusion and inducible transposons to produce bioluminescent strains. The growth of these strains can easily be monitored with a programmable luminometer to determine the maximum cell yield via luminescence readings, and these values can be fitted to the classical Monod growth curve to determine bacterial growth kinetics and the maximum growth rate. Standard curves using acetate carbon (at concentrations ranging from 0 to 1,000 μg/liter) resulted in coefficients of determination (r2) between luminescence units and acetate carbon levels of 0.95 for P-17 and 0.89 for NOX. The bioluminescence test was used to monitor reclaimed water, in which average AOC levels range between 150 and 1,400 μg/liter acetate carbon equivalents. Comparison of the conventional AOC assay and the bioluminescent assay produced an r2 of 0.92.
Biodegradable organic matter is used by heterotrophic bacteria for carbon and energy. Easily biodegradable carbon can lead to high levels of bacterial growth (2, 7, 8). The assimilable organic carbon (AOC) assay offers a standardized measurement of the heterotrophic bacterial growth potential of treated water and was originally developed by van der Kooij (13, 14). van der Kooij's method utilized two bacterial strains (Pseudomonas fluorescens P-17 and Spirillum sp. strain NOX) chosen for their nutritional requirements. AOC test results are considered to be more an indicator of the biological growth potential of the water and less a direct measurement of biodegradable carbon because the limiting nutrient may not be carbon (10). AOC is an important parameter governing the growth of bacteria in drinking water. AOC levels as low as 10 μg/liter can result in excessive growth of heterotrophic plate count bacteria in the absence of a chlorine residual. Even in the presence of a chlorine residual, AOC levels of >100 μg/liter have been associated with problems related to coliform and mycobacterium regrowth and possible regulatory noncompliance. High organic carbon levels, warm temperatures, and low levels of disinfectant residuals lead to water distribution system problems, including iron pipe corrosion, the growth of opportunistic pathogens (e.g., Mycobacterium avium, Aeromonas hydrophila, and Legionella pneumophila) in distribution system pipe biofilms, and bacterial regrowth in distributed water (9, 11, 13, 15). In distributed water, bacterial regrowth is perhaps the most significant mechanism for water quality deterioration between the treatment plant and the end user.
AOC is the fraction of natural organic matter that is most readily used by bacteria for multiplication and is of greatest interest to drinking water utilities. Despite the recognition that variations in treatment practices (e.g., disinfection, coagulation, selection of filter media, and watershed protection) can have dramatic impacts on AOC levels in drinking water, few water utilities routinely measure AOC levels because of the complexity and difficulty of the method. Previous work attempted to simplify the method by measuring ATP instead of determining plate counts (10), but problems with commercial ATP measurement reagents discouraged utility laboratory adoption of this technique (3). The plate count and ATP methods are complex, time-consuming, and cumbersome, requiring a week or more of turnaround time before results are available. The methods are also expensive because of the technical labor involved in assaying ATP levels from filter-concentrated cells or in spread plating samples and determining plate CFU counts. These issues hindered routine determination of AOC levels and, therefore, strategies to optimize treatment for AOC removal. To simplify the method, P-17 and NOX test bacteria were mutagenized with luxCDABE operon fusion and inducible transposons to produce bioluminescent strains (4), but the engineered strains were shown to be marginally effective in low-sensitivity analog luminometers.
The present work describes a rapid AOC test that uses the bioluminescent strains in conjunction with a sensitive, photon-counting luminometer. Combining the instrumentation and the bioluminescent derivatives has resulted in an easy-to-use AOC test that has been successfully applied to various water matrices. Standard curves were developed to determine the responses of the bioluminescent strains to various acetate carbon concentrations. Luminescence levels were converted to acetate carbon equivalents (based on standard curves) by using the Monod model, and maximum growth yield values were evaluated and compared. In addition, a yearlong study was conducted to measure the biological stability within reclaimed-water distribution systems from four geographically diverse reclaimed-water facilities that employed a variety of physical, chemical, and biological treatment combinations to treat wastewater effluents. In this study, average AOC levels were 10 times higher than those typically found in drinking water distribution systems and ranged from 150 to 1,400 μg/liter.
MATERIALS AND METHODS
Glassware.
The glassware used for standard curve determinations and sample collection were graduated, 250-ml borosilicate bottles (KIMAX; Kimble Chase, Vineland, NJ) and were rendered carbon free through the following procedure: bottles were washed with 2% Citrajet (Alconox, White Plains, NY), rinsed three times with water treated in a Milli-Q Academic system (Millipore Corporation, Billerica, MA), air dried, and then baked in a muffle oven at 550°C for 6 h to oxidize any residual carbon. Milli-Q water is prepared using reverse-osmosis-treated deionized water that is passed through two ultrapure-grade mixed-bed ion-exchange resins (Q-Gard 2 and Quantum Ex cartridges) to meet requirements for ASTM type 1 water with total organic carbon (TOC) levels of <10 ppb and >18.0 MΩ·cm at 25°C. Treated water is then passed through a final 0.22-μm filter (Millipak Express 20 filter unit). Bottle closures were black polypropylene caps welded to a polytetrafluoroethylene-silicone liner (Kimble/Kontes, Vineland, NJ). The polytetrafluoroethylene-silicone liner eliminates the possibility of glue contamination of bottle contents. Closures were washed in detergent and then soaked overnight in 10% hydrochloric acid (American Chemical Society grade; EMD Chemicals, Gibbstown, NJ), rinsed three times with Milli-Q water, dried, and autoclaved.
Bacteria, media, diluents, and culture conditions.
Bioluminescent derivatives of the standard AOC test bacteria P. fluorescens P-17 and Spirillum sp. strain NOX were characterized previously (4), and stocks of these bacteria were stored at −80°C in 20% glycerol-2% peptone as described previously. The bioluminescent strains previously characterized as P-17 GF8 and NOX GF3 will be referred to hereinafter simply as P-17 and NOX. Bacteria were recovered from frozen stocks by being streaked onto R2A agar (Difco Laboratories, Detroit, MI) and incubated at room temperature (20 to 25°C) for 3 to 5 days. Single colonies were inoculated into a medium containing 2 mg of acetate carbon per liter (10) and grown for 7 days at room temperature. Bacterial densities of stock solutions were monitored by spread plating of samples onto R2A agar and were generally close to 3.5 × 10⁶ and 1.3 × 10⁷ CFU/ml for strains P-17 and NOX, respectively. The cultures were then stored at 4°C for up to 40 days for the inoculation of water samples.
Standard curves.
Standard curves were developed using a mineral salt buffer with acetate carbon concentrations ranging from 0 to 1,000 μg/liter. A 1,000× mineral salt buffer stock was prepared by adding the following chemicals to 1 liter of Milli-Q water: 7.0 g K2HPO4 (anhydrous; EMD Chemicals, Gibbstown, NJ), 3.0 g KH2PO4 (crystalline; Mallinckrodt, Phillipsburg, NJ), 0.1 g MgSO4·7H2O (J. T. Baker, Phillipsburg, NJ), 1.0 g (NH4)2SO4 (anhydrous; J. T. Baker), 0.1 g NaCl (anhydrous; EMD), and 1.8 mg FeSO4·7H2O (J. T. Baker). The stock was mixed thoroughly and then autoclaved for sterility. Working solutions used for the standard curves were prepared with Milli-Q water to have a final buffer concentration of 1×; working solutions were adjusted to pH 7.2 ± 0.2 with 0.1 N NaOH (TITRISTAR*; EMD Chemicals, Gibbstown, NJ) prior to autoclaving.
A 200-mg/liter stock solution of acetate carbon was prepared by adding 113 mg of sodium acetate (American Chemical Society grade; Mallinckrodt, Paris, KY) to 100 ml of Milli-Q water. The acetate carbon stock was then sterile filtered into an autoclaved borosilicate bottle by using an Acrodisc syringe filter 0.2-μm HT Tuffryn membrane (PALL, East Hills, NY) and a 10-ml Luer-Lok-tip syringe (BD, Franklin Lakes, NJ). Standard curve test solutions were prepared by adding the requisite volume of acetate stock to sterile Milli-Q water-1× buffer to reach acetate carbon concentrations ranging from 50 to 1,000 μg per liter. Acetate carbon concentrations were verified by TOC analysis using a Shimadzu 5000 TOC analyzer according to standard method 5310 (1).
Carbon solutions were inoculated separately with 104 viable cells of P-17 or NOX per ml. Samples were swirled to mix, and 300-μl aliquots were removed and added to microplates at various intervals. To maintain sterility for testing purposes, transfer of the samples was completed within a laminar flow hood (SterilGARD II; The Baker Co., Sanford, ME).
Luminometer.
The assay used the bioluminescent strains in conjunction with a high-sensitivity, automated, ultrafast photon-counting luminometer (LMax II; Molecular Devices, Sunnyvale, CA) in a convenient 96-well microplate format. Very-low-cross-talk white polystyrene microtiter plates (Thermo Scientific Corporation, Milford, MA) were used. Samples of 300 μl were added to the plates in duplicate, and luminescence over 30-s intervals was measured. Readings were reported in relative light units, which were defined as 10,000 times the integral of the photon count versus the time-reaction curve. Units were considered to be relative because the formula can be modified manually, which added to the ease of data monitoring and reporting. Counting began immediately following injection of the substrate n-decanal (30 μl), an artificial luminescence substrate producing detectable light at the low cell densities encountered in AOC assays (4), directly into the microplate well. The substrate solution was prepared as 0.2% (vol/vol) n-decanal in a volumetric flask by delivering 500 μl of n-decanal (MP Biomedicals, Solon, OH) into 250 ml of 200-proof ethyl alcohol (EM Science, Gibbstown, NJ). This solution was then transferred into the injection reservoir on the luminometer.
Plate counts.
Parallel plate count assays were performed by serial 10-fold dilution of the test solutions in standard method 9050 C buffer (1), followed by spread plating of triplicate 0.1-ml aliquots onto R2A agar. Colonies numbering 30 to 300 per plate were enumerated after 3, 4, and 5 days of growth at room temperature. Plate count AOC values were expressed as the means of results for at least two replicates and were converted to acetate carbon equivalents by using the standard conversion factors: 4.1 × 10³ P-17 CFU/ml equals 1 μg P-17 AOC/liter, and 1.2 × 10⁴ NOX CFU/ml equals 1 μg NOX AOC/liter (13, 14). Plate count AOC values were reported as the sum of values obtained with P-17 and NOX.
Collection and preparation of reclaimed-water samples.
Samples were collected from four facilities in California, Florida, Massachusetts, and New York as part of a larger study to evaluate the biostability of reclaimed waters. Samples were collected from the reclaimed effluent, reclaimed water subjected to storage, and three points within each distribution system (DS1 to DS3). Samples were collected into sterile, carbon-free borosilicate KIMAX bottles (see “Glassware” above) which contained sodium thiosulfate to quench any residual disinfectant (1). Adding thiosulfate has not been found to significantly stimulate the growth of P-17 or NOX (5). Samples were shipped overnight at 4°C to the laboratory. Upon arrival, the samples were brought to room temperature and the pH was checked, recorded, and adjusted to 7.2 ± 0.2 if necessary. Each sample was then split into two 50-ml aliquots and pasteurized for 30 min once the temperature of the proxy reached 70°C. After pasteurization, the cooled samples were inoculated separately with P-17 and NOX to approximately 104 CFU per ml. Samples were gently swirled, and duplicate 300-μl aliquots were transferred onto the sample microplates. Transfers were made immediately postinoculation and then at intervals of generally 2 to 5 h until peak luminescence (corresponding to maximum growth [Nmax]) was reached. To validate the method, parallel plate counts were performed along with the measurement of luminescence. Sample preparation and plate counts were carried out in a separate laboratory in which neither ethanol nor other volatile organic materials were used.
RESULTS AND DISCUSSION
Bioluminescence development.
Previous work had generated genetically modified strains of the AOC test bacteria P. fluorescens P-17 and Spirillum sp. strain NOX by using transposon mutagenesis for the insertion of the luxCDABE luminescence operon (4). These strains had been developed for use on a luminometer and do not require an inducer for the expression of luminescence because the gene fusion strains are luminescent by native P-17 and NOX expression mechanisms. The reasoning for using a bioluminescent mutant was based on the fact that peak luminescence is an early physiological indicator of full cell yield. The maximum growth of the sample can then be measured by luminescence readings or by the traditional stationary-phase plate counts. The luminescent strains were compared to the parent strains by the conventional van der Kooij method, and the comparison resulted in coefficients of determination (r2) of 0.97 and 0.99 for P-17 and NOX, respectively (4). The strains were able to measure AOC at a sensitivity corresponding to <10 μg/liter. The use of a photon-counting luminometer and a microplate assay format with automated reagent injection further increases the applicability and ease of the method because measurements may be collected at predetermined intervals and the unit can maintain a constant temperature. The increased frequency of monitoring was deemed important because daily testing may allow the peak in luminescence to be missed.
Standard curve results.
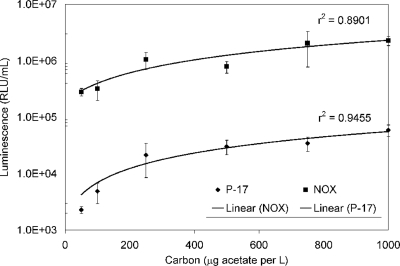
The peak luminescence from bacterial growth at various carbon concentrations ranging from 50 to 1,000 μg acetate carbon per liter was measured in separate experiments conducted over several weeks. Acetate was used because it is the reference carbon source for the AOC assay (1). The total numbers of data points collected were 24 and 25 for P-17 and NOX, respectively. For each concentration, there were at least three separate replicate tests and the average coefficient of variation among the test results was 32% for P-17 and NOX. Regression analysis of the six-point standard curve between luminescence units and acetate carbon levels produced r2 values of 0.89 (NOX) and 0.95 (P-17) (Fig. 1).
FIG. 1.
Luminescence-based standard curve results for AOC. RLU, relative light units.
Modeling of the maximum growth, lability, and kinetics.
In previous versions of the AOC test (10, 13, 14), the growth of the AOC strains was measured daily to determine the maximum level (Nmax), and only that data point was used to determine the AOC value. In contrast, the bioluminescence-based AOC test can conduct measurements as frequently as the user wishes, which may be at hourly intervals depending on the number of samples and other testing constraints, and the test fits the entire growth curve to the following Monod equation to estimate the maximum growth level.
 |
(1) |
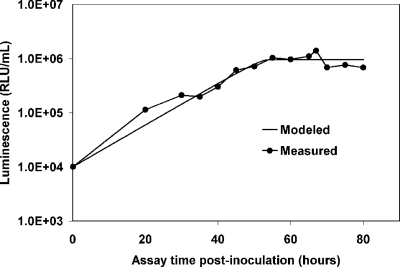
Bacterial uptake of the substrate was modeled by solving the equation for the maximum growth rate (μmax), which is a function of the available carbon concentration. The substrate concentration (S) is determined by converting luminescence units into carbon equivalents by using the standard curve (Fig. 1). The rate of substrate utilization is proportional to the luminescence produced by the bacteria. Modeling the data predicts Nmax, which theoretically corresponds to the point at which all the available substrate has been assimilated by the microorganisms P-17 and NOX. A representative growth curve and its corresponding Monod model are shown in Fig. 2. Even without modeling of the data, the frequent measurement intervals provide a better estimate of Nmax than once-daily measurement. The compiled data points from the measurement intervals combine to form growth curves that include points leading up to and descending from the Nmax for the sample.
FIG. 2.
AOC-NOX bioluminescence measurements for 300 μg acetate carbon per liter; the modeled line was determined using the single-substrate model. RLU, relative light units.
Using the data collected during the reclaimed-water survey, we can compare the Monod model and the peak luminescence measurement (corresponding to the Nmax) for predicting AOC concentrations. The comparison was conducted by calculating the difference between the model AOC value and the Nmax-based AOC value, dividing by the model AOC value, and reporting the result as a percentage. The differences for 146 individual samples averaged 6%. The median difference was 3% (n = 146; r = 0.990; P < 0.001). Either method therefore could be used to generate the AOC value, but the model approach not only permits the estimation of the AOC level (based on the Nmax) but determines the rate of substrate utilization, which provides additional information regarding the biodegradability of the nutrients in the water sample. This information generated by the kinetic model can then be used for comparison of the AOC qualities between waters. Short doubling times relative to those in the acetate carbon control indicate a rich carbon source and the potential for rapid bacterial growth. Longer doubling times indicate a more complex source of nutrients and a lower cell yield. The bioluminescence-based AOC method therefore provides a more complete bacteriological growth profile because not only the maximum growth level (Nmax) but also the maximum rate of substrate utilization (corresponding to the μmax) is provided.
Validation for reclaimed-water matrices.
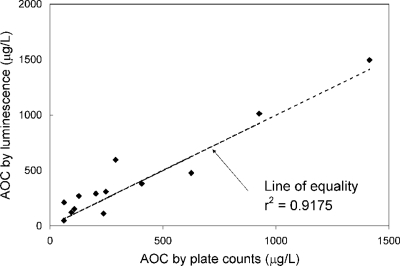
Parallel analyses using both the luminescence-based and plate count methods were performed to confirm the applicability of the luminescence-based method to reclaimed-water matrices. Comparison of the two methods produced r2 values of 0.83 for P-17, 0.96 for NOX, and 0.92 for the combined P-17-NOX assay (Fig. 3). Moreover, the slope of the data was 0.98, indicating that the two methods resulted in nearly the same AOC concentrations (Fig. 3). One source of error in the conventional AOC test is the possibility that the analyst may miss the peak in the growth curve by conducting only daily measurements. This would result in an underestimation of the true AOC level. In addition, because the conventional AOC test can base the Nmax value on a single daily plate count, the opportunity to capture various stages of growth is not feasible because of the labor involved, and there is considerable delay in obtaining the results because of the culture period.
FIG. 3.
Comparison of AOC methods for reclaimed waters. The line of equality represents equivalent results from the two methods.
Modeling reclaimed-water matrices.
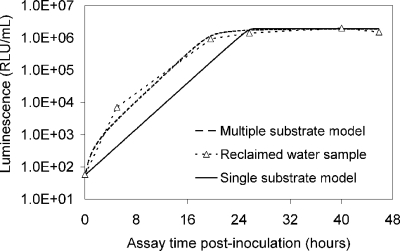
The luminescence-based measurements of AOC in reclaimed water (Fig. 4) did not have the same pattern as those in acetate test solutions (Fig. 2). Bacterial growth in the reclaimed-water samples was faster, and the corresponding luminescence peaked sooner. Reclaimed-water maximum luminescence generally occurred within 3 days—faster than that represented in the standard curves for acetate (a two-carbon source compound). The multiple-substrate, single-substrate, and reclaimed-water-sample plots can be found in Fig. 5. A multiple-substrate model provided a better fit for the observed data from actual reclaimed-water samples and more precisely matched both the maximum yield (Nmax) and the growth kinetics than the single-substrate model. The multiple-substrate model was designed to combine multiple-substrate kinetics and concentrations for better estimation of the growth rate indicated by the luminescence measurements. The multiple-substrate model combined kinetics from various substrate calculations, i.e., the total luminescence (Xtotal) in relative light units, which was plotted over time. The luminescence yield was calculated for each substrate by using equation 2. The luminescence yield increased as the AOC bacteria consumed the substrate. The change in the substrate concentration (ΔS) was calculated according to Monod growth kinetics by using equation 3. These equations were determined without incorporating bacterial decay kinetics over the time intervals in which peak growth was reached, in increments of 0.1 h. The summation of various substrate yields over time, expressed as luminescence, was calculated by using equation 4.
 |
(2) |
 |
(3) |
 |
(4) |
where X is the luminescence (in relative light units), with Xn, Xo, Xa, and Xb representing luminescence at time n, initial luminescence, luminescence associated with substrate a, and luminescence associated with substrate b, respectively, and ΔX being the change in luminescence; S is the substrate concentration (in micrograms per liter), with Sn, So, and Sa representing the substrate concentration at time n, the initial substrate concentration, and the substrate concentration corresponding to Xa; and Y is the factor for conversion from the standard curve (in relative light units per microgram). The AOC concentration was determined by solving the multiple-substrate equation for the sample growth curve. Reclaimed wastewater likely comprises a mixture of both simple, low-molecular-weight carbon compounds and energy-intensive carbohydrates and amino acids that results in rapid bacterial growth (12). The multiple-substrate model provides information on substrate utilization, for example, how easily biodegradable (or persistent) the AOC substrates in the sample are.
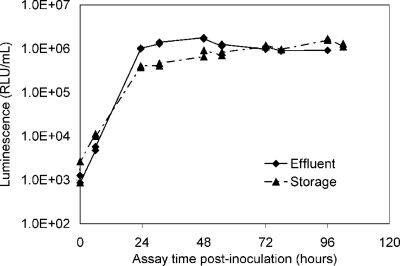
FIG. 4.
Example of luminescence-based growth curve data for reclaimed-water AOC. The maximum luminescence (corresponding to the Nmax) of the effluent sample occurred at 48 h, and that of the storage sample occurred at 96 h. RLU, relative light units.
FIG. 5.
The multiple-substrate model provides a better fit to the results for a field sample of reclaimed water than the single-substrate model. RLU, relative light units.
Rates of substrate utilization.
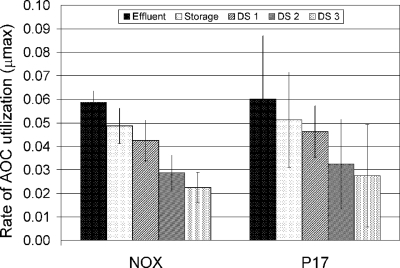
Survey data were collected from samples taken over 4 days from five distribution locations and revealed interesting trends in the AOC levels (Fig. 4 and 6; Table 1). For instance, more labile carbon was present in the effluent (at the plant in Massachusetts) than in the storage tank (located farther away from plant). The AOC test bacteria exhibited peak growth within 2 days in the effluent sample, whereas the peak growth occurred within 4 days in the storage tank sample (Fig. 4). Not only did the AOC test bacteria take longer to assimilate the less readily biodegradable nutrients in the storage tank sample, but the nutrient concentration was lower as well.
FIG. 6.
Mean rates of AOC utilization (corresponding to the μmax [1/time]) in the Massachusetts reclaimed-water distribution system. Error bars represent standard deviations.
TABLE 1.
Representative AOC results for three reclaimed-water systems
| System location | Mean concn of AOC (μg acetate carbon/liter) ± SD in: |
||||
|---|---|---|---|---|---|
| Effluent samples | Storage samples | DS1 samples | DS2 samples | DS3 samples | |
| Massachusetts | 1,610 ± 270 | 730 ± 120 | 280 ± 10 | 170 ± 50 | 80 ± 20 |
| Florida | 1,410 ± 600 | 1,570 ± 290 | 1,600 ± 300 | 2,130 ± 480 | 2,085 ± 920 |
| California | NDa | 2,140 ± 510 | 1,230 ± 670 | 1,440 ± 770 | 1,100 ± 770 |
ND, not determined because of an analytical error in sample processing.
For a system that had an enclosed storage tank, the greatest μmax found was that in the inlet to the distribution system (Fig. 6). Carbon assimilation by the test bacteria occurred more slowly in waters further downstream within the distribution system. NOX and P-17 μmax values indicate this phenomenon, where the rate of assimilation gradually decreases throughout the reclaimed-water distribution system (Fig. 6). The AOC concentration was highest in the effluent samples (1,610 ± 270 μg/liter) and was considerably diminished in the water as it moved into the distribution system (Table 1). At the furthest point measured (DS3), the AOC level was 80 ± 20 μg/liter.
Interesting AOC data trends for the other reclaimed-water facilities were revealed. AOC levels in the Florida system increased throughout the distribution network (Table 1). This increase was attributed to the deposition and decay of algal cells from the open finished-water reservoir. Open reservoir storage also influenced AOC levels in the California system, where elevated AOC levels in the storage reservoir supply provided substantial loading of biodegradable organic matter into the distribution system.
Levels of biodegradable organic matter in reclaimed water average four to five times higher than levels typically seen in drinking water supplies (2). Of the 146 samples tested in the reclaimed-water survey, 51 samples had levels that were ≤150 μg/liter, ranging from 31 to 150 μg/liter (median, 75 μg/liter). These 51 samples were exclusively from the effluent and distribution systems fed by membrane bioreactors. Previous studies revealed that AOC levels in membrane bioreactor wastewater effluents ranged from 500 to 900 μg/liter (6). In this study, average AOC levels ranged from 150 to 1,400 μg/liter (n = 146). In general, lower AOC concentrations were found in the Massachusetts distribution system, which was supplied by membrane bioreactor treatments, whereas higher AOC concentrations were detected in the conventional activated-sludge treatment plants (those in California and Florida). Companion studies (P. K. Jjemba, L. A. Weinrich, W. Cheng, E. Giraldo, and M. W. LeChevallier, submitted for publication; L. A. Weinrich, P. K. Jjemba, E. Giraldo, and M. W. LeChevallier, submitted for publication) have demonstrated that elevated levels of AOC in reclaimed water were primarily responsible for bacterial growth and could contribute to the occurrence of opportunistic pathogens such as Legionella and Mycobacterium.
Conclusion.
The bioluminescence method incorporated the sensitivity of bioluminescence detection along with the standardization of the conventional AOC assay. The luminescence-based AOC test generated results faster than previous methods. The method provides important information regarding the kinetics of substrate utilization, i.e., the biodegradability of the nutrients (corresponding to the μmax) and the nutrient concentration (corresponding to the Nmax). The method produced consistent results for reclaimed-water systems and was useful for understanding problems related to microbial growth and changes in water quality.
Acknowledgments
We acknowledge with gratitude the four utilities for their participation and cooperation. In addition, thanks to Patrick Jjemba and Wei Cheng for their assistance in the reclaimed-water project.
This study was funded by the WateReuse Foundation, Alexandria, VA, and the utility subsidiaries of American Water, Voorhees, NJ.
Footnotes
Published ahead of print on 9 October 2009.
REFERENCES
- 1.Eaton, A. D., L. S. Clesceri, E. W. Rice, and A. E. Greenberg (ed.). 2005. Standard methods for the examination of water and wastewater, 21st ed. American Public Health Association, Washington, DC.
- 2.Geldreich, E. E., and M. W. LeChevallier. 1999. Microbial water quality in distribution systems, p. 18.1-18.49. In R. D. Letterman (ed.), Water quality and treatment, 5th ed. McGraw-Hill, New York, NY.
- 3.Haddix, P. L., N. J. Shaw, and M. W. LeChevallier. 2003. Development of a simple assay. American Water, Voorhees, NJ.
- 4.Haddix, P. L., N. J. Shaw, and M. W. LeChevallier. 2004. Characterization of bioluminescent derivatives of assimilable organic carbon test bacteria. Appl. Environ. Microbiol. 70:850-854. [DOI] [PMC free article] [PubMed] [Google Scholar]
- 5.Kaplan, L. A., and T. L. Bott. 1989. Nutrients for bacterial growth in drinking water: bioassay evaluation. EPA/600/2-89/030. U.S. Environmental Protection Agency, Cincinnati, OH.
- 6.Karim, M., and M. W. LeChevallier. 2005. Microbiological quality of reuse water. Internal report. Research and Environmental Excellence, American Water, Voorhees, NJ.
- 7.LeChevallier, M. W. 1990. Coliform regrowth in drinking water: a review. J. Am. Water Works Assoc. 82:74-86. [Google Scholar]
- 8.LeChevallier, M. W., W. C. Becker, P. Schorr, and R. G. Lee. 1991. Evaluating the performance of biologically active rapid filters. J. Am. Water Works Assoc. 84:136-146. [Google Scholar]
- 9.LeChevallier, M. W., C. D. Lowry, R. G. Lee, and D. L. Gibbon. 1993. Examining the relationship between iron corrosion and the disinfection of biofilm bacteria. J. Am. Water Works Assoc. 85:111-124. [Google Scholar]
- 10.LeChevallier, M. W., N. E. Shaw, L. A. Kaplan, and T. L. Bott. 1993. Development of a rapid assimilable organic carbon method for water. Appl. Environ. Microbiol. 59:1526-1531. [DOI] [PMC free article] [PubMed] [Google Scholar]
- 11.LeChevallier, M. W., N. J. Welch, and D. B. Smith. 1996. Full-scale studies of factors related to coliform regrowth in drinking water. Appl. Environ. Microbiol. 62:2201-2211. [DOI] [PMC free article] [PubMed] [Google Scholar]
- 12.National Research Council. 1998. Issues in potable reuse: the viability of augmenting drinking water supplies with reclaimed water. National Academy Press, Washington, DC. [PubMed]
- 13.van der Kooij, D. 1990. Assimilable organic carbon (AOC) in drinking water, p. 57-87. In G. A. McFeters (ed.), Drinking water microbiology. Springer-Verlag, New York, NY.
- 14.van der Kooij, D. 1992. Assimilable organic carbon as an indicator of bacterial regrowth. J. Am. Water Works Assoc. 84:57-65. [Google Scholar]
- 15.Volk, C. J., and M. W. LeChevallier. 2000. Assessing biodegradable organic matter. J. Am. Water Works Assoc. 92:64-76. [Google Scholar]


