

Abstract
To better understand the global effects of “natural” lesions in genes involved in the pyruvate metabolism in Mycobacterium bovis, null mutations were made in the Mycobacterium tuberculosis H37Rv ald and pykA genes to mimic the M. bovis situation. Like M. bovis, the M. tuberculosis ΔpykA mutant yielded dysgonic colonies on solid medium lacking pyruvate, whereas colony morphology was eugonic on pyruvate-containing medium. Global effects of the loss of the pykA gene, possibly underlying colony morphology, were investigated by using proteomics on cultures grown in the same conditions. The levels of Icd2 increased and those of Icl and PckA decreased in the ΔpykA knockout. Proteomics suggested that the synthesis of enzymes involved in fatty acid and lipid biosynthesis were decreased, whereas those involved in β-oxidation were increased in the M. tuberculosis ΔpykA mutant, as confirmed by direct assays for these activities. Thus, the loss of pykA from M. tuberculosis results in fatty acids being used principally for energy production, in contrast to the situation in the host when carbon from fatty acids is conserved through the glyoxylate cycle and gluconeogenesis; when an active pykA gene was introduced into M. bovis, the opposite effects occurred. Proteins involved in oxidative stress—AhpC, KatG, and SodA—showed increased synthesis in the ΔpykA mutant, and iron-regulated proteins were also affected. Ald levels were decreased in the ΔpykA knockout, explaining why an M. tuberculosis ΔpykA Δald double mutant showed little additional phenotypic effect. Overall, these data show that the loss of the pykA gene has powerful, global effects on proteins associated with central metabolism.
Comparison of the genome sequences of Mycobacterium bovis and Mycobacterium tuberculosis revealed >99.95% identity at the nucleotide level; however, these pathogens differ in terms of host tropism, phenotype, and virulence (16). Eleven regions of difference (RD) were observed in the M. bovis genome (2 to 12.7 kb) compared to M. tuberculosis, while one region deleted from M. tuberculosis was present in M. bovis (5, 16). In addition to the RDs, there are over 2,400 single nucleotide polymorphisms (SNPs) between M. tuberculosis and M. bovis (16). Some SNPs cosegregate with regions of deletions or other genetic markers (5); one such SNP is in the pykA gene, which cosegregates with the RD9 deletion. This SNP results in an inactive pyruvate kinase (PykA) being produced due to a Glu220Asp mutation (20). Glu220 is in the active site of the enzyme (21, 24), and its substitution results in complete loss of the enzyme activity in M. bovis (20). Thus, the pykA SNP explains one of the classic distinctions between M. bovis and M. tuberculosis, namely, the requirement for pyruvate. Neither glycerol, the preferred carbon source for isolation of tubercle bacilli, nor glucose support the growth of M. bovis when they are not supplemented with pyruvate (38), due to the inactive pyruvate kinase.
On the routinely used Middlebrook 7H11 agar, containing glycerol and oleate, M. bovis shows dysgonic colony morphology, whereas M. tuberculosis, in contrast, shows eugonic colony morphology with abundant growth. Complementation of M. bovis with the active pykA gene from M. tuberculosis restored the eugonic phenotype. Thus, loss of PykA activity commits M. bovis to using nonglycolytic substrates as carbon sources, such as lipids. This in itself is of biological significance since human M. tuberculosis switches to this kind of metabolism in experimentally infected animals or in macrophages (34, 35, 39). However, even with oleate (a lipid) as a sole carbon source which allows both species to grow, there was still a difference in colony morphology (20). This led us to consider that loss of the pykA gene had wider effects since PykA is not needed for energy production on oleate and has no role in gluconeogenesis (Fig. 1). Thus, we hypothesize that the loss of the pykA gene has global effects over and above the predicted effect of determining whether or not growth can take place on glycerol. To examine our hypothesis, we created a pykA mutant of M. tuberculosis to investigate the effect of pykA deletion by using isogenic strains. This builds upon our previous study in which we had complemented M. bovis with the (active) M. tuberculosis pykA gene (20). We also created a mutant in alanine dehydrogenase (H37Rv Δald) and a H37Rv Δald ΔpykA double mutant since M. bovis naturally lacks active ald and pykA genes (16). The global effects of these knockout mutations were then examined by their on growth on a range of carbon sources and on protein expression during growth on pyruvate, a gluconeogenic carbon source. A proteomic approach was chosen since it would reveal changes in all proteins, for example, regulatory proteins, enzymes, and stress proteins; key proteins, or effects of changes in their levels, could then be assayed for directly. These approaches revealed the major metabolic consequences resulting from pykA inactivation.
FIG. 1.

Pathways of carbon metabolism possible in strains with or without pyruvate kinase (PykA). Boxes denote substrates and/or products where arrows are used to denote pathways. Arrows to and from boxes are pathways; other arrows show reactions catalyzed by a single enzyme. Substrates are in text with serifs; pathways and enzymes in plain text. Colored arrows are used to denote glycolysis or gluconeogenesis in red, the tricarboxylic acid cycle in blue, and the glyoxylate cycle in magenta.
MATERIALS AND METHODS
Bacterial strains and growth conditions.
The mycobacterial strains used in the present study include M. tuberculosis H37Rv and M. bovis type 35 (VLA culture collection, spoligotype SB0134 [www.mbovis.org]; field strain 61/1307/01), as well as the pSM81 and pLK102 constructs made in a previous study (20). The medium used for genetic manipulation and mycobacterial stocks was Middlebrook 7H9 medium (Difco) containing 10% (vol/vol) albumin-dextrose-catalase (ADC; Difco) enrichment, 0.2% glycerol, and 0.05% Tween 80 for M. tuberculosis H37Rv; for M. bovis, glycerol was replaced with pyruvate. For colony morphology examination, Middlebrook 7H11 medium (Difco) containing 10% (vol/vol) oleic acid-ADC (OADC; Difco) enrichment with or without 0.5% glycerol was used. For biochemical and proteomic experiments, Sauton's medium was modified to allow all strains to grow at similar rates on a single, gluconeogenic carbon source. Based on growth kinetics reported in Results, this medium contains (per liter) 4 g of asparagine, 2 g of citric acid, 0.5 g of K2HPO4, 0.5 g of MgSO4·7H2O, 0.05 g of ferric ammonium citrate, 40 mM sodium pyruvate, and 0.025% tyloxapol, adjusted to pH 7.2.
After electroporation, the organisms were plated on Middlebrook 7H11 agar plates with either 25 μg of kanamycin/ml or 200 μg of hygromycin/ml, depending on the vector used. For cloning, Escherichia coli DH5α (Invitrogen) was used as a general purpose-cloning host and was grown in Luria-Bertani medium with kanamycin (25 μg/ml) or hygromycin (200 μg/ml) as appropriate.
Generation of the M. tuberculosis ΔpykA knockout mutant.
The regions upstream (left-flank region) and downstream (right flank) of the pykA coding region from M. tuberculosis H37Rv chromosomal DNA was amplified by using the primer pairs LF1-Xba and LF2-Xba (5′-ATA ATC TAG AGG TCG TGC CGG ACG GTA AAC-3′ and 5′-AAT ATC TAG AGG CCG ACG GCA GCT TCA CAG-3′) and RF1-XmaI and RF2-SpeI (5′-ATT TCC CGG GTT GAG CCA ACT CAG GAA ATG-3′ and 5′-ATT AAC TAG TGC CCG GGT CGG CAC ACC GGTC-3′), respectively. PCR was carried out by using Advantage-HF PCR kit (Clontech) according to the manufacturer's instructions and thermal cycling conditions of 95°C denaturation, followed by annealing and extension at 68°C for 30 cycles. The amplified upstream and downstream PCR products were cloned into the suicide vector pSMT100 to flank the hygromycin cassette, generating pSC2. Plasmid pSC2 was introduced into M. tuberculosis H37Rv by electroporation at 2.5 kV, 25 μF, and 2,000 Ω (Bio-Rad Gene Pulser). The recombinant knockouts were selected in hygromycin plates.
Generation of the double-knockout M. tuberculosis Δald ΔpykA mutant.
First, M. tuberculosis Δald was generated by a strategy similar to that used for the pykA knockout using left-flank and right-flank primers (left-flank primers, AAC TGC AGC CCA GGT TGG CGC TTA CCA C-3′ and 5′-AAC TGC AGC CGG TAC CAA TGC CGC ACA C-3′; right-flank primers, 5′-ATT TCC CGG GTT TCG TTG CGA CCG ACA AAC AC-3′ and 5′-AAT TAC TAG TCA AGA TCT GCC CGT GTC GCAGG-3′). The plasmid pSN2 was designed in such a way so as to delete a 300-bp internal region from ald, with the upstream and downstream regions flanking the hygromycin cassette of suicide vector pSMT100.
The double mutant was generated by transformation of the M. tuberculosis Δald strain with the plasmid pCM2. The latter was generated from pSC2 (generated for the pykA mutant) by replacing the hygromycin cassette with the kanamycin cassette from the plasmid vector pSM96.
Preparation of cell extracts and enzyme assay.
Cells were harvested from modified Sauton's medium at mid-logarithmic stage and washed twice with 20 mM phosphate buffer (pH 6.8) plus 0.05% Tween 80. Except when they were used for assaying fatty acid synthase activity, bacteria were resuspended in 20 mM phosphate buffer (pH 6.8) plus 5 mM MgCl2. The chilled cells were disrupted by using the FastPrep system (Hybaid) for 20 s at a speed of 6.5 m s−1 twice, and the supernatant was harvested by centrifugation at 14,000 × g for 5 min at 4°C. This supernatant is referred to as the cell extract. The protein concentration was measured by using the Bradford method (Bio-Rad) with bovine serum albumin as a standard. For the assays, controls were reactions without the addition of substrate. Each sample was analyzed at least twice, and two or three sets of different cultures were utilized to analyze the activity of each enzyme.
Pyruvate kinase activity was assayed by using a coupled enzyme assay in which pyruvate was generated, and the rate of conversion of NADH+ to NAD+ by lactate dehydrogenase was monitored spectrophotometrically at 340 nm at 37°C. The final reaction mixture in 1 ml consisted of 80 mM Tris-HCl (pH 7.4), 2.5 mM MgSO4, 10 mM KCl, 0.2 mM NADH, 4.7 mM ADP, and 1.2 U of lactate dehydrogenase/ml (42). Cell extract (0.10 to 0.20 mg of protein) was used as the enzyme source, and the reactions were initiated by adding phosphoenolpyruvate to a final concentration of 0.54 mM. Phosphoenolpyruvate was omitted from the controls.
l-Alanine dehydrogenase activity was measured by conversion of NADH+ to NAD+ accompanying the production of alanine from pyruvate. The final reaction mixture (1 ml) consisted of 200 mM ammonium sulfate, 0.18 mM NADH, and 50 mM phosphate buffer (pH 6.8), and the reactions were initiated with 10 mM sodium pyruvate, as a substrate. Cell extract (0.10 to 0.16 mg of protein) was used as the source of enzyme. The conversion of NADH+ was monitored spectrophotometrically at 340 nm at 37°C (19). Pyruvate was omitted from the controls.
Fatty acid synthase was assayed in extracts prepared separately in a high-ionic-strength buffer. The buffer and assay were as described previously (44), except that the bacteria were disrupted by using the FastPrep system described above.
Colony morphology.
Cultures were grown in MADC-Tw for 8 days, washed, and resuspended and serially diluted in phosphate-buffered saline-0.05% Tween 80. Samples (25 μl) of each 10-fold dilution were spotted in five or six spots adjacently onto Middlebrook 7H11 agar plates (with the appropriate antibiotic) using 0.5% glycerol or 40 mM pyruvate as the carbon source, along with OADC. Control plates were made without any carbon source except OADC and incubated for 4 weeks at 37°C. Colonies were scored blindly for rugose and eugonic appearance, and the scores were used in writing the descriptions of colonies in the Results.
Proteome analysis: sample preparation.
Proteome analysis was done with the M. tuberculosis H37Rv wild type, the M. tuberculosis ΔpykA knockout, the M. bovis type 35 wild type, and the M. bovis/pLK102 knockin, generated previously (20). The cultures were harvested at mid-log phase, washed, resuspended in 3 ml of PBS, and sonicated for 10 min with 9-s pulses using a Sonics VX 500. To the cell supernatant, obtained after removal of cell debris by centrifugation at 1,400 rpm for 10 min, an equal amount of denaturing buffer 1 (50 mM Tris [pH 7.8], 10% glycerol, 10 mM dithiothreitol, and 0.2% sodium dodecyl sulfate) was added, and the samples were boiled at 95°C for 5 min. The samples, concentrated to 1 ml using 5-kDa molecular-mass cutoff Viva spin concentrators, were mixed with 2 ml of freshly prepared lysis buffer (final concentration: urea, 5 M; thiourea, 2 M; CHAPS {3-[(3-cholamidopropyl)-dimethylammonio]-1-propanesulfonate}, 2%; SB3-10, 2%; Pharmalytes 3-10, 0.5%; dithiothreitol, 100 mM; Tris base, 0.01 M) and incubated for an hour at 37°C. The samples were again concentrated to 0.5 ml and washed by dialyzing with 2.5 mM ammonium bicarbonate solution. Protein estimation was done by the Bradford method (Bio-Rad) with bovine serum albumin as a standard, and the samples were stored as aliquots at −80°C. Three biological replicates were done in each case.
Two-dimensional high-pressure liquid chromatography (2D-HPLC) protein analysis.
The proteins were first subjected to digestion with trypsin. Tryptic peptides were separated on a Hewlett-Packard 1050 system by using a Biobasic SCX HPLC column (100 by 2.1 mm, 5 μm), with a flow rate of 0.25 ml/min with mobile phases of 2.5 mM ammonium acetate (pH 4.5)-acetonitrile (75:25) (phase A) and 250 mM ammonium acetate (pH 4.5)-acetonitrile (75:25) (phase B). HPLC effluent was recorded at 280 nm, and 15 fractions of 1-min duration were collected at 8 and 22 min. The SCX fractions were dried by using a SpeedVac at 50°C. 2D reversed-phase chromatography, followed by mass analysis, was done as follows. The fractions were dissolved in 0.1% (vol/vol) formic acid and analyzed by capillary HPLC-mass spectrometry using a Famos autosampler, a surveyor HPLC pump equipped with an Accurate flow splitter (100 to 1), and an LCQ ion-trap mass spectrometer (ThermoFinnigan, Hemel Hamstead, United Kingdom). SCX fractions (5 μl) were chromatographed on a Picofrit column, and peptides were eluted at an estimated flow rate of 400 nl/min with a linear binary gradient of 0.1% formic acid (phase A) and acetonitrile (phase B). The Picofrit column (70 mm) was mounted in a steel filter (0.5-μm pore size) assembly, to which the electrospray ionization potential (2.5 kV) was applied. The Picofrit tip was positioned slightly off axis within 3 mm of the LCQ mass spectrometer heated capillary inlet using a Protana nanospray source. Mass data for each SCX fraction were collected over a mass range of m/z 300 to 2,000 using a Big Three acquisition method with data-dependent product ion scanning of first, second, and third most abundant ions above a threshold trigger of 3 × 10⁵ cps. The mass isolation window and collision energy were set to 4 atomic mass units and 35%, respectively. The mass spectrometer was tuned to the doubly charged ion (m/z 820.5) derived from synthetic peptide FNPGELLPEAAGPTQV.
The SEQUEST algorithm embedded within the Bioworks software package was used for the identification of proteins from tryptic peptide mass spectra. Proteins were identified by comparison of tryptic peptide product ion mass spectra against those generated from both M. tuberculosis and M. bovis database derived from Tuberculist and Bovilist. The multi-consensus report function was used to assign tryptic peptides to individual proteins and compile rank listings of the proteomes. Identified proteins were ranked in ascending order according to consensus scores, and false positives were minimized by filtration against four of the five following criteria: Xcorr, >2.0; DeltCn, >0.2; Sp, >400; rsp, <5; and ions, >30%. Compilations of identified proteins from each triplicate were exported to Microsoft Access for interrogation and comparison using the query function. The standards included the synthetic peptides MRFA (50 ng/ml; [M+H]+, m/z 524.2); APYELNITSATYQSAI (10 g/ml; [M+H]2+, m/z 871.5); FNPGELLPEAAGPTQV (10 g/ml; [M+H]2+, m/z 820.5) and AIQGNVVSTSIHSLLDEG (10 g/ml; [M+H]2+, m/z 827.9) (8).
Protein abundance was calculated using the spectrum count, which is the number of peptides detected for each protein (15, 22), providing a measure of relative abundance that is not an absolute measurement (23). Statistical analysis for each protein between different culture conditions was performed on the spectrum count data by using the Student t test, which has been shown to be the most appropriate method (47).
Abbreviation of protein names.
The abbreviated protein names were all taken from the Tuberculist website (http://genolist.pasteur.fr/TubercuList/).
Pulse-labeling with acetate, followed by analysis of labeled lipids.
Cultures, during log phase, were labeled with [1-14C]acetate. The density of bacteria, 12 to 18 mg (dry weight)/100 ml, was chosen to maximize the yield of log-phase bacteria. All labeling was done for 2 h with 50 μCi of sodium salt (50 to 60 Ci mol−1) per culture (100 ml), adding the labeled compound directly to cultures, followed by continued incubation in growth medium and conditions. Radioisotopically labeled acetate (ARC101A) was obtained from American Radiolabeled Chemicals, Inc., St. Louis, MO. A 10-ml sample was analyzed at the end of the 2-h pulse phase, and the remainder of the suspension was washed again in medium and resuspended in 90 ml of medium free of labeled compounds for a chase phase. After a 20-h chase phase, two 45-ml samples were taken.
The labeled bacteria from the samples were harvested by centrifugation and washed once in MilliQ water. Noncovalently bound lipids were extracted successively with hexane and then into the organic phase from the chloroform-methanol-water mixtures described previously (3, 11), and the wall-bound mycolic acids released from the remaining residue with 15% (wt/vol) tetrabutylammonium hydroxide (TBAH) at 100°C for 18 h. The TBAH salts thus produced were then methylated (41). The amount of radioactivity in each fraction thus isolated—“nonpolar,” “polar”(essentially phospholipids and glycosylated phospholipids), and mycolic acids—was determined by sampling 10% of the volume and scintillation counting in Scintran NA (VWR). Noncovalently bound lipids were analyzed by 2D thin-layer chromatography (TLC) (3, 11). 10,000 to 40,000 dpm were applied as a spot to 6.7-by-6.7-cm Silica Gel 60 F254 TLC plates (Merck 1.05554). The data obtained for triacylglycerols, phthiocerol dimycocerosates (PDIMs), and fatty acids are shown here. For the first two, apolar, lipids, TLC plates were developed thrice in hexane-ethyl acetate (98:2 [vol/vol]) in the first direction and hexane-acetone (98:2 [vol/vol]) in the second direction perpendicular to the first. For fatty acids, TLC plates were developed chloroform-methanol (96:4 [vol/vol]) in the first direction and toluene-acetone (4:1 [vol/vol]) in the second direction perpendicular to the first. Details of the development systems for lipids reported as data not shown here are given elsewhere (3, 11, 41). The amount of radioactivity in each spot on TLC plates was quantified by using a phosphorimager (Bio-Rad) as percentages in each spot and then calculated as the dpm/mg (dry weight) by referring to dpm/mg (dry weight) values for the appropriate lipid fraction.
A step-by-step protocol for the labeling and global lipid analysis performed in the present study has been published (41).
RESULTS
Growth kinetics: slower growth rate of mutants compared to the wild type.
Media that supported the growth of both pykA wild-type and pykA mutant strains used throughout the present study were such that the omission of a single carbon source resulted in failure to grow. All of the strains grew in Sauton's medium, with pyruvate replacing glycerol as the sole carbon source. Growth rates (D) using either pyruvate or Tween 80 (a source of oleic acid in liquid media) were between 0.028 and 0.034/h for M. tuberculosis and its ΔpykA knockout and between 0.016 and 0.022/h for M. bovis type 35/pSM81 (vector negative control) or pLK102 (the pykA knockin); the type 35 wild type grew at 0.023 to 0.026/h. When glycerol was used as the sole carbon source, a rate of growth was obtained for M. tuberculosis similar to that observed with pyruvate or Tween 80, but the M. tuberculosis ΔpykA mutant failed to grow despite several attempts at subculture and monitoring cultures for signs of growth for up to 3 months. In a further attempt to grow the M. tuberculosis ΔpykA strain with glycerol as the sole carbon source, Proskauer and Beck medium was also used, but no growth was obtained, whereas the parent strain grew copiously at 0.030 to 0.038/h.
Colony morphology was dependent on the carbon source in the medium of growth.
The ΔpykA knockout in M. tuberculosis resulted in a colony morphology similar to that of M. bovis (Fig. 2). Complementation of the ΔpykA mutation using pLK102 resulted in colonies resembling the parent strain. The differences were most marked on 7H11-OADC with glycerol when M. tuberculosis and M. tuberculosis ΔpykA/pLK102 colonies were rugose and eugonic; M. bovis colonies were dysgonic (i.e., flat and almost smooth), whereas the ΔpykA mutation in M. tuberculosis resulted in colonies similar to those of M. bovis (Fig. 2). The same gradation of phenotypes, though less marked, was seen when glycerol was omitted (Fig. 2). When pyruvate instead of glycerol was added to the 7H11-OADC, the same gradation of phenotypes was still seen, but M. tuberculosis ΔpykA and M. bovis colonies were rugose, with less abundant growth than that seen with M. tuberculosis. Interestingly, the addition of pyruvate did not completely rescue the colony phenotype in the ΔpykA mutant (Fig. 2). We next examined Δald mutants. When 7H11-OADC was supplemented with pyruvate or pyruvate-alanine, we could not distinguish any reliable differences in colony morphotype between the M. tuberculosis ΔpykA mutant and a double ΔpykA Δald mutant (Fig. 3). The single Δald mutant appeared to form more sparse colonies, particularly when alanine was included in the medium (Fig. 3). On OADC alone, the Δald mutant and double Δald ΔpykA mutant grew more sparsely than the ΔpykA mutant (Fig. 3) and resembled M. bovis (Fig. 2) more closely than the ΔpykA mutant. Although some of these differences were subtle, the effect of knocking out pykA on growth on glycerol was obvious. We therefore undertook to elucidate the effect of mutation of pykA and ald genes by using biochemical methods that analyzed the overall phenotype.
FIG. 2.
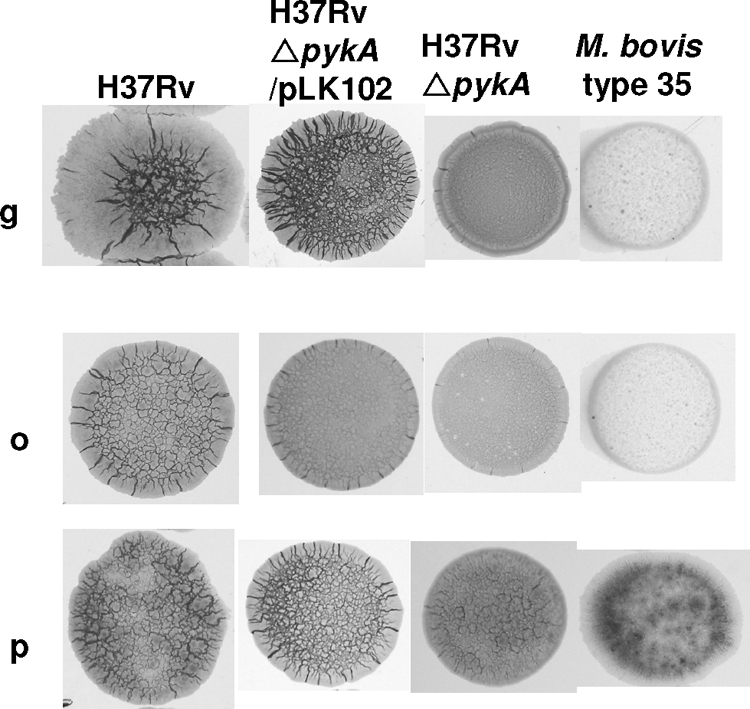
Comparison of the colony morphology of the M. tuberculosis wild type, the M. tuberculosis ΔpykA knockout mutant, the knockout complemented with pLK102 containing the pykA gene, and M. bovis. The strains are arranged from left to right, each grown on Middlebrook 7H11 plates with glycerol plus OADC (g), OADC only (o), and pyruvate plus OADC (p).
FIG. 3.
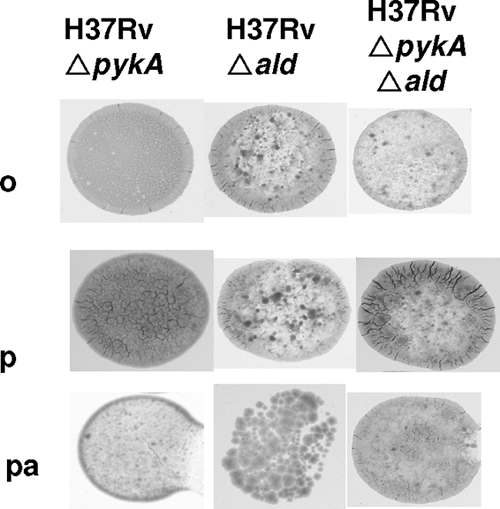
Comparison of the colony morphology of the M. tuberculosis wild type with the M. tuberculosis Δald mutant, the M. tuberculosis ΔpykA mutant, and the M. tuberculosis ΔpykA Δald (double-knockout) mutant. The strains are arranged from left to right, each grown on Middlebrook 7H11 plates with OADC only (o), pyruvate plus OADC (p), and pyruvate plus alanine plus OADC (pa). The same images of colonies of the pykA mutant on rows o and p are shown in both figures so that comparisons can be made within each figure.
Carbon and lipid metabolism: proteomics data analysis.
The global protein profiles of wild-type and recombinant bacilli were assessed by using 2D-HPLC. The effect of introducing an active pykA gene into in M. bovis type 35 using a high expression vector (20) was clearly reflected in high levels of pyruvate kinase in M. bovis/pLK102 (see Table S1 in the supplemental material). Previously, both transcript and enzyme activity were shown to be greatly elevated in M. bovis/pLK102 over native levels found in M. tuberculosis (20). Several other enzymes in central carbon and lipid metabolism that showed increased protein levels in M. bovis/pLK 102 included isocitrate lyase (Icl), phosphoenolpyruvate carboxylase (PckA), and fatty acid synthase (Fas) (Table 1). In contrast, isocitrate dehydrogenase (Icd2), a tricarboxylic acid (TCA) cycle enzyme, showed decreased expression (Table 1). Aconitase (Acn), an Fe-containing enzyme, and lipoamide dehydrogenase (LpdC) showed increased levels up 60 to 70% (Table 1), observations that were both highly reproducible (see Table S1 in the supplemental material [P ≈ 0.02 to 0.03]). Four of the proteins involved in phthiocerol-based lipid biosynthesis—mycocerosate synthase (Mas) (Table 1), PpsE, PpsC, and FadD28—showed increased levels in M. bovis/pLK102 (see Table S1 in the supplemental material), and PpsA was only detected in M. bovis/pLK102 (see Table S2 in the supplemental material).
TABLE 1.
Profiles of selected proteins of central metabolism and proteins involved in oxidative stress response in the pykA constructs of M. tuberculosis (H37Rv) and M. bovis (type 35) compared to their parent strains
| Protein | Enzyme name (Rv no.)a | % Change |
|
|---|---|---|---|
| M. tuberculosis ΔpykA mutant vs M. tuberculosis wild typeb | M. bovis/pLK102 vs M. bovis/pSM81c | ||
| Icl | Isocitrate lyase (Rv0467) | -87 | 261 |
| Icd2 | Isocitrate dehydrogenase (Rv0066c) | 86 | -33 |
| PckA | Phosphoenolpyruvate carboxykinase (Rv0211) | -18 | 258 |
| Acn | Aconitase (Rv1475c) | 2 | 68 |
| Fas | Fatty acid synthase (Rv2524c) | -34 | 136 |
| LpdC | Dihydrolipoamide dehydrogenase (Rv0462) | -8 | 60 |
| Mas | Mycocerosate synthase (Rv2940c) | -75 | 58 |
| Ald | Alanine dehydrogenase (Rv2780) | -50 | NA |
| AhpC | Alkyl hydroperoxidase C (Rv2428) | 131 | -73 |
| SodA | Superoxide dismutase [Fe] (Rv3846) | 47 | -57 |
| KatG | Catalase (Rv1908c) | 20 | -18 |
Proteins are represented by Rv numbers of M. tuberculosis.
Complete data are in Table S3 in the supplemental material.
Complete data are in Table S1 in the supplemental material. NA, not applicable (Ald does not occur in M. bovis).
The effect of knocking out pykA in M. tuberculosis was, in general, the opposite of introducing an active pykA gene in M. bovis (see Table S3 in the supplemental material). Thus, Icl showed the greatest relative decrease in expression of all of the proteins in the M. tuberculosis ΔpykA mutant, whereas Icd2 showed increased protein levels (Table 1). PckA and Fas (Table 1) also showed decreased levels. However, LpdC and Acn were virtually unchanged (Table 1). The variance in the readout of relative abundance of proteins (by spectrum analysis [see Materials and Methods]) was highest for the data set of the triplicate cultures of the parent strain of M. tuberculosis; thus, these effects in the knockout that oppose those seen when pykA was introduced into M. bovis are compelling.
Similarly, for proteins involved in phthiocerol-based lipid biosynthesis, the effects were the opposite in the pykA knockout to M. bovis/pLK102. Thus, Mas showed the third greatest relative decrease (Table 1; for full list of proteins, see Table S3 in the supplemental material), and PpsE was only detected in the H37Rv wild type and not in the pykA knockout (see Table S4 in the supplemental material).
Increased expression of the proteins of the β-oxidation pathway in the pykA mutant.
Although Fas showed decreased protein level on knocking out pykA, all but two of the expressed proteins associated with β-oxidation showed increased levels in M. tuberculosis ΔpykA with four FadEs, three FadAs, five EchAs, and FabB1 increased and a negligible change only for EchA3 and FadB2 (see Table S5 in the supplemental material). However, although Fas levels increased strongly upon complementation with pykA in M. bovis/pLK102, similar numbers of proteins associated with β-oxidation were increased or decreased (see Table S5 in the supplemental material). A major difficulty in interpreting any data in M. tuberculosis is the large number of paralogues, up to 36, of genes annotated as associated with β-oxidation, whereas those which actually function in a β-oxidation complex are yet to be discovered. Therefore, to obtain an overall view of the effect of disruption of the pykA gene on β-oxidation, enzyme activity was determined directly.
β-Oxidation: direct determination of fatty acid degradation.
The proteomics data suggested a shift to fatty acid degradation on the loss of the pykA gene. When this activity was determined directly by incubating [1-14C]palmitate with live bacteria and measuring the evolution of 14CO2, the differences between isogenic pairs of wild-type pykA and pykA mutant strains were statistically significant. The activities (all dpm evolved/mg [dry weight] of bacteria/h, mean ± the standard error of the mean [SEM], three determinations) were as follows: for the M. tuberculosis parent strain, 3,266 ± 153; and the M. tuberculosis ΔpykA mutant, 10,032 ± 1,218 (P = 0.017); for M. bovis/pSM81, 23,384 ± 2,928; and for M. bovis/pLK102, 11,218 ± 1,203 (P = 0.050).
Direct determination of fatty acid synthase.
Although the opposite effect of knocking out pykA in M. tuberculosis to complementing pykA in M. bovis on Fas appeared convincing, the differences in Fas expression did not reach statistical significance, with P > 0.05 (see Table S8 in the supplemental material). Therefore, it was decided to assay directly for Fas enzyme activity. The values (in pmol of fatty acid formed/mg of protein/min, mean ± the SEM) were 607 ± 17 for the M. tuberculosis parent strain and 139 ± 63 for the M. tuberculosis ΔpykA mutant (P = 0.001). The corresponding values (in pmol of fatty acid formed/mg of protein/min) were 399 ± 46 for M. bovis/pSM81 and 654 ± 143 for M. bovis/pLK102 (P = 0.045).
Metabolic flux balance analysis.
To confirm and test at a network level key growth and proteomic data, flux balance analysis was conducted in silico by using the publically available genome-scale model (GSMN) for M. tuberculosis (4; http://sysbio.sbs.surrey.ac.uk/tb), with the modification that flux via PckA was only permitted in one direction from oxaloacetate to phosphoenolpyruvate since the enzymatic data indicate that this enzyme in mycobacteria acts only in the gluconeogenic direction (25). The modification to the GSMN described here and the following flux analysis (J. J. McFadden, unpublished data) required privileged access.
We sought to support the data showing that fatty acids are being used principally as an energy source in the absence of an active pykA gene. This would require the oxidation of acetyl coenzyme A generated by β-oxidation through the TCA cycle (Fig. 1). Our proteomic data showed that at the point of divergence (isocitrate; Fig. 1) between the TCA cycle and the glyoxylate cycle, Icd2 showed an increase and Icl showed a decrease in the ΔpykA strains relative to their isogenic pykA wild-type strains. This suggested that the TCA cycle is upregulated and the glyoxylate cycle is downregulated upon loss of the pykA gene, a finding consistent with our view that fatty acids are being used for energy production when there is no active PykA. Flux balance analysis concurred with this scenario, with in silico increased flux via the TCA cycle at the expense of the glyoxylate cycle in the pykA mutant (Table 2).
TABLE 2.
Flux balance analysis: relative flux from in silico simulations
| Reaction | Enzyme | Simulation in silico |
|
|---|---|---|---|
| pykA wild type | ΔpykA mutant | ||
| Citrate to isocitrate | Aconitase (Acn) | 0.205 | 0.035 |
| Isocitrate to succinate + glyoxylate | Isocitrate lyase (Icl)a | 0.170 | 0 |
| Isocitrate to α-ketoglutarate | Isocitrate dehydrogenase (Icd2) | 0.035 | 0.035 |
Glyoxylate cycle pathway.
Alterations to lipid profiles.
Global data on proteins involved in lipid metabolism associated anabolism (e.g., Fas and Pps proteins) with the presence of PykA. To further explore this association, we examined the lipid profiles of the wild-type and recombinant strains. Upon labeling with [1-14C]acetate, more label was incorporated into triacylglycerols, PDIMs, and free fatty acids in M. tuberculosis H37Rv than in its pykA mutant (Table 3). The effect of knocking out pykA in H37Rv was much clearer than that shown in Table 3 when glycerol was included in the culture medium as well as pyruvate. Then, 37% of label in nonpolar lipids from acetate was incorporated into triacylglycerols in the parent strain, in contrast to 7.5% in the ΔpykA mutant grown with glycerol. The opposite effects on triacylglycerols and fatty acids occurred when pykA was introduced into M. bovis, although almost no PDIM was made by the M. bovis/pLK102 construct (Table 3). No differences were evident in the multiacylated trehaloses, sulfolipids, phospholipids, or mycolic acids (data not shown). We had to limit our interpretation of the data on lipids to those listed above because introduction of pLK102 and the vector control, pSM81, disrupted the labeling of mycolic acids and PDIMs so we could not interpret data on wall-bound mycolates or PDIMs when these constructs were used.
TABLE 3.
Lipid labeling with acetate in the pykA constructs of M. tuberculosis (H37Rv) and M. bovis (type 35) compared to their parent strains
| Strain | Mean dpm (dry wt) of bacteriaa ± SD |
Mean % ± SD |
|||||
|---|---|---|---|---|---|---|---|
| Nonpolar lipids, 2 h, no chase | Nonpolar lipids: after 20-h chase | Triacylglycerol, 2 h | Triacylglycerol, after 20-h chase | PDIMs, 2 h | PDIMs, after 20-h chase | Free fatty acids, 2 hb | |
| M. tuberculosis wild type | 12,287 ± 2,097 | 8,339 ± 1,630 | 2.24 ± 0.32 | 1.10 ± 0.14 | 5.51 ± 1.47 | 5.60 ± 2.19 | 5.13 ± 2.26 |
| M. tuberculosis ΔpykA mutant | 11,039 ± 4,190 | 6,400 ± 2,354 | 0.54 ± 0.27 | 0 (<0.1) ± 0.25 | 0.92 ± 0.22 | 1.92 ± 0.79 | 0.34 ± 0.14 |
| M. bovis/pSM81 | 35,800 ± 6,262 | 18,473 ± 4,332 | 51.2 ± 6.22 | 36.7 ± 9.05 | 13.9 ± 1.54 | 24.2 ± 3.34 | 0.20 ± 0.15 |
| M. bovis/pLK102 | 103,925 ± 14,182 | 41,346 ± 3,637 | 73.3 ± 9.33 | 72.7 ± 6.15 | NLc | NL | 3.15 ± 0.85 |
Individual lipids are given as a percentage of this value for each strain. This nonpolar lipid fraction includes other lipids not shown in the table individually, including other acylglycerols, quinones, phenolic glycolipids, sulfolipids, and all the acyltrehaloses.
Labeled free fatty acids were not detectable after a 20-h chase.
NL, not labeled in this strain.
Effect of pykA on amino acid metabolism.
Alanine dehydrogenase (Ald) is not synthesized in wild-type M. bovis, so it was interesting that the pykA knockout of H37Rv had half the Ald protein of the parent strain, making its relative expression the fifth lowest in this knockout strain (Table 1; for a list of all proteins, see Table S3 in the supplemental material). This may explain why the double-knockout strain (H37Rv ΔpykA Δald) displayed a colony morphology virtually indistinguishable from that of the pykA single knockout. Although this link between colony morphotype and Ald protein levels was interesting, the difference in protein levels was not significant (P > 0.05); therefore, to investigate further the level of Ald, Ald enzyme activity was detected directly in cell extracts. The specific activities of Ald (nmol/min/mg of protein, mean ± the SEM) were as follows: in M. tuberculosis H37Rv, 53.0 ± 6.8; and in the M. tuberculosis H37Rv ΔpykA mutant, 18.4 ± 1.0. For this enzyme assay determination, the difference was highly significant (P = 0.008). Ald enzyme activity could not be detected in M. bovis, M. tuberculosis Δald, or the M. tuberculosis Δald ΔpykA double knockouts. Cell extracts from the wild-type M. tuberculosis H37Rv had a specific activity for pyruvate kinase of 180 nmol/min/mg of substrate. In M. tuberculosis Δald, the specific activity of pyruvate kinase in cell extracts was similar to that in the parent strain. In the double knockout, M. tuberculosis Δald ΔpykA, pyruvate kinase had a specific activity below the limit of detection. The limits of detection in the cell extracts were 0.7 nmol/min/mg of substrate for Ald and 1.0 nmol/min/mg of substrate for pyruvate kinase.
There were no evident changes in regulation of the biosynthetic pathways of other amino acids on the loss of pykA. For example, in the proteins encoded by the leucine biosynthesis operon, LeuA showed increased synthesis in both the M. tuberculosis ΔpykA knockout (see Table S3 in the supplemental material) and in M. bovis/pLK102 (see Table S1 in the supplemental material); LeuB was only detected in the M. tuberculosis ΔpykA mutant (see Table S6 in the supplemental material); and LeuC was only detected in the parent strain H37Rv (see Table S4 in the supplemental material) and in M. bovis/pLK102 (see Table S2 in the supplemental material), while LeuD was only detected in M. bovis/pLK102 (see Table S2 in the supplemental material).
Iron metabolism and oxidative stress.
The iron storage proteins bacterioferritins BfrA and BfrB and the iron-containing aconitase showed increased expression in M. bovis/pLK102 (see Table S1 in the supplemental material), a finding suggestive of high iron conditions (33, 45). Consistent with this association, the iron regulator IdeR showed slightly higher levels in M. bovis/pLK102, whereas HupB, associated with low iron conditions (46), showed decreased levels. Levels of proteins associated with high iron conditions showed little difference between the M. tuberculosis wild-type and M. tuberculosis ΔpykA mutant strains (see Table S3 in the supplemental material), and BfrA was detectable only in the the pykA knockout (see Table S6 in the supplemental material). However, a short-chain dehydrogenase and the 50S ribosomal protein, associated with low iron conditions (46), showed increased synthesis in the pykA knockout (see Table S3 in the supplemental material). When the relative levels of iron-related proteins in H37Rv and the construct control, M. bovis/pSM81, were compared, the high-iron-associated proteins BfrB, aconitase, and IdeR were all >70% higher in H37Rv, while the low-iron-associated proteins HbhA and HupB were >70% higher in M. bovis/pSM81 (see Table S9 in the supplemental material). Taken together, these data suggest increased synthesis of proteins associated with low-iron conditions upon the loss of pykA, even in the iron-sufficient medium used in the present study. The biological significance of this finding will become clearer when studies of iron depletion are conducted on the pykA knockout.
In the defense against oxidative stress, usually linked with iron regulation, AhpC was one of the three proteins showing the greatest relative increase when pykA was inactivated (Table 1; for list of all proteins, see Table S3 in the supplemental material). Other oxidative stress proteins with increased expression were the iron-containing superoxide dismutase (SodA) and catalase (KatG). All three proteins showed decreased levels when pykA was introduced into M. bovis/pLK102 (Table 1; for a list of all proteins, see Table S1 in the supplemental material). Although P values for the changes of most of these individual proteins were >0.05, if statistical analysis was performed on the data for the three proteins combined, the change was highly significant (see Table S8 in the supplemental material), presenting compelling evidence for the upregulation of proteins to cope with oxidative stress, upon loss of the pykA gene, and vice versa when pykA is cloned into M. bovis. The association of higher levels of SodA, KatG, and AhpC with the loss of pykA was also indicated by their higher levels in the M. bovis strain used in the present study (M. bovis/pSM81) than in M. tuberculosis H37Rv (see Table S9 in the supplemental material).
DISCUSSION
Pyruvate kinase (PykA) is at a pivotal point in metabolic pathways (Fig. 1) and consequentially it may be expected to have far-reaching effects on phenotype. As well as M. bovis, highly specialized pathogens such as Helicobacter pylori (1) and Treponema pallidum (14, 26) have lost pyruvate kinase, whereas Borrelia burgdorferi (13) and Mycoplasma pneumoniae (31) have mutations in other enzymes resulting in the loss of the glycolytic pathway. In the extreme example, Rickettsia spp. have lost all of their enzymes of glycolysis (40). Although M. bovis is very similar genetically to M. tuberculosis, it occupies a different niche; indeed the various pathogens of the M. tuberculosis complex have been suggested to be “ecotypes” (37). Therefore, we were interested to investigate whether the loss of pykA in M. bovis has led to far-reaching effects on phenotype as in other pathogens.
Our main findings reveal a new scenario for lipid catabolism in the M. tuberculosis complex on the loss of pykA. Proteomics revealed upregulation of fatty acid catabolism and the downregulation of fatty acid biosynthesis, Icl, and PckA (the link to gluconeogenesis) on the loss of pykA. The opposite effects were observed when the pykA gene was introduced into M. bovis, providing convincing evidence for linkage of these effects to loss of the pykA gene. This contrasts with the scenario from previous studies in M. tuberculosis, where Icl was upregulated along with β-oxidation, while Fas is downregulated when human M. tuberculosis adapts to life in the host (39) or in macrophages (35). Flux balance analysis (Table 2) was broadly consistent with the proteomic data at the point of divergence (isocitrate) between the TCA and glyoxylate cycles (Fig. 1). Therefore, we decided to check the fatty acid metabolism suggested by the proteomics directly, with cell-free enzyme assays of Fas and β-oxidation assays with suspensions of bacteria. These, together with analysis of metabolically labeled fatty acids, bore out the proteomic conclusions, even when, for example, in the case of Fas, high P values in the proteomics raised some doubt. In summary, on loss of pykA, and possibly in M. bovis generally, metabolism is geared principally to using fatty acids for energy production with Icl decreased and β-oxidation increased compared to pykA+ strains.
It is interesting that this new scenario was revealed even though both pykA+ and strains lacking pykA were grown on pyruvate. Clearly, the regulatory effects showed through even in the presence of the excess pyruvate that is present in the liquid media. In strains with an active pykA gene, higher flux through the glyoxylate cycle would allow the acetyl coenzyme A formed from pyruvate through pyruvate dehydrogenase to be used both for energy production and fatty acid and complex lipid biosynthesis. The upregulation of proteins involved in phthiocerol-based lipids, and their higher level of metabolic labeling in wild-type M. tuberculosis than in the M. tuberculosis ΔpykA mutant is consistent with this view.
Triacylglycerol formation was harder to explain. In isogenic strains, the ΔpykA strain always produced less fatty acid and triacylglycerol than the wild-type pykA strain, although M. bovis produced more triacylglycerol than M. tuberculosis (Table 3). The triacylglycerol may be a depot for most of the labeled fatty acid formed when these bacteria were pulsed with [1-14C]acetate to label their lipids, as it appears subsequently in other lipids such as cord factor and wall mycolates (43). It may be that the M. tuberculosis H37Rv strain used only makes abundant triacylglycerol in the presence of glycerol; in contrast, it has recently been observed that strains of the W-Beijing lineage of M. tuberculosis constitutively make abundant triacylglycerol (32). The proteomics offered no clue as to what was happening in our study, but the major triacylglycerol synthase protein (Tgs/Rv3130c) may be difficult to detect since studies to date have only shown its expression through transcriptional assays (9, 30, 32). Clearly, however, the loss of pykA affects triacylglycerol formation, and further investigation of this important lipid in dormancy as well as active metabolism is required.
Inactivation of the pykA gene in M. tuberculosis had effects on growth and colony morphology consistent with the differences we observed previously between M. bovis and M. bovis complemented with an active pykA gene (20). However, M. bovis naturally lacks an active ald gene as well. Therefore, we investigated the effect of knocking out the ald gene. The consequence of the double Δald ΔpykA mutation is that, as in M. bovis, growth on glycolytic substrates such as glycerol (confirmed in the present study) and alanine (7) is impossible and that flux between alanine and pyruvate cannot take place (Fig. 1). Interestingly, the Ald protein was one of the most downregulated proteins when pykA alone was knocked out in M. tuberculosis. We confirmed this proteomic data by measuring enzyme activity directly, showing alanine dehydrogenase activity was indeed lower in the pykA mutant than the parent strain. This may explain why making the double Δald ΔpykA mutant had little or no discernible effect on colony morphology compared to the single pykA knockout. With alanine dehydrogenase activity low in the pykA knockout and absent in the M. bovis constructs, we focused on the effect of the pykA deletion for the rest of the present study.
The effects of the loss of pykA were not just limited to carbon metabolism: effects on iron metabolism and response to oxidative stress were also evident in the proteomic data. Perhaps this is not too surprising since the regulation of all three is coordinated.
The coordinated upregulation of the three oxidative stress enzymes SodA, KatG, and AhpC when pykA was inactivated and their downregulation in M. bovis/pLK102 construct was highly significant. These proteins are regulated by OxyR in most microbes (17, 18, 27, 29, 36, 48), but this regulator has been lost in the M. tuberculosis complex (10, 28). It is an intriguing possibility that the loss of pykA in M. bovis may compensate for the loss of OxyR regulation through increasing the constitutive levels of oxidative defense enzymes. An interesting link between the AhpC-dependent antioxidant defense and pyruvate metabolism is that both require LpdC (6), given that flux through pyruvate dehydrogenase, an enzyme complex that includes LpdC, must be very low when pyruvate cannot be generated through the PykA catalyzed step, as in M. bovis (Fig. 1).
Iron-regulated proteins were also highlighted. Most notably, when M. bovis was complemented with pykA, proteins associated with high iron conditions, namely, the iron storage proteins BfrA and BfrB and the iron-containing enzyme aconitase, were significantly elevated. Aconitase, shown to be upregulated under high iron conditions in M. tuberculosis (45), both catalyzes the reversible isomerization of citrate and isocitrate via cis-aconitate, as part of the TCA cycle, and serves as an iron-responsive element exhibiting RNA-binding activity (2). Upregulation of some proteins associated with low-iron conditions (46) was observed in the pykA mutant strains, even though in the present study we used iron-sufficient conditions. For M. tuberculosis, 8 μg of Fe/ml was needed to repress the iron acquisition machinery (46), a higher concentration than is needed with other mycobacteria, and this may help explain how effects associated with iron regulation could be associated with the pykA gene in the present study. The iron-sufficient conditions used may also explain why a more complete low-iron response (e.g., proteins for siderophore biosynthesis) was not observed in the M. tuberculosis ΔpykA strain.
Classically, upregulation of oxidative stress proteins is linked with high-iron conditions. Yet, here the upregulation of some oxidative stress proteins on the loss of pykA was linked with a response consistent with low-iron conditions. However, the influence of iron levels does appear complex in M. tuberculosis as it elaborates two iron regulators, FurA and IdeR. Previously, in a study on the role of iron on oxidative stress proteins (12), the antioxidant protein AhpC was upregulated in low-iron conditions, which is consistent with our data. Subsequently, AhpC was shown to be one of the proteins induced by low-iron levels through the IdeR regulator (33) and the low-iron response appeared to be coregulated with the Ahp antioxidant response in M. tuberculosis in gamma interferon-stimulated macrophages (35).
The classical link between low-iron status and downregulation of the TCA cycle, with depleting iron downregulating the TCA cycle through the Fe-dependent aconitase (2) appears to be broken in the present study. However, in the iron-sufficient conditions used here aconitase should retain TCA cycle activity, and the overall flux through the TCA cycle needs to be measured. In the discussion of carbon metabolism, we focused on the relative flux through the TCA and glyoxylate cycles. The data on links between iron status and pykA remain tantalizing, and it will be of interest to test the fitness of strains of the M. tuberculosis complex with active and inactive pykA genes in low-iron growth conditions.
Regardless of the interpretation of the expression of individual proteins, these data provide powerful evidence for widespread effects after the deletion or complementation of the pykA gene. Proteomics is essentially a scanning technology and in the present study, testable and focused hypotheses have been generated about the influence of pykA on central metabolism and many of the activities implicated in host-adaptation such as iron metabolism and the response to oxidative stress. We have followed up and confirmed by enzyme assays the proteomics data on Ald, Fas and fatty acid oxidation. Apparent differences in the coordinate regulation of proteins in the present study clearly indicate that the effect of the loss of pykA in M. bovis must have been compensated for in many ways for what would seem, on the face of it, to be a highly deleterious loss. However, we also suggest that the loss of pykA in itself may compensate for earlier, conceptually deleterious losses: one we propose is oxyR. From the proteomics it is clear that mostly enzymes are affected, suggesting that considerable changes in metabolic flux do occur after the loss of pykA. It has been interesting to observe these effects when excess pyruvate was provided for growth, and it would be intriguing and arguably highly relevant to the biology of these mycobacteria to repeat these experiments but growing the bacteria on a lipid source of fatty acids. More generally, our data certainly indicate the value of studying M. bovis alongside M. tuberculosis to understand this deadly family of bacterial pathogens.
Supplementary Material
Acknowledgments
The research described was funded by DEFRA, United Kingdom. S.C. was the recipient of a Commonwealth Scholarship, supported by the British Council.
Footnotes
Published ahead of print on 9 October 2009.
Supplemental material for this article may be found at http://jb.asm.org/.
REFERENCES
- 1.Alm, R. A., J. Bina, B. M. Andrews, P. Doig, R. E. Hancock, and T. J. Trust. 2000. Comparative genomics of Helicobacter pylori: analysis of the outer membrane protein families. Infect. Immun. 68:4155-4168. [DOI] [PMC free article] [PubMed] [Google Scholar]
- 2.Banerjee, S., A. K. Nandyala, P. Raviprasad, N. Ahmed, and S. E. Hasnain. 2007. Iron-dependent RNA-binding activity of Mycobacterium tuberculosis aconitase. J. Bacteriol. 189:4046-4052. [DOI] [PMC free article] [PubMed] [Google Scholar]
- 3.Besra, G. S. 1998. Preparation of cell-wall fractions from mycobacteria, p. 91-107. In T. Parish and N. G. Stoker (ed.), Mycobacteria protocols, vol. 101. Humana Press, Inc., Totowa, NJ. [DOI] [PubMed] [Google Scholar]
- 4.Beste, D. J., T. Hooper, G. Stewart, B. Bonde, C. Avignone-Rossa, M. E. Bushell, P. Wheeler, S. Klamt, A. M. Kierzek, and J. McFadden. 2007. GSMN-TB: a web-based genome-scale network model of Mycobacterium tuberculosis metabolism. Genome Biol. 8:R89. [DOI] [PMC free article] [PubMed] [Google Scholar]
- 5.Brosch, R., S. V. Gordon, M. Marmiesse, P. Brodin, C. Buchrieser, K. Eiglmeier, T. Garnier, C. Gutierrez, G. Hewinson, K. Kremer, L. M. Parsons, A. S. Pym, S. Samper, D. van Soolingen, and S. T. Cole. 2002. A new evolutionary scenario for the Mycobacterium tuberculosis complex. Proc. Natl. Acad. Sci. USA 99:3684-3689. [DOI] [PMC free article] [PubMed] [Google Scholar]
- 6.Bryk, R., C. D. Lima, H. Erdjument-Bromage, P. Tempst, and C. Nathan. 2002. Metabolic enzymes of mycobacteria linked to antioxidant defense by a thioredoxin-like protein. Science 295:1073-1077. [DOI] [PubMed] [Google Scholar]
- 7.Chen, J. M., D. C. Alexander, M. A. Behr, and J. Liu. 2003. Mycobacterium bovis BCG vaccines exhibit defects in alanine and serine catabolism. Infect. Immun. 71:708-716. [DOI] [PMC free article] [PubMed] [Google Scholar]
- 8.Coldham, N. G., and M. J. Woodward. 2004. Characterization of the Salmonella typhimurium proteome by semi-automated two dimensional HPLC-mass spectrometry: detection of proteins implicated in multiple antibiotic resistance. J. Proteome Res. 3:595-603. [DOI] [PubMed] [Google Scholar]
- 9.Deb, C., J. Daniel, T. D. Sirakova, B. Abomoelak, V. S. Dubey, and P. E. Kolattukudy. 2006. A novel lipase belonging to the hormone-sensitive lipase family induced under starvation to utilize stored triacylglycerol in Mycobacterium tuberculosis. J. Biol. Chem. 281:3866-3875. [DOI] [PMC free article] [PubMed] [Google Scholar]
- 10.Deretic, V., J. Song, and E. Pagan-Ramos. 1997. Loss of oxyR in Mycobacterium tuberculosis. Trends Microbiol. 5:367-372. [DOI] [PubMed] [Google Scholar]
- 11.Dobson, G., D. E. Minnikin, S. M. Minnikin, J. H. Parlett, and M. Goodfellow. 1985. Systematic analysis of complex mycobacterial lipids, p. 237-265. In M. Goodfellow and D. E. Minnikin (ed.), Chemical methods in bacterial systematics. Academic Press, Ltd., London, England.
- 12.Dussurget, O., M. Rodriguez, and I. Smith. 1996. An ideR mutant of Mycobacterium smegmatis has derepressed siderophore production and an altered oxidative-stress response. Mol. Microbiol. 22:535-544. [DOI] [PubMed] [Google Scholar]
- 13.Fraser, C. M., S. Casjens, W. M. Huang, G. G. Sutton, R. Clayton, R. Lathigra, O. White, K. A. Ketchum, R. Dodson, E. K. Hickey, M. Gwinn, B. Dougherty, J. F. Tomb, R. D. Fleischmann, D. Richardson, J. Peterson, A. R. Kerlavage, J. Quackenbush, S. Salzberg, M. Hanson, R. van Vugt, N. Palmer, M. D. Adams, J. Gocayne, J. Weidman, T. Utterback, L. Watthey, L. McDonald, P. Artiach, C. Bowman, S. Garland, C. Fuji, M. D. Cotton, K. Horst, K. Roberts, B. Hatch, H. O. Smith, and J. C. Venter. 1997. Genomic sequence of a Lyme disease spirochaete, Borrelia burgdorferi. Nature 390:580-586. [DOI] [PubMed] [Google Scholar]
- 14.Fraser, C. M., S. J. Norris, G. M. Weinstock, O. White, G. G. Sutton, R. Dodson, M. Gwinn, E. K. Hickey, R. Clayton, K. A. Ketchum, E. Sodergren, J. M. Hardham, M. P. McLeod, S. Salzberg, J. Peterson, H. Khalak, D. Richardson, J. K. Howell, M. Chidambaram, T. Utterback, L. McDonald, P. Artiach, C. Bowman, M. D. Cotton, C. Fujii, S. Garland, B. Hatch, K. Horst, K. Roberts, M. Sandusky, J. Weidman, H. O. Smith, and J. C. Venter. 1998. Complete genome sequence of Treponema pallidum, the syphilis spirochete. Science 281:375-388. [DOI] [PubMed] [Google Scholar]
- 15.Gao, J., M. S. Friedrichs, A. R. Dongre, and G. J. Opiteck. 2005. Guidelines for the routine application of the peptide hits technique. J. Am. Soc. Mass Spectrom. 16:1231-1238. [DOI] [PubMed] [Google Scholar]
- 16.Garnier, T., K. Eiglmeier, J. C. Camus, N. Medina, H. Mansoor, M. Pryor, S. Duthoy, S. Grondin, C. Lacroix, C. Monsempe, S. Simon, B. Harris, R. Atkin, J. Doggett, R. Mayes, L. Keating, P. R. Wheeler, J. Parkhill, B. G. Barrell, S. T. Cole, S. V. Gordon, and R. G. Hewinson. 2003. The complete genome sequence of Mycobacterium bovis. Proc. Natl. Acad. Sci. USA 100:7877-7879. [DOI] [PMC free article] [PubMed] [Google Scholar]
- 17.Harrison, A., W. C. Ray, B. D. Baker, D. W. Armbruster, L. O. Bakaletz, and R. S. Munson, Jr. 2007. The OxyR regulon in nontypeable Haemophilus influenzae. J. Bacteriol. 189:1004-1012. [DOI] [PMC free article] [PubMed] [Google Scholar]
- 18.Hishinuma, S., M. Yuki, M. Fujimura, and F. Fukumori. 2006. OxyR regulated the expression of two major catalases, KatA and KatB, along with peroxiredoxin, AhpC in Pseudomonas putida. Environ. Microbiol. 8:2115-2124. [DOI] [PubMed] [Google Scholar]
- 19.Hutter, B., and M. Singh. 1999. Properties of the 40-kDa antigen of Mycobacterium tuberculosis, a functional l-alanine dehydrogenase. Biochem. J. 343:669-672. [PMC free article] [PubMed] [Google Scholar]
- 20.Keating, L. A., P. R. Wheeler, H. Mansoor, J. K. Inwald, J. Dale, R. G. Hewinson, and S. V. Gordon. 2005. The pyruvate requirement of some members of the Mycobacterium tuberculosis complex is due to an inactive pyruvate kinase: implications for in vivo growth. Mol. Microbiol. 56:163-174. [DOI] [PubMed] [Google Scholar]
- 21.Larsen, T. M., M. M. Benning, G. E. Wesenberg, I. Rayment, and G. H. Reed. 1997. Ligand-induced domain movement in pyruvate kinase: structure of the enzyme from rabbit muscle with Mg2+, K+, and l-phospholactate at 2.7 Å resolution. Arch. Biochem. Biophys. 345:199-206. [DOI] [PubMed] [Google Scholar]
- 22.Liu, H., R. G. Sadygov, and J. R. Yates III. 2004. A model for random sampling and estimation of relative protein abundance in shotgun proteomics. Anal. Chem. 76:4193-4201. [DOI] [PubMed] [Google Scholar]
- 23.Mueller, L. N., M. Y. Brusniak, D. R. Mani, and R. Aebersold. 2008. An assessment of software solutions for the analysis of mass spectrometry based quantitative proteomics data. J. Proteome Res. 7:51-61. [DOI] [PubMed] [Google Scholar]
- 24.Muirhead, H., D. A. Clayden, D. Barford, C. G. Lorimer, L. A. Fothergill-Gilmore, E. Schiltz, and W. Schmitt. 1986. The structure of cat muscle pyruvate kinase. EMBO J. 5:475-481. [DOI] [PMC free article] [PubMed] [Google Scholar]
- 25.Mukhopadhyay, B., E. M. Concar, and R. S. Wolfe. 2001. A GTP-dependent vertebrate-type phosphoenolpyruvate carboxykinase from Mycobacterium smegmatis. J. Biol. Chem. 276:16137-16145. [DOI] [PubMed] [Google Scholar]
- 26.Norris, S. J., D. L. Cox, and G. M. Weinstock. 2001. Biology of Treponema pallidum: correlation of functional activities with genome sequence data. J. Mol. Microbiol. Biotechnol. 3:37-62. [PubMed] [Google Scholar]
- 27.Ohara, N., Y. Kikuchi, M. Shoji, M. Naito, and K. Nakayama. 2006. Superoxide dismutase-encoding gene of the obligate anaerobe Porphyromonas gingivalis is regulated by the redox-sensing transcription activator OxyR. Microbiology 152:955-966. [DOI] [PubMed] [Google Scholar]
- 28.Pagan-Ramos, E., S. S. Master, C. L. Pritchett, R. Reimschuessel, M. Trucksis, G. S. Timmins, and V. Deretic. 2006. Molecular and physiological effects of mycobacterial oxyR inactivation. J. Bacteriol. 188:2674-2680. [DOI] [PMC free article] [PubMed] [Google Scholar]
- 29.Pagan-Ramos, E., J. Song, M. McFalone, M. H. Mudd, and V. Deretic. 1998. Oxidative stress response and characterization of the oxyR-ahpC and furA-katG loci in Mycobacterium marinum. J. Bacteriol. 180:4856-4864. [DOI] [PMC free article] [PubMed] [Google Scholar]
- 30.Pheiffer, C., J. C. Betts, H. R. Flynn, P. T. Lukey, and P. van Helden. 2005. Protein expression by a Beijing strain differs from that of another clinical isolate and Mycobacterium tuberculosis H37Rv. Microbiology 151:1139-1150. [DOI] [PubMed] [Google Scholar]
- 31.Pollack, J. D., M. V. Williams, and R. N. McElhaney. 1997. The comparative metabolism of the mollicutes (mycoplasmas): the utility for taxonomic classification and the relationship of putative gene annotation and phylogeny to enzymatic function in the smallest free-living cells. Crit. Rev. Microbiol. 23:269-354. [DOI] [PubMed] [Google Scholar]
- 32.Reed, M. B., S. Gagneux, K. Deriemer, P. M. Small, and C. E. Barry III. 2007. The W-Beijing lineage of Mycobacterium tuberculosis overproduces triglycerides and has the DosR dormancy regulon constitutively upregulated. J. Bacteriol. 189:2583-2589. [DOI] [PMC free article] [PubMed] [Google Scholar]
- 33.Rodriguez, G. M., M. I. Voskuil, B. Gold, G. K. Schoolnik, and I. Smith. 2002. ideR, An essential gene in Mycobacterium tuberculosis: role of IdeR in iron-dependent gene expression, iron metabolism, and oxidative stress response. Infect. Immun. 70:3371-3381. [DOI] [PMC free article] [PubMed] [Google Scholar]
- 34.Sassetti, C. M., and E. J. Rubin. 2003. Genetic requirements for mycobacterial survival during infection. Proc. Natl. Acad. Sci. USA 100:12989-12994. [DOI] [PMC free article] [PubMed] [Google Scholar]
- 35.Schnappinger, D., S. Ehrt, M. I. Voskuil, Y. Liu, J. A. Mangan, I. Monahan, G. Dolganov, B. Efron, P. D. Butcher, C. Nathan, and G. K. Schoolnik. 2003. Transcriptional adaptation of Mycobacterium tuberculosis within macrophages: insights into the phagosomal environment. J. Experimental Medicine. 198:693-704. [DOI] [PMC free article] [PubMed] [Google Scholar]
- 36.Seib, K. L., H. J. Wu, Y. N. Srikhanta, J. L. Edwards, M. L. Falsetta, A. J. Hamilton, T. L. Maguire, S. M. Grimmond, M. A. Apicella, A. G. McEwan, and M. P. Jennings. 2007. Characterization of the OxyR regulon of Neisseria gonorrhoeae. Mol. Microbiol. 63:54-68. [DOI] [PubMed] [Google Scholar]
- 37.Smith, N. H., K. Kremer, J. Inwald, J. Dale, J. R. Driscoll, S. V. Gordon, D. van Soolingen, R. G. Hewinson, and J. M. Smith. 2006. Ecotypes of the Mycobacterium tuberculosis complex. J. Theor. Biol. 239:220-225. [DOI] [PubMed] [Google Scholar]
- 38.Stonebrink, B. 1958. The use of a pyruvate containing egg medium in the culture of isoniazid resistant strains of Mycobacterium tuberculosis var. hominis. Acta Tuberculosis Scandia 35:67-80. [Google Scholar]
- 39.Talaat, A. M., S. K. Ward, C. W. Wu, E. Rondon, C. Tavano, J. P. Bannantine, R. Lyons, and S. A. Johnston. 2007. Mycobacterial bacilli are metabolically active during chronic tuberculosis in murine lungs: insights from genome-wide transcriptional profiling. J. Bacteriol. 189:4265-4274. [DOI] [PMC free article] [PubMed] [Google Scholar]
- 40.Walker, D. H., and X. J. Yu. 2005. Progress in rickettsial genome analysis from pioneering of Rickettsia prowazekii to the recent Rickettsia typhi. Ann. N. Y. Acad. Sci. 1063:13-25. [DOI] [PubMed] [Google Scholar]
- 41.Wheeler, P. R. 2008. Analysis of Lipid biosynthesis and location, p. 61-81. In T. Parish and A. Brown (ed.), Mycobacteria protocols, 2nd ed., vol. 465. Humana Press, Inc., Totowa, NJ. [Google Scholar]
- 42.Wheeler, P. R. 1983. Catabolic pathways for glucose, glycerol and 6-phosphogluconate in Mycobacterium leprae grown in armadillo tissues. J. Gen. Microbiol. 129:1481-1495. [DOI] [PubMed] [Google Scholar]
- 43.Wheeler, P. R., R. Brosch, N. G. Coldham, J. K. Inwald, R. G. Hewinson, and S. V. Gordon. 2008. Functional analysis of a clonal deletion in an epidemic strain of Mycobacterium bovis reveals a role in lipid metabolism. Microbiology 154:3731-3742. [DOI] [PubMed] [Google Scholar]
- 44.Wheeler, P. R., K. Bulmer, and C. Ratledge. 1990. Enzymes for biosynthesis de novo and elongation of fatty acids in mycobacteria grown in host cells: is Mycobacterium leprae competent in fatty acid biosynthesis? J. Gen. Microbiol. 136:211-217. [DOI] [PubMed] [Google Scholar]
- 45.Wong, D. K., B. Y. Lee, M. A. Horwitz, and B. W. Gibson. 1999. Identification of fur, aconitase, and other proteins expressed by Mycobacterium tuberculosis under conditions of low and high concentrations of iron by combined two-dimensional gel electrophoresis and mass spectrometry. Infect. Immun. 67:327-336. [DOI] [PMC free article] [PubMed] [Google Scholar]
- 46.Yeruva, V. C., S. Duggirala, V. Lakshmi, D. Kolarich, F. Altmann, and M. Sritharan. 2006. Identification and characterization of a major cell wall-associated iron-regulated envelope protein (Irep-28) in Mycobacterium tuberculosis. Clin. Vaccine Immunol. 13:1137-1142. [DOI] [PMC free article] [PubMed] [Google Scholar]
- 47.Zhang, B., N. C. VerBerkmoes, M. A. Langston, E. Uberbacher, R. L. Hettich, and N. F. Samatova. 2006. Detecting differential and correlated protein expression in label-free shotgun proteomics. J. Proteome Res. 5:2909-2918. [DOI] [PubMed] [Google Scholar]
- 48.Zheng, M., X. Wang, L. J. Templeton, D. R. Smulski, R. A. LaRossa, and G. Storz. 2001. DNA microarray-mediated transcriptional profiling of the Escherichia coli response to hydrogen peroxide. J. Bacteriol. 183:4562-4570. [DOI] [PMC free article] [PubMed] [Google Scholar]
Associated Data
This section collects any data citations, data availability statements, or supplementary materials included in this article.