

Abstract
Complex cell behaviors are usually triggered by multivalent ligands that first bind to membrane receptors and then promote receptor clustering, thus altering intracellular signal transduction. While it is possible to produce such altered signal transduction by synthetic means, the development of chemically defined multivalent ligands of effectors is sometimes difficult and tedious. Specifically, the average spacing between two binding sites within an antibody and the average distance between receptors on the cell membrane are usually larger than most organic molecules. In this study, we directly address these challenges by demonstrating how gold nanoparticles (AuNPs) of precisely controlled mean diameters can be easily synthesized and surface-modified with dinitrophenyl (DNP) at an equally well-controlled ligand density, or spacing. We found that both nanoparticle size and surface ligand density play key regulatory roles in the process of membrane antibody-receptor (IgE-FcεRI) binding and cross-linking, which, in turn, leads to degranulation and consequent release of chemical mediators on rat basophilic leukemia cells. In addition, by adjusting DNP-AuNP architecture we discovered that our conjugates could either promote or inhibit cellular activation. Thus, these results demonstrate that nanoparticles not only serve as simple platforms for multivalent binding, but also as mediators for key biological functions. As such, the findings we report here may provide insight into the use of nanoparticles as a comprehensive tool for use in detailed receptor/ligand interaction studies and in the design of nanoscale delivery and therapeutic systems.
Introduction
Ligand-mediated receptor clustering that alters intracellular signaling is ubiquitous in nature.1,2 Processes ranging from viral entry into a host cell to antigen-induced stimulation of signal transduction in host immune response are all governed by the formation of cross-links among multiple receptor-ligand bonds. The activation of mast cells provides an example of this phenomenon. As a consequence of the abundance of FcεRI cell-surface receptors, the RBL-2H3 mast cell line is the most widely used and convenient model system for the study of regulated secretion. When a multivalent antigen cross-links IgE antibodies bound to these high affinity receptors, an immune allergic response is initiated. It has been found that oligomerization of surface receptors by multivalent antigen recognition will enhance phosphorylation of the tyrosine-based activation motif within FcεRI β and γ subunits via the Src family kinase, Lyn,3 which, in turn, generates a complex cascade of intracellular events leading to degranulation. Degranulation then releases chemical mediators in the mast cells, including histamine,4 serotonin,5 and β-hexosaminidase,6 finally initiating local inflammatory response.
Signals generated by FcεRI aggregation depend on various properties of the cross-linking structures that are formed on the cell surface, including the size of aggregates,7 the spacing of receptors in cross-links,8 and the time individual receptors spend within a complex.9 However, the factors that cause an aggregate to be a robust signaling unit, an inhibitor of signal transduction, or a non-signaling unit remain to be fully elucidated. Notwithstanding these unknowns, it is the prevalence of cellular responses governed by receptor-ligand interactions that provides our motivation for the rational design and synthesis of both effectors and inhibitors with which to both manipulate binding events and gain an understanding of them.
Because naturally occurring multivalent ligands are often too scarce, structurally heterogeneous, or complex (such as antigen or viral surface), defined synthetic ligands provide a valuable tool to investigate important receptor-ligand interactions. The architectural features of a ligand determine the mechanism by which it acts, and synthetic ligands can be tuned to either mimic the activity of natural substances that induce a cellular response or inhibit these interactions.10 In order to gain insight into structural requirements for effective function, dinitrophenyl (DNP)-appended double-stranded DNA (dsDNA)11,12, as a rigid linker, and ethylene glycol13–15, as a flexible backbone, have been developed as bivalent and trivalent ligands for quantitative analysis of the interactions between multivalent antigens and cell-surface receptors. Their results demonstrated that ligands with rigid dsDNA spacers of 4–5 nm stimulate stronger degranulation responses compared with those possessing spacing greater than approximately 7–10 nm.11,12 In contrast, long bivalent ligands with flexible spacers, such as poly(ethylene glycol) can form intramolecular cross-links with IgE, and these stable 1:1 complexes are very potent inhibitors of mast cell degranulation stimulated by multivalent antigen.13 By so doing, they could conclude that degranulation response not only relies on the linker length, but that the number of receptors in aggregates can also be quantified and correlated with specific cellular responses. Studies involving chemically defined oligovalent ligands have also added clinical significance because the information provided can benefit the design of targeted therapeutic and diagnostic platforms. Compared to most organic molecules, both the average spacing between two binding sites in an antibody and the average distance between receptors on the cell membrane are unusually large. Therefore, nanoparticles with precisely controlled shapes (spherical to rod-like) and sizes (nm to sub-μm) should be able to function as a universal platform for multivalent binding and be capable of cross-linking distant cell-surface receptors for a variety of cells.
Results and discussion
To test the hypothesis that nanoparticles of well-defined sizes can actively participate in the processes of regulating and modulating cellular responses, engineered multivalent nanoparticles were generated through covalent attachments of thiolated DNP onto gold nanoparticles (AuNPs) of various sizes. The attachment of multiple ligands onto the nanoparticle surface allows the formation of DNP molecules with different architectural features based on particle sizes and ligand densities, which, in turn, allows the selective control of specific interactions between DNP and IgE-FcεRI complexes in RBL-2H3 mast cells and the attendant alteration of cellular signal transduction (Scheme 1). In our experiment, stable suspensions of nanostructures of varied sizes ranging from 7.5 to 50.0 nm were prepared using colloidal AuNPs (See Supplementary Information, Figure S1). The size and shape of AuNPs can be easily controlled during synthesis, and the strong affinity of their surface towards thiols also allows the surface conjugation of multiple DNP with a precisely controllable density. As compared with unmodified AuNPs, DNP-conjugated AuNPs (DNP-AuNPs) were relatively stable after overnight incubation in 5 mM sodium tetraborate (pH 9.0). This result indicates that we had successfully attached thiolated DNP onto the surface of AuNPs (See Supplementary Information, Figure S2). To determine the surface coverage of DNP on AuNPs of various sizes, we monitored the fluorescence restoration of Rhodamine 6G (R6G) molecules released from the particle surface after thiol displacement. R6G molecules that are highly fluorescent in bulk solution fluoresce weakly when they have been adsorbed noncovalently onto the AuNP surface as a result of fluorescence resonance energy transfer (FRET) and collisional quenching with AuNPs.16 As illustrated in Figure 1a, the fluorescence of R6G is almost completely quenched by the AuNPs. However, upon the addition of thiolated DNP, which possesses strong Au-S bonding interactions with AuNPs, the fluorescence increases as a result of R6G molecules desorbing from the AuNP surface. Therefore, the fluorescence intensities (λex = 515 nm, λem = 555 nm) of solutions containing R6G-derived AuNPs (R6G-AuNPs) of all different sizes exhibit good linearity (R2 > 0.96) against the DNP concentration until thiolated DNP saturated the nanoparticle surface (data not shown). More specifically, in the case of the 15.4-nm AuNP, the fluorescence intensity increases within the range of DNP concentration from 0 to 27 μM (Figure 1a). However, when the amount of DNP added is above 27 μM, fluorescence starts decreasing as a consequence of quenching by the excess DNP in the free solution. The number of thiolated DNP which can saturate the particle surface was then calculated by defining the value that intersected between these two linear regressions (Inset in Figure 1a). The estimated surface coverage of DNP on a single 15.4-nm AuNP is about 30488 ± 835 (Table 1), which is very close to the value of small thiolated molecules reported in the literature.17 In order to confirm the sufficiency of R6G molecules on the nanoparticle surfaces accessible for displacement, we introduced additional thiol molecules, specifically, 2-mercaptoethanol (2-ME). 2-ME is neutral and small, and it possesses greater displacement efficiency than acidic and large thiols.18 After addition of excess 2-ME to the solution containing AuNPs with their surface saturated by DNP, a greater amount of R6G molecules were then released from the nanoparticle surface, and the fluorescence signal continued to increase (data not shown). The displacement of 2-ME also decreases the negative-charge density of AuNPs and causes nanoparticle aggregation, which mainly stems from less electrostatic repulsion after thiol passivation and the lesser degree of steric effect during the thiol replacement.
Scheme 1.

Schematic illustration of nanoparticle-mediated cellular response. The multivalent gold nanoparticles (AuNPs) were generated through covalent attachments of thiolated dinitrophenyl (DNP) onto AuNPs of various sizes. The attachment of multiple ligands onto the nanoparticle surface allows the formation of DNP molecules with different architectural features based on particle sizes and ligand densities, which, in turn, allows the selective control of specific interactions between DNP and IgE-FcεRI complexes in RBL-2H3 mast cells and the attendant alteration of cellular signal transduction.
Figure 1.

(a) Fluorescence spectra of R6G-AuNP (15.4-nm) solutions in the absence (i) and presence of thiolated DNP with (ii) 4, (iii) 9, (iv) 18, (v) 27, (vi) 36, (vii) 45, and (viii) 54 μM. Inset: the plot of fluorescence signal at 555 nm versus the concentration of DNP. (b) DNP loading analysis. DNP loading as a function of nanoparticle size (squares, experimental measurement; dashed line, calculation assuming constant DNP coverage density).
Table 1.
Characteristic parameters on the preparation and characterization of gold nanoparticles
| Set | Concentration of HAuCl4 (50 mL, %) | Amount of reducing agenta (mL) | Color | λmax | Average diameter (nm) | Concentration of nanoparticles (nM) | Saturated amount of DNP per nanoparticle |
|---|---|---|---|---|---|---|---|
| A | 0.04 | 1.5 | Brownish red | 517 | 7.5 ± 1.1 | 77.0 | 3435 ± 103 |
| B | 0.01 | 3.0 | Red | 519 | 15.4 ± 1.5 | 2.25 | 30488 ± 835 |
| C | 0.01 | 2.0 | Red | 520 | 19.8 ± 2.0 | 1.06 | 38796 ± 1085 |
| D | 0.01 | 1.7 | Red | 522 | 25.8 ± 3.5 | 0.48 | 65224 ± 1890 |
| E | 0.01 | 1.25 | Pinkish red | 528 | 39.1 ± 4.3 | 0.14 | 133195 ± 3996 |
| F | 0.01 | 1.0 | Pinkish red | 529 | 50.0 ± 7.8 | 0.07 | 257143 ± 8091 |
For AuNPs smaller than 10 nm (set A), 0.1 M sodium borohydride was used as a reducing agent; for AuNPs larger than 10 nm (set B to F), 1% trisodium citrate was used instead. The RSD of all the AuNPs in different sizes are less than 15%.
To investigate the role of particle sizes in stimulatory activities, thiolated DNP was attached to AuNPs of various sizes, with maximum loading densities of 30.6 ± 7.0 DNP/nm2. Exocytotic release of the granule marker β-hexosaminidase was used to quantify the extent of degranulation. In order to avoid nonspecific interaction and particle aggregation, 0.1% of BSA was applied to passivate the particle surface in balanced salt buffer (BSS: 135 mM NaCl, 5.0 mM KCl, 1.8 mM CaCl2, 1.0 mM MgCl2, 5.6 mM glucose, 20 mM HEPES, and 1.0 mg/mL BSA at pH 7.4). Therefore, all DNP-AuNP conjugates remained stable in various conditions for the duration of the experiment. When compared with AuNPs without DNP modification, we observed a significant release of β-hexosaminidase from the RBL-2H3 mast cells stimulated with DNP-AuNPs (Figure 2a). The absence of obviously stimulated release of enzyme activity from the cells without IgE sensitization also suggests that the interaction is specific to DNP-AuNPs toward IgE-FcεRI on the cell membrane (Figure 2a). Figure 2b is a representative result for the dose dependence of degranulation stimulated by DNP-AuNPs. Here, we use gold nanoparticles of 25.8-nm in size for stimulation, and all assays were repeated at least five times. Although data points in the plot are obtained by subtracting the degranulation response of nonspecific interaction from unmodified AuNPs, no significant cellular degranulation is induced above baseline unstimulated levels when the nanoparticle concentration is less than 2.4 nM. The biphasic nature of this dose-response curve is typical for a polyvalent ligand interacting with a bivalent receptor such as anti-DNP IgE.14 The degree of degranulation increases with DNP-AuNP concentration up to 0.6 nM. As a result of the predominant monovalent binding and/or desensitization, it then drops off above this threshold (Figure 2b). It is notable that these 25.8-nm DNP-AuNPs are very potent stimulators of RBL-2H3 cells comparable to the commonly used DNP-bovine serum albumin (DNP-BSA), with degranulation occurring in response to concentrations at the sub-nM level. Our result demonstrates that the maximal degranulation response is about 26 ± 2.7% β-hexosaminidase release, expressed as net percent of the cells’ total enzyme activity contents, and this value is 1.4 times higher than the maximal degranulation response stimulated by multivalent DNP-BSA (Molecular Probes, Carlsbad, CA) at the optimal concentration of 0.1 μg/mL.
Figure 2.

Degranulation of RBL-2H3 mast cells stimulated by DNP-BSA and DNP-AuNPs (25.8-nm). (a) Specific interactions between DNP-ligands and RBL-2H3 cells (i) without and (ii) with IgE sensitization. Degranulation is quantified as the percentage of total β-hexosaminidase release in Triton-X 100 cell lysates. Cells were stimulated by DNP-AuNP, AuNP of 0.6 nM, and DNP-BSA of 0.1 μg/mL. A small amount of spontaneous release (< 2%) occurs with cells that are not stimulated (control). (b) Dose dependence of β-hexosaminidase release from cells sensitized with anti-DNP IgE and incubated with varying concentrations of DNP-AuNPs (25.8-nm). Each of the data points in the plot is obtained by subtracting the degranulation response of nonspecific interaction from unmodified AuNPs.
The relationship between nanoparticle size and DNP loading is displayed in Figure 1b. As the nanoparticle diameter increases from 7.5 to 50.0 nm, the DNP loading increases by two orders of magnitude. For example, the DNP loading on a single 7.5-nm nanoparticle is about 3435 ± 103, while loading on a 50.0-nm nanoparticle is about 257143 ± 8091. However, the DNP density remains almost the same (30.6 ± 7.0 DNP/nm2) in these size ranges. The dashed lines in Figure 1b represent the theoretical loading, assuming a fixed density of 30.6 DNP/nm2 on AuNPs of all different sizes. Compared with our experimental results (squares), no significant divergence from the theoretical loading can be observed. This result differs from conjugation with macromolecules such as DNA19 or proteins,20 where a decrease in DNA density would commonly be observed as the particle size increases. This results from a decrease in the curvature of the nanoparticle surface, leading, in turn, to closer proximity of the DNA strands, thus intensifying interstrand repulsion. However, in our case, the DNP ligands are smaller and less negatively charged compared to macromolecules. Consequently, they can be highly packed onto the surface of AuNPs of various sizes (7.5-nm to 50.5-nm), but with a similar loading density.
To evaluate the structural features of DNP-AuNPs with respect to cross-linking IgE-FcεRI complexes for cell activation, we characterize both the relationship of the concentration that can induce the maximum degranulation (Figure 3a) as well as the strength of stimulatory response (Figure 3b) with DNP-AuNPs of different sizes. For simplicity, the specific concentration for inducing the maximum degranulation response is defined as Cmax. Our result exhibits that the stimulatory capability of these multivalent DNP-AuNPs is tunable by nanoparticle size. The smallest DNP-AuNPs (7.5-nm) stimulated the lowest degree of degranulation (11 ± 0.9%) in RBL-2H3 cells with optimal response at 38.5 nM. However, the magnitude of the degranulation response increases as the particle size becomes larger, and the cutoff point occurs at DNP-AuNPs of 19.8-nm. The concentration of DNP-AuNPs that produces maximal degranulation (26 ± 2.7%) also shifts to a lower concentration when compared to results observed using smaller DNP-AuNPs. For example, the Cmax of 7.5- and 25.8-nm DNP-AuNPs is about 38.5 and 0.6 nM, respectively. Although the cross-linking of IgE-FcεRI on the cell surface by these multivalent DNP-AuNPs is difficult to predict theoretically because of the complex and diverse aggregation structures that might form, our results still imply that the stronger degranulation responses occur at lower concentration of larger DNP-AuNPs. One possible reason for the lower concentration corresponding to maximal cross-linking (Cmax) of larger particles is that nanoparticles of larger sizes can enhance the multivalency of DNP-AuNPs. Therefore, with higher binding avidity, larger DNP-AuNPs can firmly anchor on cell surfaces, resulting in prolonged receptor binding. The decrease in the rate of dissociation (koff) of these two polyvalent entities (multivalent DNP-AuNPs and multiple IgE-FcεRI complexes) may contribute to the significant enhancement in binding affinity.2 In order to validate this assumption, we determined the binding affinities (Kd) of DNP-AuNPs toward IgE-FcεRI through a fluorescence quenching method. Prior to harvesting, cells were sensitized with Alexa488-IgE for at least 12 h. A suspension of sensitized cells was then incubated with DNP-AuNPs of various concentrations. After 1 h, the binding had reached equilibrium, and the mean Alexa488 fluorescence of the cell suspension was recorded by flow cytometry. DNP-AuNPs were found to quench the fluorescence of Alexa488-IgE efficiently through the DNP-IgE interaction. To correct for nonspecific binding of DNP-AuNPs to cells, we performed a control experiment using AuNPs without DNP modification. Since the results demonstrated a noticeable change in the fluorescence signal observed between DNP-AuNP- and AuNP-labeled cells, the fluorescence differences were then ascribed to the specific binding. Therefore, fitting the data to a simple binding model that yields a single apparent dissociation constant (Kd) (See Supplementary Information, Figure S3) can serve as a measure of avidity. Using this model, our results showed that the Kd of 25.8-nm DNP-AuNPs (Kd = 1.1 ± 0.2 nM) is at least 22 times smaller than that of 7.5-nm DNP-AuNPs (Kd = 24.1 ± 5.6 nM). This observation verifies that larger DNP-AuNPs possess stronger binding capability which is consistent with what has been reported previously for the binding between herceptin (Her)-AuNPs and ErbB2 receptors on SK-BR-3 breast cancer cells where the Kd value varies inversely with the size of Her-AuNPs.20 For both cases, it should also be noted that the binding capability is significantly enhanced (about one or two orders in magnitude), as the size of AuNPs increases from 2 or 10 nm to 25 nm, then levels off when the size is larger than 25-nm.
Figure 3.

Degranulation of IgE-sensitized RBL-2H3 mast cells stimulated by DNP-AuNPs. Effect of (a) Cmax and (b) degranulation response for different sizes of DNP-AuNPs.
Figure 3b summarizes the size-dependent effect of DNP-AuNPs on the degree of degranulation response. The scale in y-axis represents the net percent of the cells’ total enzyme activity contents and has been normalized to the maximal degranulation response stimulated by multivalent DNP-BSA at the optimal concentration of 0.1 μg/mL. Our results demonstrate that DNP-AuNPs of sizes larger than 19.8-nm exhibit a higher degree of IgE-FcεRI cross-linking and are efficient for cell activation. According to the fluorescence correlation spectroscopic (FCS) measurement reported recently, the mean density of IgE receptors on the surface of the RBL-2H3 cell line is about 1200 ± 60 receptor/μm2.21 This estimation gives an IgE receptor density per cell of 288000 ± 1200 which is comparable to that obtained by the fluorescence quenching method.22 It also shows that the distance between two adjacent receptors is around 32.6 nm. Receptor spacing may also be detected using scanning electron microscopy (SEM), which measures the nearest-neighbor distances between bead-bead pairs after the binding of monovalent nanobeads to IgE receptors. Quantitative analysis based on this method revealed that the separation distance was less than 27.7 ± 1.7 nm.23 From the dynamic light scattering (DLS) measurement, the hydrodynamic diameter of DNP-AuNPs with sizes of 19.8 and 25.8-nm is determined as 25.3 ± 0.1 and 33.9 ± 0.2, respectively (see Supplementary Information, Figure S4). These data imply that DNP-AuNPs of sizes larger than 19.8-nm are sufficient to cross-link different IgE-FcεRIs on the cell membrane, leading to a higher degree of degranulation response. In addition, the exposed surface area of DNP-AuNPs with size of 19.8-nm, which equals 1231 nm2, allows binding of more than a few DNP sites because the area covered by a bound antibody Fab arm is about 30 nm2.24,25 Although a previous study showed that highly purified IgE dimers are sufficient to trigger RBL mast cell degranulation, trimer and larger oligomers trigger substantially better response.26 These results confirm a strong correlation between the magnitude of triggering FcεRI signaling and the aggregate size. This means that a higher degranulation response (1.4-fold) can be observed when treated with 25.8-nm DNP-AuNP than that stimulated by multivalent DNP-BSA which was on the same order of size as the antibodies. Overall, these results suggest that nanoparticle size plays an important role in regulating the cross-linking capacities of DNP-AuNPs with IgE-FcεRI complexes. Thus, engineering nanoparticles of well-defined sizes is useful for regulating different cellular activation responses, which, in turn, forecasts a potentially efficient and effective approach for future applications in molecular interaction studies and density estimations for subcellular membrane receptors.
Our results, as described above, have established that DNP-AuNPs of 19.8-nm in size are effective triggers, but only in the case of highly grafted DNP density. However, by decreasing the surface density of DNP on AuNPs such that the spacing of two DNPs becomes distant, we speculate that the antigen-mediated clustering of IgE-FcεRI complexes would then be precluded, thereby inhibiting immune response (Scheme 1). To study the effect of ligand densities on cross-linking capabilities, the surface density of the recognition unit DNP is adjusted by co-attachment of diluent thiols, 3,3′-dithioldipropionic acid, onto the surface of AuNPs. These diluent co-ligands are suitable in terms of maintaining particle stability and can also protect the surface from nonspecific adsorption of these hydrophobic DNP molecules.27 As demonstrated in Figure 4a, DNP-AuNPs with lower ligand densities stimulate progressively reduced degranulation response, with only a small amount of β-hexosaminidase release (< 5%) for AuNPs of less than 19 DNP on one single nanoparticle. Since the total surface area of AuNPs with a 19.8-nm size is 1231 nm2, the maximum average distance between any two DNPs could be estimated as 9.08 nm for the 19.8-nm DNP-AuNPs. This result suggests that a cross-linked complex with limited signaling capacity could be generated by reducing DNP density on the AuNP surface until the spacing between each ligand becomes 10-nm apart. The capacity of DNP-AuNPs to inhibit binding and cellular activation caused by an antigen that is an effective intermolecular cross-linker was also assessed by first pre-incubating the sensitized cells with these inhibitory nanoparticles for 60 min and then subsequently introducing multivalent DNP-BSA at 0.1 μg/mL for an additional 60 min. Results given in Figure 4a show that the most potent inhibition of degranulation stimulated by DNP-BSA is 64% and can be achieved by AuNPs with 10 DNPs on their surfaces. However, the inhibition becomes less effective when continually reducing the ligand densities to only 2 DNPs on one single nanoparticle. This differential inhibition capacity can account for the less stable intermolecular cross-linking on the cell surface with DNP-AuNPs of lower valency when a competitive multivalent antigen (DNP-BSA) is present. Generally, however, the trend among DNP-AuNPs of different ligand densities suggests that 10 DNP-AuNPs are the most conducive for stable intermolecular cross-linking and reveals that effective competitive inhibition can be achieved with a triple experimental average IC50 value of 0.6 ± 0.1 nM (Figure 4b), which is sufficient to inhibit 50% of degranulation stimulated by 0.1 μg/mL DNP-BSA. AuNPs without DNP modification were also applied in a control experiment to reveal the negligible nonspecific interactions.
Figure 4.

(a) Degranulation of IgE-sensitized RBL-2H3 mast cells stimulated by DNP-AuNPs (19.8-nm) of different ligand densities. For inhibition studies, cells were pre-incubated with DNP-AuNPs of 2.7 nM for 1 h at 37 °C and then stimulated by 0.1 μg/mL DNP-BSA for one additional hour. (b) Inhibition of degranulation stimulated by 0.1 μg/mL DNP-BSA, with DNP-AuNPs of (□) 10 and (●) 0 DNP on one nanoparticle.
Conclusion
In summary, we have demonstrated that engineered nanoparticles of well-defined sizes and surface ligand densities can selectively control the degree of receptor cross-linking, which, in turn, alters downstream signaling and subsequent cellular responses. With sizes larger than 19.8-nm, DNP-AuNPs demonstrated the greatest effect on β-hexosaminidase secretion and were very potent effectors of RBL-2H3 mast cells for inflammatory response. However, by decreasing the DNP surface coverage to 10 molecules per nanoparticle (19.8-nm), effective inhibitors can be generated by competitively inhibiting the degranulation stimulated by DNP-BSA. These findings provide strong evidence that DNP-AuNPs of different architectures can actively engage and mediate the molecular processes that are essential for regulating cell functions. Therefore, this concept has significant implications in understanding the interactions between nanostructures and biological systems, which, in turn, will lead to the design of intelligent nanoprobes for novel molecular-based diagnostics and therapeutics.
Methods and Materials
Cell Culture
RBL-2H3 cells (American Type Culture Collection) were maintained in monolayer culture in Eagle’s minimum essential medium (ATCC, Manassas, VA) supplemented with 20% fetal bovine serum (Atlanta Biologicals, Norcross, GA) and 100 IU/mL penicillin-Streptomycin. Typically, cells were used 3–5 days after passage. Cells were harvested by treatment with trypsin (0.05%)/EDTA (0.53 mm) in HBSS at 37 °C for 7 min, centrifuged at 970 rpm for 3 min, and resuspended at 5.0×10⁵ cells/mL. The cells were mixed with five-fold molar excess of mouse monoclonal anti-DNP-IgE antibodies (Clone SPE-7, Sigma-Aldrich, St. Louis, MO) over FcεRI, and then a 500 μL cell suspension was plated in black 48-well tissue culture plates (Costar Inc., Acton, MA) at 2.5×10⁵ cells/mL and incubated overnight at 37 °C in a 5% CO2 incubator.
β-Hexosaminidase Release Assays
Similar to the procedure described previously,28 IgE-sensitized RBL cells were washed twice in balanced salt buffer (BSS: 135 mM NaCl, 5.0 mM KCl, 1.8 mM CaCl2, 1.0 mM MgCl2, 5.6 mM glucose, 20 mM HEPES, and 1.0 mg/mL BSA at pH 7.4), and stimulation was initiated by the addition of 300 μL of serially diluted antigen in BSS containing 2 μM cytochalasin D (Sigma-Aldrich). The samples were then incubated for 1 h at 37 °C, and degranulation was stopped by placing the cells on ice. To determine the amount of β-hexosaminidase activity released by the cells, 25 μL of supernatant (14000 rpm, 20 min) and 100 μL of 1.2 mM β-hexosaminidase-substrate (4-methylumbelliferyl-N-acetyl-β-D-glucosaminide, Sigma-Aldrich) in 0.05M sodium acetate buffer (pH 4.4) were mixed in a separate 96-well plate and incubated for 30 min, at 37 °C. The reaction was quenched by addition of 175 μL of 0.1 M glycine-carbonate buffer, pH 10.0. Controls without antigen were used to measure spontaneous release. Total β-hexosaminidase release was obtained by lysing the cells with 0.1% Triton-X 100 prior to removal of supernatant for measurement of β-hexosaminidase activity. β-hexosaminidase activity in the supernatant was quantified by measuring the fluorescence intensity of the hydrolyzed substrate in a fluorescence microplate reader (Tecan Inc., Männedorf, Switzerland) with the excitation at 360 nm and the emission at 450 nm. Background fluorescence with substrate in buffer alone (no cell supernatant) was subtracted from all readings.
Nanoparticle Synthesis
Various sizes of AuNPs were synthesized according to the method developed by Frens.29 AuNPs were used as a model system because of the simplicity and reproducibility of the synthetic and bioconjugation techniques. Briefly, 0.5 ml of 1% chloroauric acid (Sigma-Aldrich) was added to 50 ml of de-ionized water, and the solution was heated to boiling. Next, 3.0, 2.0, 1.7, 1.25, and 1.0 mL of 1% trisodium citrate (Riedel-deHaën, Seelze, Germany) were added to the solution to synthesize 15-, 20-, 25-, 40-, and 50-nm AuNPs, respectively. The solution was refluxed until a color change from dark blue to red was observed. The citrate-protected AuNPs smaller than 10 nm were prepared by a different procedure.30 Briefly, 10 mL of 0.04% aqueous solution of HAuCl4 was mixed with 0.8 mL of 38.8 mM aqueous sodium citrate solution used as a stabilizer. Then, 0.3 mL of 0.1 M aqueous solution of sodium borohydride (Sigma-Aldrich) was added dropwise under vigorous stirring, giving rise to a red Au hydrosol. The sizes and absorption spectra of various AuNPs were verified with the Hitachi H-7100 transmission electron microscope (Tokyo, Japan) and the Cary 100 UV-Vis spectrophotometer (Varian, Palo Alto, CA). The concentration of AuNPs in each aliquot was also determined by UV-Vis spectroscopic measurements via Beer’s law (A = εbc).19 For simplicity, the concentrations of all as-prepared AuNP solutions are denoted as 1×. Preparation parameters for, and characterizations of, different sets of AuNPs are summarized in Table 1.
Nanoparticle Functionalization
The thiolated DNP was synthesized in a two-step reaction: First, 3,3′-dithioldipropionic acid (1 g, 4.75 mmol) was dissolved in 20 mL dichloromethane, and N,N′-dicyclohexylcarbodiimide (2.16 g, 10.5 mmol) and N-hydroxysuccinimide (1.21 g, 10.5 mmol) were added. The mixture was stirred for 2 h at room temperature. After filtering away the solid, the solution was concentrated in vacuo, and the obtained residue was subjected to silica column chromatography (ethyl acetate: hexanes = 1:5) to give the DTP-NHS conjugate. Yield: 85%, 1H NMR (Varian Mercury, 300MHz, DMSO d6) δ 3.16 (m, 8H), 2.82 (s, 8H). Second, DTP-NHS conjugate (116 mg, 0.287 mmol) was reacted with DNP-L-lysine hydrochloride (200 mg, 0.573 mmol) and N,N-diisopropylethylamine (148 mg, 1.15 mmol) in 1 mL DMSO. The reaction mixture was stirred at room temperature for 4 h. The DMSO was removed under vacuum, and the crude product was purified by silica column chromatography (ethyl acetate: hexanes = 5:1). Yield 70%, 1H NMR (Varian Mercury, 300MHz, DMSO d6) δ 8.82 (m, 2H), 8.23 (m, 2H), 7.20 (d, 2H), 4.18 (m, 2H), 3.55 (m, 4H), 3.10 (m, 4H), 2.82 (m, 4H), 1.4–1.9 (m, 6H). The chemical structure of thiolated DNP was:
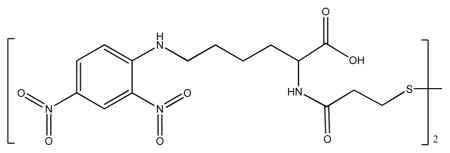
Before conjugation, the disulfide bond on the DNP probe (1 mM) was reduced by 5 mM tris(2-carboxyethyl)phosphine (Sigma-Aldrich) in 50 mM Tris-HCl (pH 7.5) buffer for 1 h at room temperature. Freshly cleaved thiolated DNP with corresponding calculated amount (Table 1) was then added to AuNPs with the concentration of 0.5×, which were prepared in 5 mM sodium tetraborate (pH 9.0). The solutions were equilibrated at room temperature overnight, and a small volume of 10% bovine serum albumen (BSA) (Sigma) solution was then added to the mixture to bring its final concentration to 0.1% in order to prevent nanoparticle aggregation in BSS. To remove excess DNP, AuNPs were subjected to two cycles of centrifugation, and the supernatant was removed, leaving a pellet of AuNPs at the bottom. The particles were then resuspended in BSS containing 2 μM cytochalasin D.
DNP Surface Coverage Determination
To determine the amount of DNP bound to the AuNP surface, we followed the procedure described by Chang et al.16,18 Different aliquots of Rhodamine 6G (R6G) solution were added to AuNPs (0.5×) of various sizes that were prepared in 5 mM sodium tetraborate (pH 9.0) to get the final concentrations of 0.04 to 0.86 μM. The solution was allowed to incubate at room temperature for 2 h. The fluorescence spectrum of the as-prepared R6G-AuNP solution was measured using a microplate reader with excitation at 515 nm. The very low fluorescence observed in the fluorescence spectrum of the R6G-AuNP solution indicated that all of the R6G molecules had effectively adsorbed onto the AuNPs, and thus their fluorescence was strongly quenched by the AuNPs via fluorescence resonance energy transfer (FRET) processes. For DNP determination, different amounts of thiolated DNP were added to R6G-AuNP solutions separately and equilibrated overnight. The mixtures were then centrifuged at 14,000 rpm for 1 h, and the supernatants were subjected to fluorescence measurement to record the fluorescence signal from R6G molecules at 555 nm.
Supplementary Material
Acknowledgments
We thank Dr. David Holowka from the Department of Chemistry and Chemical Biology at Cornell University for helpful discussions. This work was supported by NIH, NCI and NIGMS grants and by the State of Florida Center for Nano-Biosensors.
Footnotes
Supporting Information Available: Additional figures and experimental details. This information is available free of charge via the Internet at http://pubs.acs.org/.
References
- 1.Metzger H. J Immunol. 1992;149:1477–1487. [PubMed] [Google Scholar]
- 2.Mammen M, Choi SK, Whitesides GM. Angew Chem, Int Ed. 1998;37:2755–2794. doi: 10.1002/(SICI)1521-3773(19981102)37:20<2754::AID-ANIE2754>3.0.CO;2-3. [DOI] [PubMed] [Google Scholar]
- 3.Kinet JP. Annu Rev Immunol. 1999;17:931–972. doi: 10.1146/annurev.immunol.17.1.931. [DOI] [PubMed] [Google Scholar]
- 4.Barsumian EL, Isersky C, Petrino MG, Siraganian RP. Eur J Immunol. 1981;11:317–323. doi: 10.1002/eji.1830110410. [DOI] [PubMed] [Google Scholar]
- 5.Taurog JD, Fewtrell C, Becker EL. J Immunol. 1979;122:2150–2153. [PubMed] [Google Scholar]
- 6.Schwartz LB, Austen KF, Wasserman SI. J Immunol. 1979;123:1445–1450. [PubMed] [Google Scholar]
- 7.Ortega E, Schweitzerstenner R, Pecht I. EMBO J. 1988;7:4101–4109. doi: 10.1002/j.1460-2075.1988.tb03304.x. [DOI] [PMC free article] [PubMed] [Google Scholar]
- 8.Kane P, Erickson J, Fewtrell C, Baird B, Holowka D. Mol Immunol. 1986;23:783–790. doi: 10.1016/0161-5890(86)90090-8. [DOI] [PubMed] [Google Scholar]
- 9.Schweitzer-Stenner R, Pecht I. Immunol Lett. 1999;68:59–69. doi: 10.1016/s0165-2478(99)00031-0. [DOI] [PubMed] [Google Scholar]
- 10.Kiessling LL, Gestwicki JE, Strong LE. Angew Chem, Int Ed. 2006;45:2348–2368. doi: 10.1002/anie.200502794. [DOI] [PMC free article] [PubMed] [Google Scholar]
- 11.Paar JM, Harris NT, Holowka D, Baird B. J Immunol. 2002;169:856–864. doi: 10.4049/jimmunol.169.2.856. [DOI] [PubMed] [Google Scholar]
- 12.Sil D, Lee JB, Luo D, Holowka D, Baird B. Acs Chem Bio. 2007;2:674–684. [Google Scholar]
- 13.Baird EJ, Holowka D, Coates GW, Baird B. Biochemistry. 2003;42:12739–12748. doi: 10.1021/bi034884l. [DOI] [PubMed] [Google Scholar]
- 14.Posner RG, Geng D, Haymore S, Bogert J, Pecht I, Licht A, Savage PB. Org Lett. 2007;9:3551–3554. doi: 10.1021/ol071175h. [DOI] [PMC free article] [PubMed] [Google Scholar]
- 15.Das R, Baird E, Allen S, Baird B, Holowka D, Goldstein B. Biochemistry. 2008;47:1017–1030. doi: 10.1021/bi702094j. [DOI] [PubMed] [Google Scholar]
- 16.Huang CC, Chang HT. Anal Chem. 2006;78:8332–8338. doi: 10.1021/ac061487i. [DOI] [PubMed] [Google Scholar]
- 17.Huang YF, Chang HT. Anal Chem. 2006;78:1485–1493. doi: 10.1021/ac0517646. [DOI] [PubMed] [Google Scholar]
- 18.Chen SJ, Chang HT. Anal Chem. 2004;76:3727–3734. doi: 10.1021/ac049787s. [DOI] [PubMed] [Google Scholar]
- 19.Hurst SJ, Lytton-Jean AKR, Mirkin CA. Anal Chem. 2006;78:8313–8318. doi: 10.1021/ac0613582. [DOI] [PMC free article] [PubMed] [Google Scholar]
- 20.Jiang W, Kim BYS, Rutka JT, Chan WCW. nat nanotechnol. 2008;3:145–150. doi: 10.1038/nnano.2008.30. [DOI] [PubMed] [Google Scholar]
- 21.Chen Y, Munteanu AC, Huang YF, Phillips J, Zhu Z, Mavros M, Tan WH. Chem Eur J. 2009;15:5327–5336. doi: 10.1002/chem.200802305. [DOI] [PMC free article] [PubMed] [Google Scholar]
- 22.Erickson J, Goldstein B, Holowka D, Baird B. Biophys J. 1987;52:657–662. doi: 10.1016/S0006-3495(87)83258-7. [DOI] [PMC free article] [PubMed] [Google Scholar]
- 23.Mannix RJ, Kumar S, Cassiola F, Montoya-Zavala M, Feinstein E, Prentiss M, Ingber DE. Nat Nanotechnol. 2008;3:36–40. doi: 10.1038/nnano.2007.418. [DOI] [PubMed] [Google Scholar]
- 24.Poljak RJ, Amzel LM, Avey HP, Chen BL, Phizacke Rp, Saul F. Proc Nat Acad Sci USA. 1973;70:3305–3310. doi: 10.1073/pnas.70.12.3305. [DOI] [PMC free article] [PubMed] [Google Scholar]
- 25.Padlan EA. Mol Immunol. 1994;31:169–217. doi: 10.1016/0161-5890(94)90001-9. [DOI] [PubMed] [Google Scholar]
- 26.Fewtrell C, Metzger H. J Immunol. 1980;125:701–710. [PubMed] [Google Scholar]
- 27.Maxwell DJ, Taylor JR, Nie SM. J Am Chem Soc. 2002;124:9606–9612. doi: 10.1021/ja025814p. [DOI] [PubMed] [Google Scholar]
- 28.Naal R, Tabb J, Holowka D, Baird B. Biosens Bioelectron. 2004;20:791–796. doi: 10.1016/j.bios.2004.03.017. [DOI] [PubMed] [Google Scholar]
- 29.Frens G. Nature Phys Sci. 1973;241:20–22. [Google Scholar]
- 30.Yang J, Lee JY, Too HP, Chow GM, Gan LM. Chem Phys. 2006;323:304–312. [Google Scholar]
Associated Data
This section collects any data citations, data availability statements, or supplementary materials included in this article.