Abstract
The effects of temperature and urea denaturation (6M urea) on the dominant structures of the 20-residue Trp-cage mini-protein TC5b are investigated by molecular dynamics simulations of the protein at different temperatures in aqueous and in 6M urea solution using explicit solvent degrees of freedom and the GROMOS force-field parameter set 45A3. In aqueous solution at 278 K, TC5b is stable throughout the 20 ns of MD simulation and the trajectory structures largely agree with the NMR-NOE atom–atom distance data available. Raising the temperature to 360 K and to 400 K, the protein denatures within 22 ns and 3 ns, showing that the denaturation temperature is well below 360 K using the GROMOS force field. This is 40–90 K lower than the denaturation temperatures observed in simulations using other much used protein force fields. As the experimental denaturation temperature is about 315 K, the GROMOS force field appears not to overstabilize TC5b, as other force fields and the use of continuum solvation models seem to do. This feature may directly stem from the GROMOS force-field parameter calibration protocol, which primarily involves reproduction of condensed phase thermodynamic quantities such as energies, densities, and solvation free energies of small compounds representative for protein fragments. By adding 6M urea to the solution, the onset of denaturation is observed in the simulation, but is too slow to observe a particular side-chain side-chain contact (Trp6-Ile4) that was experimentally observed to be characteristic for the denatured state. Interestingly, using temperature denaturation, the process is accelerated and the experimental data are reproduced.
Keywords: TRP cage, denaturation, urea, MD, GROMOS
Introduction
Prediction of the most stable spatial structure of a protein is still one of the most difficult but practically relevant challenges in molecular biology. Although progress has been reported1,2 regarding prediction of protein backbone folds, understanding of the physical interactions between atoms that determine the preference for one or the other fold is still poor. The basic problem is that of a nonhomogeneous system containing many (103–104) degrees of freedom while showing small free energy differences (of the order of a few kBT) between many different possible spatial structures. Solving this problem computationally requires a very accurate (energetic accuracy < kBT) atomic interaction function and powerful sampling methods to scan the vast conformational space for low-energy conformations and to obtain sufficient statistics to grasp the entropic contributions to fold stabilization. In view of the latter, attempts to reproduce or predict the folding equilibrium of polypeptides using computer simulation techniques based on molecular dynamics (MD) and Monte-Carlo (MC) sampling have been restricted to relatively short chain lengths of up to 20 α-amino acid residues or even fewer β-amino acid residues.3–6
The so-called Trp-cage mini protein (See Fig. 1) is such a small, 20 α-amino acid residue protein, which has been studied experimentally reasonably well, and shows a stable fold in aqueous solution.7 Using various spectroscopic experimental probes (NMR, CD, fluorescence, and UV-Raman), its denaturation or unfolding temperature, which may vary with the observable that is measured, has been estimated as 315 K.7–10 Its folding time at room temperature was estimated at about 4 μs.11,12
Figure 1.
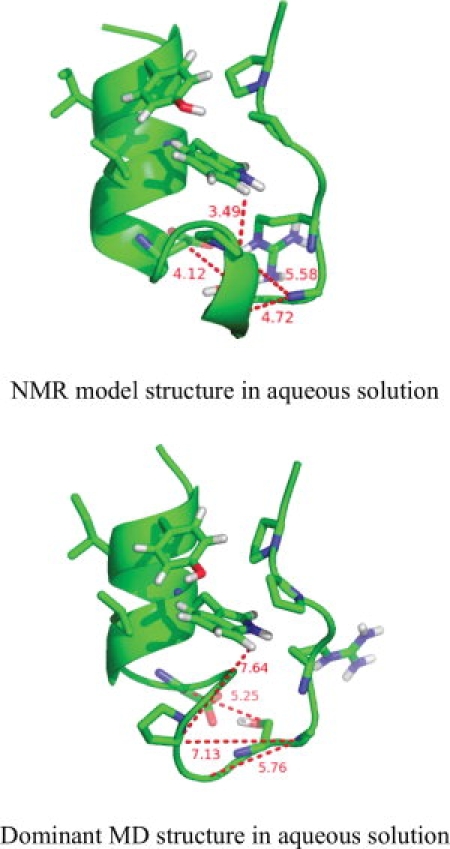
Cartoon representations of the first structure of the set of 38 NMR model structures7 (top structure) and of the central member structure of the first, most populated cluster of structures from the simulation of TC5b in aqueous solution at 278 K (bottom structure). Clustering was performed on all trajectory structures with an atom-positional rmsd criterion of 0.1 nm for backbone atoms of the α-helix (residues 2–8) and of the PPII-helix (residues 17–19). The four largest (≥0.1 nm) NOE distance bound violations (NOE sequence numbers: 66, 118, 135, and 140) are denoted with dashed lines on both structures.
A number of computational research groups have taken up the challenge to reproduce the experimentally inferred folding properties of Trp-cage.13–21 Only a few studies17–19 present a comparison with the measured experimental NOE interactions in the form of atom–atom distance bounds to validate the simulated conformational ensemble. Different simulation techniques, such as stochastic dynamics,14 molecular dynamics,13,18–20 or replica-exchange molecular dynamics15,17,21 were applied. Various protein force fields such as AMBER,14,15,18,20,21 CHARMM,16 ECEPP,19 OPLS,17 or modifications of these13 were applied. The solvent, water, was either modeled as a continuum using simple electrostatics16,19 or with generalized-Born models13–15,18,20 or explicitly as separate degrees of freedom.17,21 Three studies15,17,21 use extensive temperature replica-exchange simulations (aggregated simulation times of 92 ns,15 250 ns,17 and 400 ns21 per molecule) to determine the melting temperature of TC5b in water. As far as can be inferred from the reported protein trajectory data, the denaturation temperatures are all rather high, 400 K,15 440 K,17 450 K,21 while the experimentally derived one lies at about 315 K. This indicates that the balance between the free energy of the folded versus unfolded parts of phase space is wrong using these force fields.5 This is not very surprising because the mentioned force fields were not thermodynamically calibrated. The first goal of our study is to investigate whether the GROMOS force field, which was thermodynamically calibrated,22–24 reproduces the experimental denaturation temperature of about 315 K for the Trp-cage miniprotein in water.
Recently, an experimental NMR study of urea-denatured Trp-cage was published.25 It used photo-CIDNP, to hyperpolarize Tyr and Trp protons and transfer nuclear magnetization via NOEs to neighboring atoms before refolding takes place induced by rapid homogeneous mixing of the solution. Contacts between aromatic hydrogens of the (central) Trp6 side chain and protons of the side chains of Ile4, Leu7, Pro12, and Arg16 were observed to be present in the urea-denatured state. The Trp6-Ile4 contact is not present in the folded state in aqueous solution and a urea-denatured state structure different from the folded one was proposed. The second goal of our study is to investigate whether the GROMOS force field, which includes a protein and water compatible urea model, is able to reproduce the experimental data regarding the denatured state.
We have performed simulations of TC5b in pure water at three different temperatures: 278, 360, and 400 K, and in 6M urea also at three different temperatures: 278, 298, and 360 K. We compare the MD trajectories to primary, that is, directly observable, experimental data such as distances derived from NOE's and proton crosspolarization, and not to secondary experimental data, that is, properties derived from primary experimental data, such as NMR model structures of the protein, because the latter may reflect more the force field and approximations used in the structure refinement than the values of the measured observable quantities.26 In this regard, we note that the NMR model structures for TC5b deposited in the protein data bank (code 1L2Y) were obtained using the refinement program CNS,27 the protocol described in Ref. 28, and AMBER force-field parameters.29
Results and Discussion
Structural analysis and estimation of the melting point
In Figure 2, the root-mean-square deviations (rmsd) of the six simulation trajectory structures from the starting (NMR model) structure of the TC5b in aqueous solution (upper panel) and in 6M urea solution (bottom panel) are displayed as a function of time. We chose to present only the rmsd values of the α-helical part (residues 2–8) because we connect the unfolding process primarily with loss of helicity in the α-helical part of the Trp-cage. The movement of the loop part is thus excluded. There is a difference in the stability of the structure of the α-helical region of TC5b between the water and urea simulations at 360 K (black dotted line in both panels). In water at 360 K, the α-helix of the TC5b stays longer in the folded state than in 6M urea solution. While the α-helix of the TC5b in 6M urea does not refold to the native state, in water it shows three refolding events within 20 ns of simulation after which it loses the α-helical fold completely. At 278 K neither simulation showed large deviations from the starting structure (black line in both panels). For TC5b in aqueous solution, we performed one simulation at 400 K (gray line in the upper panel) to test whether the GROMOS 45A3 force field would produce agreement with the experimental melting temperature of about 315 K, because published simulations based on other force fields could not reproduce it.15,17,21 The rapid increase in the rmsd value calculated for the trajectory structures of the simulation at 400 K proves that we are already well above the melting temperature of TC5b in the GROMOS force field. From our few and limited simulations, we cannot derive a precise value for the simulated melting temperature of TC5b, but we can estimate that it lies below 360 K which is 40 to 90 K lower than the melting temperatures reported or inferred from other simulations.15,17,21 Because in the presented rmsd analysis other structural features than the α-helical region of TC5b were not considered, we performed a distance analysis of the nine long-range NOE atom–atom distances of TC5b in aqueous solution of which five are long-range NOE distances which describe the Trp-cage structural motif (Fig. 3 and Supporting Information Fig. S1). The horizontal line in each panel of both figures corresponds to the NOE upper-bound distance in water at 298 K. The atom-pair distance analysis confirms our conclusion drawn from the rmsd analysis concerning the simulated melting temperature of TC5b.
Figure 2.
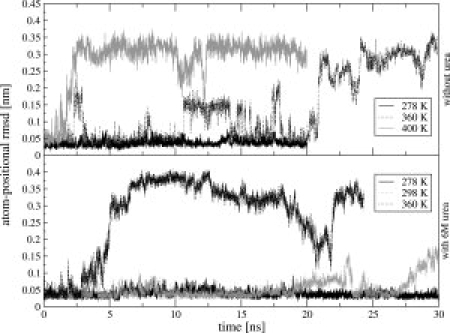
Backbone atom-positional root-mean-square difference (rmsd) (backbone atoms N, C, and Cα of residues 2–8) of MD trajectory structures of TC5b with respect to an energy minimized NMR model structure with lowest energy as a function of time for simulations without urea (upper panel) and simulations with 6M urea (bottom panel) simulated at 278 K (black solid line), at 298 K (gray dotted line), at 360 K (black dotted line), and at 400 K (gray solid line).
Figure 3.
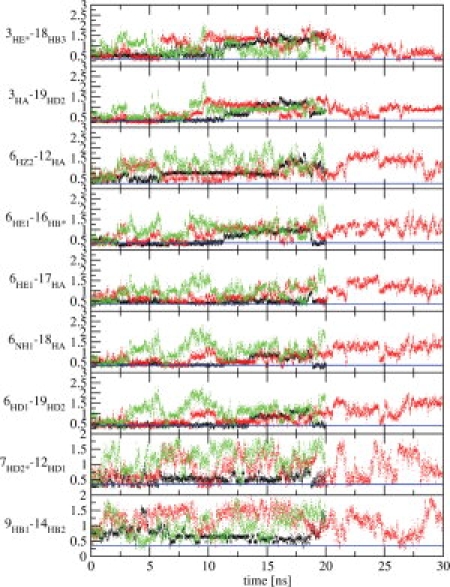
Time series of the nine long-range NOE atom–atom distances (in nm) of TC5b in water simulations. Black dots: simulation at 278 K; red dots: simulation at 360 K; green dots: simulation at 400 K. Horizontal lines represent the upper distance bounds derived from NMR NOE data in aqueous solution at 278 K.
The secondary structure assignment and the atom-positional root-mean-square fluctuations (rmsf's) calculated for all Cα atoms are presented in Figure 4 for the simulations at 278 and 360 K. The amounts of the secondary structure elements calculated for the trajectory structures of all performed simulations are presented in comparison to the values calculated for 38 structures from the set of NMR model structures derived using single-structure refinement techniques25 in Supporting Information Table S1. At 278 K the systems do not show a big loss of secondary structure. The non α-helical part of the molecule shows sizeable atomic fluctuations (right panels). At 360 K (second and bottom panels) the α-helix unfolds. In 6M urea it unfolds already within the first 4 ns and the folded structure does not recur within the simulated 24 ns, whereas in the aqueous simulation we observe several recurrences of the folded structure. As a consequence, at 360 K the 6M urea simulation shows more atomic fluctuation for the whole molecule than the water simulation. If we compare the secondary structure content calculated for the trajectory structures with the values calculated for the 38 structures from the set of NMR model structures (Supporting Information Table S1) we see that none of the simulations shows the short 310-helical part (residues 11–14) present in the NMR model structures. In Figure 1, the top picture represents the NMR model structure of TC5b,7 whereas the bottom picture represents the first conformational cluster of trajectory structures of the water simulation at 278 K. The absence of the 310-helical part in MD simulations was earlier reported by Zhou,17 whereas Paschek et al.21 found a mixture of 310 and α-helix like structures. We note that the primary NMR data, the NOE's, do not indicate 310 helical structure for residues 11–14. There is only one i to i+3 NOE distance bound involving these residues (see Supporting Information Table S2), NOE 136 between 12HA and 15 HN with a bound of 0.4 nm, which is satisfied in the MD simulations. Thus, the 310 helical part in the NMR model structures may be an artifact of the single-structure refinement procedure used. The atom-positional rms fluctuations and the varying degree of secondary structure conservation in the simulations indicate that the Trp-cage protein shows a larger structural mobility when solvated in 6M urea than in pure water.
Figure 4.
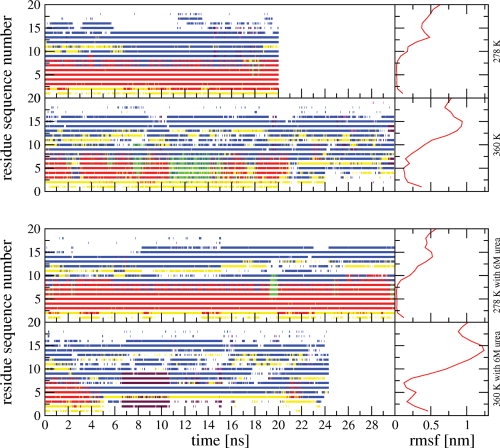
Secondary structure assignment (dssp) calculated according to Ref. 42 for TC5b simulated without urea (upper two left panels) and with 6M urea (bottom two left panels) at 278 K (upper panels) and at 360 K (lower panels). A black line represents a 310-helix, a red line an α-helix, a green line a π-helix, a blue line a bend, magenta a beta-bridge, maroon a beta-strand, and a yellow line a turn. Atom-positional root-mean-square fluctuations (rmsf's) of the Cα atoms of TC5b obtained using translational superposition of centers of mass and rotational fitting of only the backbone atoms of the α-helix calculated for the simulations without urea (upper two right panels) and with 6M urea (bottom two right panels).
Comparison to NMR data obtained in aqueous solution at 278 K
The ensembles of structures from all six performed simulations (three aqueous solution and three with 6M urea) were analyzed regarding the level of agreement with the NMR-derived data in terms of 168 NOE atom–atom distances obtained at 278 K in aqueous solution.7 The interproton distance bounds derived from experimentally measured NOE intensities are compared to the corresponding interproton distance averages ((〈r−6〉)−1/6) obtained from the simulations. In Figure 5 and Supporting Information Figure S2 the average effective violations of the upper-bound distances from all recorded structures in all six performed simulations are displayed. The upper-bound nature of NOE-derived distances implies that only violations with positive values are true violations. Of the 168 experimentally observed NOEs, 140 NOE's correspond to intraresidual, sequential, and intermediate-range (i / i+n, n ≤ 4) distances, while only 28 NOE distances are long-range NOEs (i / i+n, n ≥ 5). These comprise nine pairs of residues, see Figure 5 and Supporting Information Figure S2. The vertical dashed lines denote the range of nine long-range NOE residue pairs in the NOE sequence. For the simulations at 278 K, all experimentally observed NOEs are satisfied within 0.1 nm, the uncertainty assumed to be inherent to upper bound determination, except for four NOE distances (NOE 66, 118, 135, and 140) for the water simulation and two NOE distances (NOE 118 and 140) for the 6M urea simulation. NOE 66 (HZ2-HA) is one of the four long-range NOEs connecting residues Trp6 and Pro12. NOE 118 (HB1-HB2) is the only long-range NOE connecting residues Asp9 and Ser14. NOE 135 (HA-HN) connects residues 12 and 14 and NOE 140 (HA-HN) residues 13 and 15. The latter two are indicative of a helical conformation and the former two regard the positioning of residues 12 and 14 (of the 310-helical part of the NMR model structures) with respect to the α-helix (residues 2-8), see Figure 1. These violations are, with a maximum of 0.19 nm, rather small. Water simulations at higher temperatures, 360 and 400 K, result in more NOE distance-bound violations indicating increasing denaturation from 360 to 400 K. Increase of the long-range NOE distance violations characteristic for the Trp-cage motif (NOEs 6–12,16,17,18,19) confirms the loss of this characteristic structural element of Trp-cage miniproteins. The 6M urea simulations at 298 and 360 K did show a smaller increase in the NOE distance-bound violations compared to the aqueous solution simulations (Supporting Information Fig. S2). Yet the radius of gyration at both temperatures was higher than for the corresponding water simulations, see Figure 6. These two observations indicate that the size and the shape of TC5b in 6M urea is different, less native like, than in aqueous solution.
Figure 5.
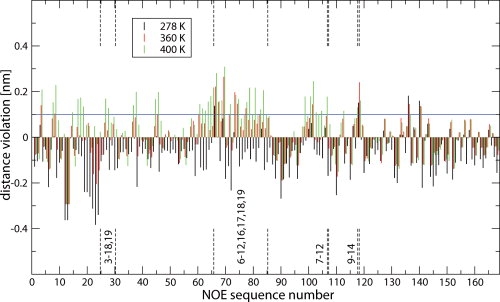
Averaged (r−6-averaging) distances minus the NMR NOE upper-bound (determined at 278 K) distances7 calculated over all recorded structures of simulations of TC5b in aqueous solution at 278 K (black bars), at 360 K (red bars), and 400 K (green bars). The long-range NOE's (i − i+n, n ≥ 5) are marked with vertical dashed lines. The corresponding values are presented in Supporting Information Table S2.
Figure 6.
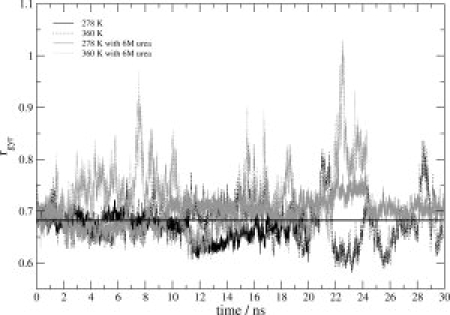
Radius of gyration (rgvr) of TC5b calculated using the backbone atoms (C, N, and Cα) as a function of time. Black solid and dotted lines correspond to the water simulations at 278 K and 360 K, respectively, and gray solid and gray dotted lines correspond to the 6M, urea simulations at 278 K and 360 K, respectively. The horizontal line represents the average rgvr calculated for all backbone atoms (C, N, and Cα) of the 38 NMR model structures representing the fold in aqueous solution at 278 K.
Comparison with NMR data obtained in 6M urea at 278 K
Recently, using photo-CIDNP experiments, eight proton–proton crosspolarization (contact) distances were detected in the unfolded state obtained by denaturation with 6M urea at 278 K.25 These contact distances involved contacts between Trp6 on the one hand and Ile4, Leu7, Pro12, and Arg16 on the other hand. All except one were shorter than the corresponding distances in the set of NMR model structures representing the compact native state. The hydrodynamic radius in the denatured state, obtained from diffusion NMR experiments, was slightly bigger than that of the native state (0.8 nm and 0.74 nm for urea-denatured and native states, respectively), but not as large as expected for a fully unfolded, random coil structure.25,30 The simulations at 278 K in aqueous solution and in 6M urea also show only a slight increase of the radius of gyration, calculated over all N, CA, and C backbone atoms, going from water, 0.67 nm, to 6M urea, 0.8 nm, see Figure 6. We note, however, that with 0.02 nm (water) and 0.01 nm (6M urea), the root-mean-square fluctuations of the radius of gyration at 278 K are sizable. To compare our six simulations with the reported proton–proton contact distances, we performed a distance analysis for the eight proton–proton pairs given in Table 1 of Ref. 25 shown in Supporting Information Figure S3 and Figure 7 for the water and 6M urea simulations, respectively. The distance bounds for the contacts between Trp6 and Leu7, Pro12 and Arg16 are satisfied in the 6M urea simulation at 278 K. The three bounds between Trp6 and Ile4 are not satisfied at low temperature, only occasionally at 360 K (Fig. 7). We note that the same observation holds for the water simulation (Supporting Information Fig. S3). This indicates that urea denaturation at lower temperatures is a slower process than temperature denaturation. In the native fold the side chain of Ile4 is oriented away from the Trp6 side chain resulting in a distance of about 0.8 nm and which is not within the NOE range of detection, whereas in the urea-denatured state the photo-CIDNP experiment showed that the Trp6-Ile4 distance, at 0.45 nm, is rather short. This seems to indicate that in the denatured state the α-helix is disrupted and that the N-terminal part of the molecule is closer to the center of the molecule (Trp side chain).
Figure 7.
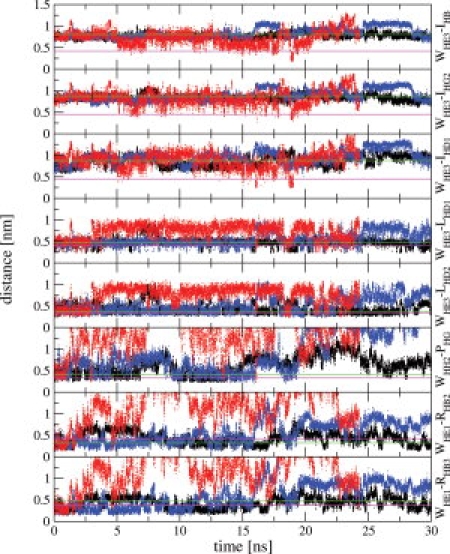
Distance analysis for the eight pairs of cross-polarized nuclei in TC5b (Trp6 to Ile4, Leu7, Prol12, and Argl6, Table 1 of Ref. 25 for the 6M urea simulations at different temperatures: black at 278 K, red at 360 K, and blue at 298 K. The green horizontal line in each panel corresponds to the specific distance assigned to the cross-polarized nuclei in the native state (i.e., taken from the set of NMR model structures in aqueous solution at 278 K,7 and the magenta horizontal line corresponds to the NOE contact distance between the cross-polarized nuclei in the 6M urea-denatured state of TC5b derived from photo-CIDNP experiments at 278 K.
Effect of urea on the protein structure and hydration
Although urea is a denaturant, we did not see large conformational differences between the urea and water simulations at 278 K and 360 K. The reason for this may reside with the mechanism of urea denaturation31 in which urea replaces water in the first solvation shell, shields the protein from water, and replaces the native hydrogen-bonding network, which is likely to be a slow process. In Figure 8, the radial distribution functions (rdf) for the water oxygens (OW) or for urea carbon atoms (CU) on the one hand and the side-chain atoms NE1 of Trp6, NE of Arg16, and CD of Ile4 on the other are presented. They were calculated for the first and the last 4.5 ns of the urea simulations at 278 K. During the simulation, urea is replacing water in the first solvation shell of those atoms. This is confirmed by comparing the average number of solute-water and solute-urea hydrogen bonds, 〈NHB〉, see Figure 9. A larger average number of protein-urea (NH-CO) hydrogen bonds than protein-water hydrogen bonds is observed for a number of residues.
Figure 8.
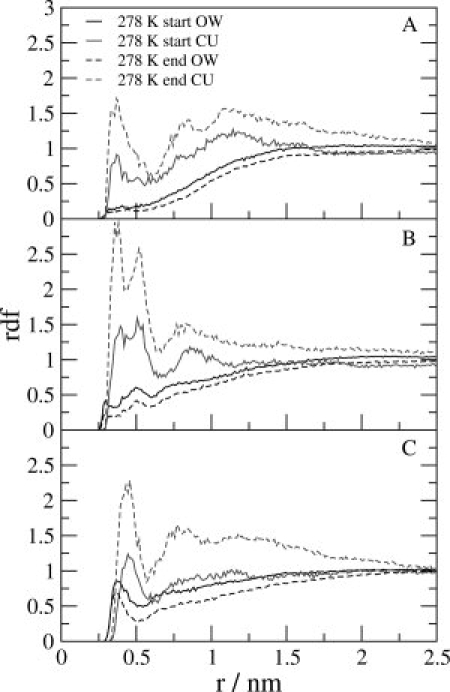
Radial distribution function (rdf) between the water oxygen atoms (OW) and urea carbon atoms (CU) on the one hand and the NE1 atom of Trp6, NE atom of Arg16, and CD atom of Ile4 on the other hand (panels A–C, respectively) for the 6M urea simulations at 278 K. The rdf was in all cases calculated for the first (full line) and last (dashed line) 4.5 ns of the simulation.
Figure 9.
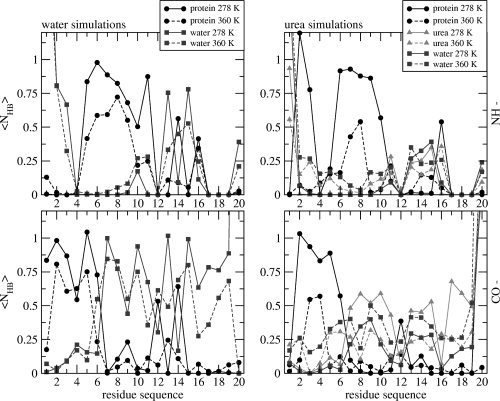
The average number of protein–protein (black), protein–water (gray), and protein–urea (light gray) hydrogen bonds (〈NHB〉) calculated for the protein backbone NH— donor group (upper panels) or backbone CO— acceptor group (bottom panels) of each residue of TC5b, for the water simulations (left two panels) and for the urea simulations (right two panels) at 278 K (solid lines) and 360 K (dashed lines).
Computational methods
Molecular Model
The simulations of the Trp-cage mini-protein (Fig. 1) were carried out in explicit-solvent using the GROMOS05 biomolecular simulation software32 and force field parameter set 45A3.23,33 The initial coordinates were taken from the NMR structure of TC5b (PDB entry: 1L2Y7). The simple-point-charge (SPC) water model34 was used to describe the solvent molecules. Aliphatic CHn groups were treated as united atoms.22 The protein was protonated at the N- and deprotonated at the C-terminus. All basic residues (Arg16 and Lys8) were protonated, whereas the acidic residue Asp9 was deprotonated, giving +1 e as the total charge of the investigated system. No counter-ions were used.
Simulation setup
The first structure from the set of NMR model structures was taken as the starting configuration for all simulations and it was placed at the center of a rectangular box enforcing a minimum distance of 2.0 nm between any protein atom and the closest box wall. The minimum distance was chosen such that upon unfolding of this tightly packed protein the periodic replicas will not interact with each other at any time in the simulations. This box was filled with water molecules such that the distance between (nonhydrogen) solvent and solute atoms was bigger than 0.23 nm. The resulting number of water solvent molecules was 8632. To relax the system before starting the MD simulations, a steepest descent energy minimization was performed. The 6M urea-water mixture was composed of 970 urea and 6415 water molecules in a cubic box with periodic boundary conditions. The force-field parameters for urea were taken from a 53A6 force field urea model35 implemented in the used 45A3 force field. After an initial equilibration period of 300 ps the simulations were continued for 20–30 ns. The analyses were based on configurations saved every 5 ps. Simulations of the aqueous and urea systems were performed at 278 K (the temperature of the experiment) and 360 K (to test its instability). Two additional simulations were performed, one for the aqueous system at 400 K (to test the instability at a higher temperature) and one for the urea system at 298 K (to test the stability at room temperature). Solute and water temperatures were maintained independently by weak coupling to two temperature baths with relaxation times of 0.1 ps.36 The pressure was calculated using a molecular virial and maintained by weak coupling to a pressure bath (isotropic coordinate scaling) with a relaxation time of 0.5 ps, using an isothermal compressibility of 4.575 × 10⁻⁴ (kJ mol−1 nm−3)−1. Bond lengths were constrained by application of the SHAKE algorithm37 with a relative geometric tolerance of 10−4. The equations of motion were integrated using the leap-frog algorithm based on a timestep of 2 fs. Long-range interactions were handled using a triple-range cutoff scheme33,38 with cutoff radii of 0.8 nm (interactions updated every timestep) and 1.4 nm (interactions updated every five timesteps). The mean effect of omitted electrostatic interactions beyond the long-range cutoff distance (1.4 nm) was accounted for by the inclusion of a Barker-Watts reaction-field force39,40 based on a permittivity of 61 for water.41
Analysis
The atom-positional root-mean-square deviations (rmsd) from the energy-minimized NMR structure were evaluated based on all backbone atoms (N, Cα, and C) of all residues.
The secondary structure assignment was done using the program dssp, based on the Kabsch-Sander rules.42
Interproton distance bounds derived from the NOE crosspeak intensities at 278 K for TC5b in aqueous solution were compared to the corresponding average effective interproton distances in the simulations, 〈r−6〉−1/6, as appropriate for small rapidly tumbling molecules.43,44 168 NOE upper bounds were available from the pdb data bank (PDB code 1L2Y7 containing 169 NOE upper bound distances of which NOE 41 and 42 were identical so only one was retained) and were used for the NOE interproton distance analysis.
The eight NOE contact distances of the urea-denatured state of (6M urea, 278 K) TC5b, which were obtained from photo-CIDNP experiments,25 were calculated from the trajectory structures using aliphatic hydrogen atoms corresponding virtual (CH1) or prochiral (stereospecific CH2) atomic positions.33,38
A conformational clustering analysis, performed as described in previous studies,45 was carried out on the trajectory structures of the TC5b using 1 to 1.5 × 10⁵ trajectory structures. An atom-positional rmsd similarity criterion of 0.1 nm for atoms N, C, and Cα of the TC5b (all residues) was used as previously described in Ref. 45. For each trajectory structure, the number of structures that are similar to it are determined. The structure with the largest number of structural neighbors is taken as the central member of the first cluster, and structures similar to it are then no longer considered. This process is repeated until all structures are assigned to a cluster.
Conclusion
The MD simulations of TC5b in aqueous solution at three different temperatures show that its melting temperature with the GROMOS 45A3 force field is lower than 360 K, which is much closer to the experimental value of about 315 K than the values of 400–450 K reported for other much used force fields. The NMR NOE analysis of atom–atom distances for the trajectory structures of TC5b in water shows that the proton–proton distances as inferred from experiment are largely satisfied in the simulations at 278 K. At 360 K and at 400 K, the onset of unfolding is observed even on the simulated time scale of tens of nanoseconds. Through photo-CIDNP experiments it had previously been shown experimentally25 that a close, 0.4 nm, Trp6-Ile4 proton–proton contact exists in the 6M urea-denatured state, which is not observed for the native state. At 278 K, the simulation in 6M urea starting from the native structure did not reproduce this contact. At 360 K, it was however observed. This illustrates that in computer simulation denaturation is more quickly achieved by raising the temperature than by adding a denaturant such as urea. This can be explained by the time required for the urea molecules to replace water molecules at the surface of the protein.
In the 6M urea simulation, the radius of gyration calculated (0.8 nm) is slightly larger than in the water simulation (0.7 nm) in agreement with experimental observations. However, the eight side-chain side-chain interactions observed with photo-CIDNP experiments for the urea-denatured state are too low in number to derive a dominant conformation for the TC5b protein in 6M urea. We note, however, that the structures simulated by temperature denaturation of the native structure do show the eight side-chain side-chain interactions observed experimentally for the urea-denatured state.
References
- 1.Moult J, Fidelis K, Zemla A, Hubbard T. Critical assessment of methods of protein structure prediction (CASP): round IV. Proteins. 2001;45:2–7. [PubMed] [Google Scholar]
- 2.Moult J, Fidelis K, Kryshtafovych A, Rost B, Hubbard T, Tramontano A. Critical assessment of methods of protein structure prediction-round VII. Proteins. 2007;69:3–9. doi: 10.1002/prot.21767. [DOI] [PMC free article] [PubMed] [Google Scholar]
- 3.Ulmschneider JP, Jorgensen WL. Polypeptide folding using Monte Carlo sampling, concerted rotation and continuum solvation. J Am Chem Soc. 2004;126:1849–1857. doi: 10.1021/ja0378862. [DOI] [PubMed] [Google Scholar]
- 4.Shakhnovich E. Protein folding thermodynamics and dynamics: where physics, chemistry and biology meet. Chem Rev. 2006;106:1559–1588. doi: 10.1021/cr040425u. [DOI] [PMC free article] [PubMed] [Google Scholar]
- 5.van Gunsteren WF, Bürgi R, Peter C, Daura X. The key to solving the protein-folding problem lies in an accurate description of the denatured state. Angew Chem Int Ed. 2001;40:351–355. doi: 10.1002/1521-3773(20010119)40:2<351::AID-ANIE351>3.0.CO;2-6. [DOI] [PubMed] [Google Scholar]
- 6.van Gunsteren WF, Gattin Z. Simulation of folding equilibria. In: Hecht S, Huc I, editors. Foldamers: structure, properties and applications. Weinheim, Germany: Wiley; 2007. pp. 173–192. [Google Scholar]
- 7.Neidigh JW, Fesinmeyer RM, Andersen NH. Designing a 20-residue protein. Nat Struct Biol. 2002;9:425–430. doi: 10.1038/nsb798. [DOI] [PubMed] [Google Scholar]
- 8.Iavarone AT, Parks JH. Conformational change in unsolvated Trp-cage protein probed by fluorescence. J Am Chem Soc. 2005;127:8606–8607. doi: 10.1021/ja051788u. [DOI] [PubMed] [Google Scholar]
- 9.Ahmed Z, Beta IA, Mikhonin AV, Asher SA. UV-resonance Raman thermal unfolding study of Trp-cage shows that it is not a simple two-state miniprotein. J Am Chem Soc. 2005;127:10943–10950. doi: 10.1021/ja050664e. [DOI] [PubMed] [Google Scholar]
- 10.Neuweiler H, Doose S, Sauer M. A microscopic view of miniprotein folding: enhanced folding efficiency through formation of an intermediate. Proc Natl Acad Sci USA. 2005;102:16650–16655. doi: 10.1073/pnas.0507351102. [DOI] [PMC free article] [PubMed] [Google Scholar]
- 11.Qiu L, Pabit SA, Roitberg AE, Hagen SJ. Smaller and faster: the 20-residue Trp-cage protein folds in 4 μs. J Am Chem Soc. 2002;124:12952–12953. doi: 10.1021/ja0279141. [DOI] [PubMed] [Google Scholar]
- 12.Qiu L, Hagen SJ. A limiting speed for protein folding at low solvent viscosity. J Am Chem Soc. 2004;126:3398–3399. doi: 10.1021/ja049966r. [DOI] [PubMed] [Google Scholar]
- 13.Simmerling C, Strockbine B, Roitberg AE. All-atom structure prediction and folding simulations of a stable protein. J Am Chem Soc. 2002;124:11258–11259. doi: 10.1021/ja0273851. [DOI] [PubMed] [Google Scholar]
- 14.Snow CD, Zagrovic B, Pande VS. The Trp-cage: folding kinetics and unfolded state topology via molecular dynamics simulations. J Am Chem Soc. 2002;124:14548–14549. doi: 10.1021/ja028604l. [DOI] [PubMed] [Google Scholar]
- 15.Pitera JW, Swope W. Understanding folding and design: replica exchange simulations of Trp-cage miniproteins. Proc Natl Acad Sci USA. 2003;100:7587–7592. doi: 10.1073/pnas.1330954100. [DOI] [PMC free article] [PubMed] [Google Scholar]
- 16.Rao F, Caflisch A. Replica exchange molecular dynamics simulations of reversible folding. J Chem Phys. 2003;119:4035–4042. doi: 10.1063/1.1809588. [DOI] [PubMed] [Google Scholar]
- 17.Zhou R. Trp-cage: folding free energy landscape in explicit water. Proc Natl Acad Sci USA. 2003;100:13280–13285. doi: 10.1073/pnas.2233312100. [DOI] [PMC free article] [PubMed] [Google Scholar]
- 18.Chowdhury S, Lee MC, Xiong G, Duan Y. Ab initio folding simulation of the Trp-cage mini-protein approaches NMR resolution. J Mol Biol. 2003;327:711–717. doi: 10.1016/s0022-2836(03)00177-3. [DOI] [PubMed] [Google Scholar]
- 19.Nikiforovich GV, Andersen NH, Fesinmeyer RM, Frieden C. Possible locally driven folding pathways of TC5b, a 20-residue protein. Proteins. 2003;52:292–302. doi: 10.1002/prot.10409. [DOI] [PubMed] [Google Scholar]
- 20.Chowdhury S, Lee MC, Duan Y. Characterizing the rate-limiting step of Trp-cage folding by all-atom molecular dynamics simulations. J Phys Chem B. 2004;108:13855–13865. [Google Scholar]
- 21.Paschek D, Nymeyer H, Garca AE. Replica exchange simulation of reversible folding/unfolding of the Trp-cage miniprotein in explicit solvent: on the structure and possible role of internal water. J Struct Biol. 2007;157:524–533. doi: 10.1016/j.jsb.2006.10.031. [DOI] [PubMed] [Google Scholar]
- 22.Daura X, Mark AE, van Gunsteren WF. Parametrization of aliphatic CHn united atoms of GROMOS96 force field. J Comput Chem. 1998;19:535–547. [Google Scholar]
- 23.Schuler LD, Daura X, van Gunsteren WF. An improved GROMOS96 force field for aliphatic hydrocarbons in the condense phase. J Comput Chem. 2001;22:1205–1218. [Google Scholar]
- 24.Oostenbrink C, Villa A, Mark AE, van Gunsteren WF. A biomolecular force field based on the free enthalpy of hydration and solvation: the GROMOS force-field parameter sets 53A5 and 53A6. J Comput Chem. 2004;25:1656–1676. doi: 10.1002/jcc.20090. [DOI] [PubMed] [Google Scholar]
- 25.Mok KH, Kuhn LT, Goez M, Day IJ, Lin JC, Andersen NH, Hore PJ. A pre-existing hydrophobic collapse in the unfolded state of an ultrafast folding protein. Nature. 2007;447:106–109. doi: 10.1038/nature05728. [DOI] [PMC free article] [PubMed] [Google Scholar]
- 26.van Gunsteren WF, Dolenc J, Mark AE. Molecular simulation as an aid to experimentalists. Curr Opin Struct Biol. 2008;18:149–153. doi: 10.1016/j.sbi.2007.12.007. [DOI] [PubMed] [Google Scholar]
- 27.Brünger AT, Adams PD, Clore GM, DeLano WL, Gros P, Grosse-Kunstleve RW, Jiang J-S, Kuszewski J, Nilges M, Pannu NS, Read RJ, Rice LM, Simonson T, Warren GL. Crystallography & NMR system: a new software suite for macromolecular structure determination. Acta Cryst D. 1998;54:905–921. doi: 10.1107/s0907444998003254. [DOI] [PubMed] [Google Scholar]
- 28.Neidigh JW, Fesinmeyer RM, Prickett KS, Andersen NH. Exendin-4 and glucagon-like-peptide-1: NMR structural comparisons in the solution and micelle-associated states. Biochemistry. 2001;40:13188–13200. doi: 10.1021/bi010902s. [DOI] [PubMed] [Google Scholar]
- 29.Cornell WD, Cieplak P, Bayly CI, Gould IR, Merz KM, Ferguson DM, Spellmeyer DC, Fox T, Caldwell JW, Kollman PA. A second generation force field for the simulation of proteins, nucleic acids, and organic molecules. J Am Chem Soc. 1995;117:5179–5197. [Google Scholar]
- 30.Kohn JE, Millett IS, Jacob J, Zagrovic B, Dillon TM, Cingel N, Dothager RS, Seifert S, Thiyagarajan P, Sosnick TR, Zahid Hasan M, Pande VS, Ruczinski I, Doniach S, Plaxco KW. Random-coil behavior and the dimensions of chemically unfolded proteins. Proc Natl Acad Sci USA. 2003;101:12491–12496. doi: 10.1073/pnas.0403643101. [DOI] [PMC free article] [PubMed] [Google Scholar]
- 31.Caballero-Herrera A, Nordstrand K, Berndt KD, Nilsson L. Effect of urea on peptide conformation in water: molecular dynamics and experimental characterization. Biophys J. 2005;89:842–857. doi: 10.1529/biophysj.105.061978. [DOI] [PMC free article] [PubMed] [Google Scholar]
- 32.Christen M, Hünenberger PH, Bakowies D, Baron R, Bürgi R, Geerke DP, Heinz TN, Kastenholz MA, Kräutler V, Oostenbrink C, Peter C, Trzesniak D, van Gunsteren WF. The GROMOS software for biomolecular simulation: GROMOS05. J Comput Chem. 2005;26:1719–1751. doi: 10.1002/jcc.20303. [DOI] [PubMed] [Google Scholar]
- 33.van Gunsteren WF, Billeter SR, Eising AA, Hünenberger PH, Krüger P, Mark AE, Scott WRP, Tironi IG. Biomolecular simulation: the GROMOS96 manual and user guide. Zürich: Verlag der Fachvereine; 1996. [Google Scholar]
- 34.Berendsen HJC, Postma JPM, van Gunsteren WF, Hermans J. Interaction models for water in relation to protein hydration. In: Pullman B, editor. Intermolecular forces. Dordrecht: Reidel; 1981. pp. 331–342. [Google Scholar]
- 35.Smith LJ, Berendsen HJC, van Gunsteren WF. Computer simulation of urea-water mixtures: a test of force field parameters for use in biomolecular simulation. J Phys Chem B. 2004;108:1065–1071. [Google Scholar]
- 36.Berendsen HJC, Postma JPM, van Gunsteren WF, DiNola A, Haak JR. Molecular dynamics with coupling to an external bath. J Chem Phys. 1984;81:3684–3690. [Google Scholar]
- 37.Ryckaert JP, Ciccotti G, Berendsen HJC. Numerical integration of the cartesian equations of motion of a system with constraints: molecular dynamics of n-alkanes. J Comput Phys. 1977;23:327–341. [Google Scholar]
- 38.Scott WRP, Hünenberger P, Tironi IG, Mark AE, Billeter SR, Fennen J, Torda AE, Huber T, Krüger p, van Gunsteren WF. The GROMOS biomolecular simulation program package. J Phys Chem A. 1999;103:3596–3607. [Google Scholar]
- 39.Barker JA, Watts RO. Monte Carlo studies of the dielectric properties of water-like models. Mol Phys. 1973;26:789–792. [Google Scholar]
- 40.Tironi IG, Sperb R, Smith PE, van Gunsteren WF. A generalized reaction field method for molecular dynamics simulations. J Chem Phys. 1995;102:5451–5459. [Google Scholar]
- 41.Heinz TN, van Gunsteren WF, Hünenberger PH. Comparison of four methods to compute the dielectric permittivity of liquids from molecular dynamics simulations. J Chem Phys. 2001;115:1125–1136. [Google Scholar]
- 42.Kabsch W, Sander C. Dictionary of protein secondary structure-pattern-recognition of hydrogen-bonded and geometrical features. Biopolymers. 1983;22:2577–2637. doi: 10.1002/bip.360221211. [DOI] [PubMed] [Google Scholar]
- 43.Tropp J. Dipolar relaxation and nuclear Overhauser effects in nonrigid molecules: the effect of fluctuating internuclear distances. J Chem Phys. 1980;72:6035–6043. [Google Scholar]
- 44.Daura X, Antes I, van Gunsteren WF, Thiel W, Mark AE. The effect of motional averaging on the calculation of NMR-derived structural properties. Proteins. 1999;36:542–555. [PubMed] [Google Scholar]
- 45.Daura X, van Gunsteren WF, Mark AE. Folding-unfolding thermodynamics of a β-heptapeptide from equilibrium simulations. Proteins. 1999;34:269–280. doi: 10.1002/(sici)1097-0134(19990215)34:3<269::aid-prot1>3.0.co;2-3. [DOI] [PubMed] [Google Scholar]


