Abstract
Purpose: For dosimetry and for work in optimization of x-ray imaging of the breast, it is commonly assumed that the breast is composed of 50% fibroglandular tissue and 50% fat. The purpose of this study was to assess whether this assumption was realistic.
Methods: First, data obtained from an experimental breast CT scanner were used to validate an algorithm that measures breast density from digitized film mammograms. Density results obtained from a total of 2831 women, including 191 women receiving CT and from mammograms of 2640 women from three other groups, were then used to estimate breast compositions.
Results: Mean compositions, expressed as percent fibroglandular tissue (including the skin), varied from 13.7% to 25.6% among the groups with an overall mean of 19.3%. The mean compressed breast thickness for the mammograms was 5.9 cm (σ=1.6 cm). 80% of the women in our study had volumetric breast density less than 27% and 95% were below 45%.
Conclusions: Based on the results obtained from the four groups of women in our study, the “50-50” breast is not a representative model of the breast composition.
Keywords: mammography, dosimetry, breast composition, breast density, mean glandular dose, breast CT
INTRODUCTION
Tissues in the breast are distributed in three dimensions (3D). In mammography, the x-ray attenuation patterns of the breast are projected into a two-dimensional (2D) image. This causes a distortion in the perception of the relative distribution of fat and fibroglandular tissue. There is considerable interest in this distribution for at least three reasons: (1) Increased mammographic density (loosely defined as the fraction of the breast that is composed of fibroglandular tissue) is associated with reduced diagnostic accuracy in mammography1, 2, 3 and is now being used as an indicator of the difficulty of interpretation of a mammogram by the radiologist. In fact, radiologists are encouraged to communicate this indicator to the referring physician, for example, using the BIRADS density categories.4 (2) Mammographic density has also been established as a predictor of the risk of future breast cancer5, 6, 7 and is being incorporated into risk assessment models. Various quantitative measures of breast density, based either on 2D analysis5, 6, 8, 9, 10 or 3D analysis,11, 12, 13, 14, 15 have been introduced. (3) Because of its dual role as a risk predictor and its association with a reduction in sensitivity of mammography, mammographic density is likely to be used for stratifying women into different screening regimens according to density. Assumptions of the composition and distribution of tissue components in the breast also underlie the dosimetry models that are used to compute doses received by the breast from x-ray exposure, particularly in mammography procedures.
Compression of the breast and the nature of 2D projection mammography frequently cause the fibroglandular structure in the breast to be distributed over much of the extent of the mammograms. Two-dimensional density analysis methods5, 6, 7, 9 integrate the signal from these thin layers of fibroglandular tissue, causing the apparent density of fibroglandular tissue to be overestimated. At the same time, the tissue along each x-ray path is superposed onto the image and treated in a simple binary manner (i.e., dense or not dense), so it is difficult to assess the amount of dense tissue in the third dimension. Although the second effect would lead to underestimation of density, it is generally the first that tends to dominate so that breast density, as quantified in a 2D manner, is generally overestimated compared to its true proportion by volume. As a result, the medical physics community involved in breast imaging has come to view the “typical” breast as one which is composed of 50% “glandular” tissue and 50% adipose tissue, often referred to as the “50-50” breast. It has been suggested that this model be employed in dosimetry estimates16, 17, 18 and in optimization of imaging systems.19 It has also been specified by regulatory agencies as part of their dosimetry protocol in mammography quality assurance.20, 21
The advent of 3D tomographic systems for breast imaging,22, 23, 24, 25 along with well-calibrated volumetric breast density analysis techniques from 2D mammograms,11, 12, 13 allows a unique opportunity to reassess the fraction of fibroglandular tissue in the breast. The implications of this are extremely important because the fibroglandular tissue is presumed to be the component that is most sensitive to the weakly carcinogenic effects of x rays. The fraction and spatial distribution of fibroglandular tissue has a significant influence on the assessment of radiation dose in the breast from mammography and other breast imaging technologies which use x rays.
Accurate 3D data on tissue distribution in the form of breast CT images are now valuable for assessing the tools that have been developed to quantify mammographic density for use as a risk factor. Such data provide the ground truth for validating both 2D and 3D density measurement techniques and for comparing differences in their performance.
METHODS
Breast CT fibroglandular volumetric assessment
Two prototype breast CT scanners were developed at UC Davis and these breast CT scanners are being studied in a clinical trial.22, 25 The scanners were designed to image the breast using a series of 500 cone beam projection images acquired at 80 kVp, with the radiation dose adjusted to be equal to that of two-view mammography. The reconstruction results in a volume dataset comprising 512×512×N voxels, where N typically runs between 300 and 512, depending on the size of the breast.
The left breast dataset for 191 patients imaged on these CT systems was used to evaluate the volume breast density (VBD) in this study. The left breast image datasets were selected arbitrarily, and only one breast dataset was used from each woman to maintain independence in the results. The breast CT image data were segmented and the image regions were assigned as follows: Air=0, skin=1, adipose tissue=2, and fibroglandular tissue=3.
First, segmentation of the breast from the surrounding air background was performed using a histogram-based, two-means clustering algorithm26 to estimate the intensity threshold between air and the breast. A connected-component algorithm27 was then used to determine the largest connected region of air. Holes in this region were filled in and were marked as air. Then, a seven-point 3D median filter was applied multiple times to separate the intensity of more attenuating tissues such as fibroglandular tissue, chest wall, and skin from that of the less attenuating adipose tissue. After each application of the median filter, the histogram-based, two-means clustering algorithm was used to segment the image volume. Median filtering stopped when the segmentation converged. The connected-component algorithm was then used to select and mark the largest connected region of adipose tissue. Finally, the skin was identified by region growing and morphological analysis. The images of segmented tissue types (0, 1, 2, 3) were then used to identify voxels from the original CT images as either adipose (2) or fibroglandular (3). For each volume dataset, the mean and standard deviation of adipose attenuation (μa,σa) in Hounsfield units (HU) and fibroglandular attenuation (μg,σg) were calculated so as to evaluate the reliability of the segmentation. Over all volume datasets, the median difference of μg−μa was found to be 130 HU and the median standard deviations for adipose and fibroglandular tissues were found to be σa=48 HU and σg=55 HU. These values are consistent with the expected standard deviation due to quantum noise of about 50 HU, suggesting that the segmentation is quantum noise limited.
For each of the 191 cases, start and end coronal slices were marked for use in the density calculation. The start slice was determined visually by the first slice that did not contain pectoralis muscle and also had no artifacts. The last slice was selected as the last slice that contained no artifacts and excluded the nipple.
Fibroglandular density without inclusion of skin was then calculated for each breast volume within the defined region of the segmentation volume image by
| (1) |
where Vfg is the volume of fibroglandular tissue, Vad is the volume of adipose tissue, and Vsk is the volume of skin. In addition, the density including skin was calculated from
| (2) |
Mammography fibroglandular volume assessment
As part of a separate research effort attempting to relate etiology of breast cancer to various genetic and environmental factors through correlation with breast density, mammographic density was measured on three groups of Canadian women. The measurements were made using an algorithm called Cumulus V, developed by researchers at Sunnybrook and based on a volumetric technique described by Pawluczyk et al.11 A two-dimensional “staircase” phantom consisting of a range of thicknesses (0–8 cm) of combinations of breast tissue equivalent plastics representing a range of adipose∕fibroglandular compositions (0:100–100:0) was imaged on each film mammography unit. The image and the sensitometric characteristics of the imaging system were used to create a calibration surface, relating the thickness of the material and its composition to the logarithm of the measured x-ray fluence. Surfaces were created for all target-filter materials and exposure conditions. It was necessary to apply a correction to compensate for the differences between the x-ray attenuation coefficients of actual breast adipose and fibroglandular tissue and those of the calibration materials.28
From each mammogram, the appropriate calibration surface was chosen, and for each pixel in the digitized image, the recorded fluence was determined. Then for a given breast thickness at that point, the volume of fibroglandular tissue within that column of tissue could be inferred. The estimate of composition was then obtained by integration over the entire breast and dividing by the volume of the breast. The thickness of the breast corresponding to each image pixel was estimated from the measured compression thickness and force for each mammogram using the method of Mawdsley and co-workers.29, 30
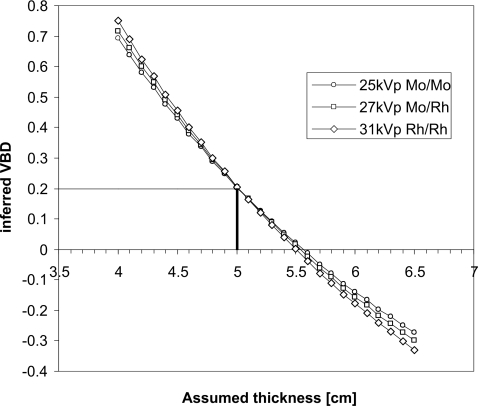
One important challenge in estimating volumetric breast density from mammography is the sensitivity of the calculated density to accurate knowledge of the breast thickness. Figure 1 illustrates the results of a polyenergetic model of x-ray attenuation of breast tissue. As an example, if a breast that is actually 50 mm thick and 20% fibroglandular in composition is imaged at 25 kV with a Mo∕Mo target∕filter combination and the compressed breast thickness is inappropriately assumed to be 45 mm, the VBD will be interpreted as being 43%.
Figure 1.
Dependence of the inferred volumetric density from a mammogram on accurate knowledge of breast thickness. In this example, the breast is actually 50 mm thick with composition 20% fibroglandular tissue. Results are calculated for 25 kV Mo∕Mo, 27 kV Mo∕Rh, and 31 kV Rh∕Rh beams.
To mitigate against the error introduced into the density determination due to small errors in thickness, we applied a constraint of physical reality, i.e., that the densities had to be between 0% and 100%. This was done using an iterative method. First, the amount of dense tissue corresponding to each pixel in the image was determined. Then, the equivalent attenuation due to the upper and lower skin surfaces was removed from the calculation by assuming that each layer was 1.5 mm thick31 and that the attenuation coefficient of skin was 3% higher than that of the fibroglandular tissue.17 If, for a representative central area, the estimated density with no skin was less than 0% or greater than 100%, then the thickness calculated in the method of Mawdsley et al.30 was reduced or increased, respectively, by an increment of 1 mm and the density was recalculated. This process was repeated until the density fell within the 0%–100% range and the resultant modified base thickness was used in the calculation of VBD over the breast to derive a value without skin [Eq. 1]. The skin attenuation was then reinserted and the VBD with skin was also calculated according to Eq. 2.
Comparison of volumetric density measurement methods
The mammographic volumetric density measurement technique was performed on a set of images from 26 women by simulating 2D mammograms from their 3D CT dataset. From the segmentation described above, a simulation of mechanical compression of the tissue as would occur during a craniocaudal mammographic examination was performed using a finite element method developed by Brock and co-workers.32, 33 Based on the tissue types, linear attenuation coefficients corresponding to particular energies in a mammographic spectrum were assigned to the tissue types in each voxel of the simulated compressed breast by interpolation of the data of Johns and Yaffe34 for fibroglandular tissue and fat and of Hammerstein17 for skin. A ray projection algorithm was then used to simulate a 2D mammogram from the voxel data for a typical mammographic spectrum. The staircase phantom was also subjected to this process (without compression). The volumetric density algorithm was then applied to this “mammogram” and the results were compared to the original CT data. This was done for two cases: Where the effect of the skin on density was removed in both methods [Eq. 1] and where it was included [Eq. 2].
Analysis of volumetric data
Volumetric breast densities were analyzed for 191 women who received breast CT exams at UC Davis (group A) as well as three groups of healthy Canadian women whose mammographic densities were obtained in the course of their participation in epidemiological studies. Group B consisted of 515 Chinese and 514 Caucasian women with a mean age of 60.9 yr. Group C was a case-control study of 1020 women between the age of 40 and 85 yr. Group D was composed of 591 mainly Caucasian postmenopausal women, 50–74 yr of age participating in an aerobic exercise program, which was being investigated as a possible risk-reducing intervention. None of these women had been diagnosed with breast cancer at the time that their mammograms were obtained; however, half of the women in group C would subsequently be diagnosed with breast cancer, and for these women, densities were measured in the contralateral breast.
RESULTS
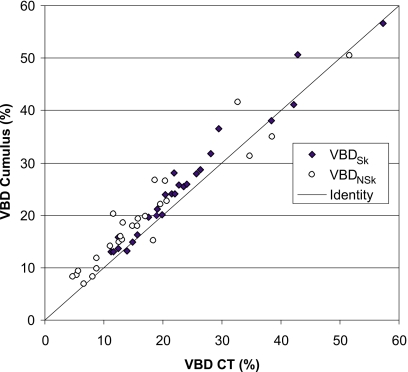
Figure 2 compares volumetric densities obtained by applying Cumulus V to the simulated mammograms produced from the transformed CT dataset to VBD measured directly from the segmented CT data. The attenuation due to skin is generally included in the assessment of volumetric density from mammograms. Therefore, for the purpose of this comparison, the contribution of skin in the CT data was included (black diamonds in the figure). For this experiment only, where the compression was simulated, the thickness of the breast corresponding to every point in the mammogram was known exactly and this thickness information was used in the Cumulus algorithm.
Figure 2.
Comparison of volumetric breast density measured using Cumulus algorithm from simulated mammograms obtained from breast CTs of 26 volunteers versus direct results from CT. Results are shown both for the case of the skin being included (black diamonds) and omitted (open circles) from the calculation. The line of identity is also indicated.
The slope of the linear regression line between the VBD as determined by Cumulus V and by CT (skin included) was 1.008 with an intercept of 1.9 in units of %VBD and the mean difference between measurement methods was 2.1 in %VBD (95% CI: 1.3–3.0), indicating excellent agreement between the methods.
The comparison with the skin excluded was also performed by segmenting the skin on the CT images and assuming a skin thickness of 1.5 mm (for each layer) in Cumulus. Results are given in Fig. 2 (open circles). For this fit, the slope of the linear regression was 0.91 and the intercept was 4.1 in %VBD.
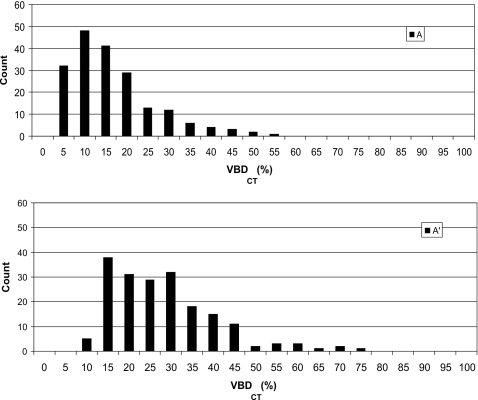
Table 1 summarizes the four groups of women for whom volumetric density data were available and provides information on the mean total breast volumes and volumetric densities for the groups. Figure 3 illustrates the distribution of VBD (expressed as percentage) in group A as determined from breast CT datasets for conditions where the skin is excluded from the calculation and where it is included. The mean VBD was found to be 14.3% (by volume) with a standard deviation of 10.3% with skin excluded and 25.6% with a standard deviation of 12.6% with skin included [Eq. 2]. The mean breast diameter in this dataset (near the chest wall), in which the breast is not compressed but is imaged unrestrained in the pendant position, was computed as 134 mm (σ=21 mm).
Table 1.
Characteristics of the four groups for whom density was measured. For each group the mean and standard deviation ( ) of VBD are given both for the “skin-included” and “skin-excluded” conditions. The difference between these means, the mean compressed breast thickness and the mean total breast volumes are also given.
| Group | N | Mean age (Range) | Mean breast volume (cm3) | VBDSk (%) (σ) | VBDNSk (%) (σ) | ΔVBD (%) | Mean compressed thickness (mm) (σ) |
|---|---|---|---|---|---|---|---|
| A | 191 | 53.8 (35–82) | 769 | 25.6 (12.6) | 14.3(10.3) | 11.3 | N∕A |
| B | 1029 | N∕A | 512 | 21.7 (12.8) | 16.8(11.5) | 4.9 | 56(19) |
| C | 1020 | 59.2 (40–85) | 720 | 18.9 (12.3) | 14.2(11.1) | 4.7 | 57(14) |
| D | 591 | 61.4 (50–76) | 755 | 13.7 (7.5) | 9.9(6.7) | 3.8 | 65(11) |
| All groups | 2831 | 19.3 (12.1) | 14.3(10.7) | 5.0 |
Figure 3.
Distribution of breast densities in women (N=191) imaged with dedicated breast CT. Data were acquired and analyzed at University of California, Davis. Upper and lower graphs give skin-excluded and skin-included distributions.
For the 2640 film mammograms analyzed by Cumulus, a correction in the inferred breast thickness was required in 1139 cases, and when this occurred, the breast thickness was shifted to lower values by, on average, 4.7 mm with a standard deviation of 3.8 mm.
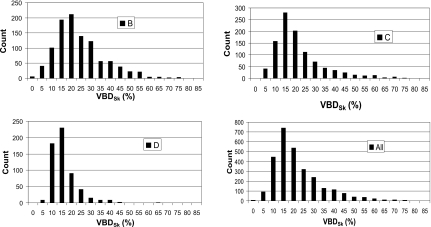
Figures 4a, 4b, 4c give histograms of the VBDSk for the three groups of Canadian women based on estimates derived from analysis of their digitized film mammograms using Cumulus V. The distribution for the four combined datasets is given in Fig. 4d. Table 1 gives the VBD values for the four datasets for the “skin” and “no-skin” conditions as well as the mean differences between these values. Also given are the mean age, breast volume, and compression thickness (for the mammograms).
Figure 4.
Volumetric breast densities [(a)–(c)] measured from mammograms in groups B, C, and D in Canada. (d) Combined data from CT and mammography for 2831 women.
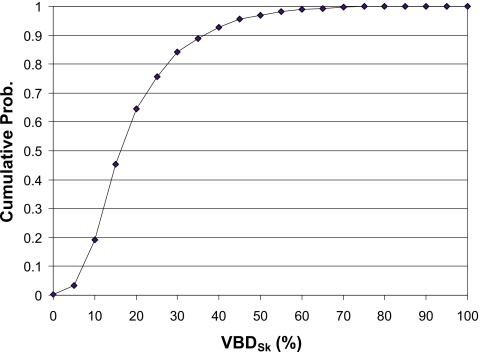
Figure 5 illustrates the cumulative fibroglandular data expressed as a percentage of patients. The interpretation of these data, for example, is that the median (50th percentile) VBDSk is about 16%, 80% of women have VBDSk lower than 27%, and 95% have densities below 45%.
Figure 5.
Cumulative histogram of volumetric density for all four groups of women.
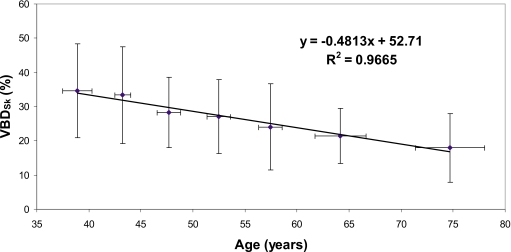
Breast density is not a static factor, but changes, especially during the premenopausal and postmenopausal phases of a woman’s life. Figure 6 illustrates the decadal trend in decreasing VBDSk based on the breast CT dataset.
Figure 6.
The age-dependent trend of breast density is illustrated for the breast CT data. To reduce noisiness of the data, for each decade of age in the cohort of participants, the ages and breast densities of the women were averaged. Errors in each dimension indicate 1 standard deviation.
DISCUSSION
The data determined from four female cohorts (one in California and three in Canada) and two independent measurement approaches show that the average VBDSk of the breast is 19.3%. When skin is excluded and only the actual fibroglandular tissue is considered, the density is approximately 14.3%. There are likely some differences in breast characteristics both within and between these groups. For example, group D was described as being sedentary and predominantly overweight. This is supported by their low VBD compared to the other groups, the relatively large breast volume, and the larger mean value of compressed breast thickness.
There are some differences between the CT data and the Cumulus results. For the validation experiment (Fig. 2), these could have arisen from variations in skin thickness because for the no-skin calculation, we assumed a standard constant value of 1.5 mm per layer. There will also be several small uncertainties in the physics model used for the generation of the simulated mammograms. For the large dataset (Fig. 4 and Table 1), the skin thickness will again be a source of uncertainty. In addition, there are also residual uncertainties in the estimate of compressed breast thickness. However, despite such variations and the differences in the imaging modalities and assessment techniques between the breast CT and mammography datasets, the distributions of VBD, as presented in Figs. 34, are quite similar.
Given the consistency between the VBD data, the most remarkable observation is that the numbers are so low. Figure 5 illustrates this point very well, where based on VBD, 50% of women have breasts with 16% VBD or less. Indeed, in the densest subset, the women who received CT, only 10 out of 191 women have breasts with VBD greater than 50% with skin included and only one had VBD greater than 50% when the skin was excluded. Collectively, these data then substantiate that the notion that the breast VBD for the average woman is 50% is indeed a myth.
The suggestion that the average breast is composed of 50% fibroglandular tissue and 50% fat was probably first made by Hammerstein et al.16, 17 who also described a breast dosimetry model containing a 5 mm thick layer of subcutaneous fat. Although the 50-50 model was adopted rapidly as a standard for dosimetry, it was observed by others that breast composition appeared to vary with patient-related factors such as age, breast thickness, etc. Klein et al.35 noted that, based on their experiments, “the standard mix (fraction of glandular tissue=50%) might need some modification.” They found, for example, that for a medium-sized breast, compressed to 55 mm, the VBD was about 35%. Dance et al.36 noted that for a screening population aged 50–64, “the typical glandularities of breasts with thicknesses of 4.5 and 5.0 cm are 41% and 33%, respectively.”
The works of Klein35 and also of Dance36 and Young37 used measurements of the mA s determined by automatic exposure control in a mammography system to draw a relationship between a compressed breast and a phantom material. While the phantom material can be produced in accurately known thicknesses, there is considerable uncertainty in compressed breast thickness, in general. We have found that the machine readout of compression thickness on commercial systems is both imprecise and also dependent on the compression force. Generally, the tendency is for the system to report a lower thickness than is actually the case30, 29 because as compression force is increased, the tracking between force and reduction in breast thickness becomes nonlinear with less change in thickness than that occurring at lower compression forces. This causes the estimate of tissue composition to err in the direction of overestimating fibroglandularity. The high sensitivity of the density estimate to breast thickness, approximately 4 VBD percentage points per mm, was illustrated in Fig. 1.
The data presented in this report make exclusive reference to the volume fraction of fibroglandular tissue in the breast as determined from the images. Results from the truly 3D breast CT data acquired at UC Davis and the volumetric assessments based on calibrated 2D mammography data from the Canadian women support the suggestions made previously by others35, 36, 37 that the 50-50 model is not representative of an “average breast” and motivate the development of a more realistic approach to x-ray dosimetry models for breast imaging.
ACKNOWLEDGMENTS
This research was funded in part by a grant to M.J.Y. from the Terry Fox Foundation (Medical Imaging for Cancer) and a grant to J.M.B. from the National Institutes of Health Grant No. R01 EB002138.
References
- Carney P. A., Miglioretti D. L., Yankaskas B. C., Kerlikowske K., Rosenberg R., Rutter C. M., Geller B. M., Abraham L. A., Taplin S. H., Dignan M., Cutter G., and Ballard-Barbash R., “Individual and combined effects of age, breast density, and hormone replacement therapy use on the accuracy of screening mammography,” Ann. Intern Med. 138(3), 168–175 (2003). [DOI] [PubMed] [Google Scholar]
- Boyd N. F., Guo H., Martin L. J., Sun L., Stone J., Fishell E., Jong R. A., Hislop G., Chiarelli A., Minkin S., and Yaffe M. J., “Mammographic density and the risk and detection of breast cancer,” N. Engl. J. Med. 356(3), 227–236 (2007). 10.1056/NEJMoa062790 [DOI] [PubMed] [Google Scholar]
- Buist D. S. M., Porter P. L., Lehman C., Taplin S. H., and White E., “Factors contributing to mammography failure in women aged 40–49 years,” J. Natl. Cancer Inst. 96, 1432–1440 (2004). [DOI] [PubMed] [Google Scholar]
- American College of Radiology, American College of Radiology Breast Imaging Reporting and Data System (BI-RADS), 4th ed. (American College of Radiology, Reston, 2003). [Google Scholar]
- Wolfe J. N., Saftlas A. F., and Salane M., “Mammographic parenchymal patterns and quantitative evaluation of mammographic densities: A case-control study,” AJR, Am. J. Roentgenol. 148, 1087–1092 (1987). [DOI] [PubMed] [Google Scholar]
- Byrne C., Schairer C., Wolfe J., Parekh N., Salane M., Brinton L. A., Hoover R., and Haile R., “Mammographic features and breast cancer risk: Effects with time, age, and menopause status,” J. Natl. Cancer Inst. 87, 1622–1629 (1995). 10.1093/jnci/87.21.1622 [DOI] [PubMed] [Google Scholar]
- Boyd N. F., Byng J. W., Jong R. A., Fishell E. K., Little L. E., Miller A. B., Lockwood G. A., Tritchler D. L., and Yaffe M. J., “Quantitative classification of mammographic densities and breast cancer risk: Results from the Canadian national breast screening study,” J. Natl. Cancer Inst. 87, 670–675 (1995). 10.1093/jnci/87.9.670 [DOI] [PubMed] [Google Scholar]
- Boyd N. F. et al. , “Mammographic signs as risk factors for breast cancer,” Br. J. Cancer 45, 185–193 (1982). [DOI] [PMC free article] [PubMed] [Google Scholar]
- Byng J. W., Boyd N. F., Fishell E., Jong R. A., and Yaffe M. J., “The quantitative analysis of mammographic densities,” Phys. Med. Biol. 39(10), 1629–1638 (1994). 10.1088/0031-9155/39/10/008 [DOI] [PubMed] [Google Scholar]
- Yaffe M. J., “Mammographic density. Measurement of mammographic density,” Breast Cancer Res. Treat. 10(3), 209–218 (2008). 10.1186/bcr2102 [DOI] [PMC free article] [PubMed] [Google Scholar]
- Pawluczyk O., Augustine B. J., Yaffe M. J., Rico D., Yang J., Mawdsley G. E., and Boyd N. F., “A volumetric method for estimation of breast density on digitized screen-film mammograms,” Med. Phys. 30(3), 352–364 (2003). 10.1118/1.1539038 [DOI] [PubMed] [Google Scholar]
- Highnam R., Pan X., Warren R., Jeffreys M., Davey Smith G., and Brady M., “Breast composition measurements using retrospective standard mammogram form (SMF),” Phys. Med. Biol. 51(11), 2695–2713 (2006). 10.1088/0031-9155/51/11/001 [DOI] [PubMed] [Google Scholar]
- Shepherd J. A., Kerlikowske K. M., Smith-Bindman R., Genant H. K., and Cummings S. R., “Measurement of breast density with dual x-ray absorptiometry: Feasibility,” Radiology 223, 554–557 (2002). 10.1148/radiol.2232010482 [DOI] [PubMed] [Google Scholar]
- Kaufhold J., Thomas J. A., Eberhard J. W., Galbo C. E., and Trotter D. E., “A calibration approach to glandular tissue composition estimation in digital mammography,” Med. Phys. 29, 1867–1880 (2002). 10.1118/1.1493215 [DOI] [PubMed] [Google Scholar]
- Van Engeland S., Snoeren P. R., Huisman H., Boetes C., and Karssemeijer N., “Volumetric breast density estimation from full-field digital mammograms,” IEEE Trans. Med. Imaging 25, 273–282 (2006). 10.1109/TMI.2005.862741 [DOI] [PubMed] [Google Scholar]
- Hammerstein G. R., in Depth Dose Data for Mammography in Reduced Dose Mammography edited by Logan W. W. and Muntz E. P. (Masson, New York, 1979), pp. 47–66. [Google Scholar]
- Hammerstein G. R., Miller D. W., White D. R., Masterson M. E., Woodard H. Q., and Laughlin J. S., “Absorbed radiation dose in mammography,” Radiology 130, 485–491 (1979). [DOI] [PubMed] [Google Scholar]
- Stanton L., Villafana T., Day J. L., and Lightfoot D. A., “Dosage evaluation in mammography,” Radiology 150, 577–584 (1984). [DOI] [PubMed] [Google Scholar]
- Fahrig R., Maidment A. D. A., and Yaffe M. J., “Optimization of peak kilovoltage and spectral shape for digital mammography,” Proc. SPIE 1651, 74–83 (1992). 10.1117/12.59405 [DOI] [Google Scholar]
- FDA, Mammography Quality Standards, Act Subpart A, Sec. 900.2, 2002. http://www.fda.gov/cdrh/mammography/frmamcom2.html#s90012.
- Queensland Health, Radiation Safety Standard, 1999. http://www.health.qld.gov.au/radiationhealth/documents/29118.pdf.
- Boone J. M., Nelson T., Kwan A., and Yang K., “Computed tomography of the breast: Design, fabrication, characterization, and initial clinical testing,” Med. Phys. 33, 2185 (2006). 10.1118/1.2241505 [DOI] [Google Scholar]
- Boone J. M., Nelson T. R., Lindfors K. K., and Seibert J. A., “Dedicated breast CT: Radiation dose and image quality evaluation,” Radiology 221(3), 657–667 (2001). 10.1148/radiol.2213010334 [DOI] [PubMed] [Google Scholar]
- Boone J. M., Kwan A. L., Yang K., Burkett G. W., Lindfors K. K., and Nelson T. R., “Computed tomography for imaging the breast,” J. Mammary Gland Biol. Neoplasia 11(2), 103–111 (2006). 10.1007/s10911-006-9017-1 [DOI] [PubMed] [Google Scholar]
- Lindfors K. K., Boone J. M., Nelson T. R., Yang K., Kwan A. L., and Miller D. F., “Dedicated breast CT: Initial clinical experience,” Radiology 246(3), 725–733 (2008). 10.1148/radiol.2463070410 [DOI] [PMC free article] [PubMed] [Google Scholar]
- MacQueen J. B., “Some methods for classification and analysis of multivariate observations,” Proceedings of the Fifth Berkeley Symposium on Mathematical Statistics and Probability (University of California Press, Berkeley, 1967), Vol. 1, pp. 281–297.
- Shapiro L. G. and Stockman G. C., Computer Vision (Prentice-Hall, Upper Saddle River, NJ, 2002), pp. 69–73, http://www.cse.msu.edu/~stockman/Book/2002/Chapters/ch3.pdf. [Google Scholar]
- Byng J. W., Mainprize J. G., and Yaffe M. J., “X-ray characterization of breast phantom materials,” Phys. Med. Biol. 43(5), 1367–1377 (1998) 10.1088/0031-9155/43/5/026 [DOI] [PubMed] [Google Scholar]; Byng J. W., Mainprize J. G., and Yaffe M. J., Phys. Med. Biol. 43(10), 3167 (1998). 10.1088/0031-9155/43/10/035 [DOI] [PubMed] [Google Scholar]
- Tyson A. H., Mawdsley G. E., and Yaffe M. J., “Measurement of compressed breast thickness by optical stereoscopic photogrammetry,” Med. Phys. 36, 569–576 (2009). 10.1118/1.3065066 [DOI] [PubMed] [Google Scholar]
- Mawdsley G. E., Tyson A. H., Peressotti C. L., Jong R. A., and Yaffe M. J., “Accurate estimation of compressed breast thickness in mammography,” Med. Phys. 36, 577–586 (2009). 10.1118/1.3065068 [DOI] [PubMed] [Google Scholar]
- Huang S. Y., Boone J. M., Yang K., Kwan A. L., and Packard N. J., “The effect of skin thickness determined using breast CT on mammographic dosimetry,” Med. Phys. 35(4), 1199–1206 (2008). 10.1118/1.2841938 [DOI] [PMC free article] [PubMed] [Google Scholar]
- Brock K. K., Sharpe M. B., Dawson L. A., Kim S. M., and Jaffray D. A., “Accuracy of finite element model-based multi-organ deformable image registration,” Med. Phys. 32, 1647–1658 (2005). 10.1118/1.1915012 [DOI] [PubMed] [Google Scholar]
- Al-Mayah A., Moseley J., and Brock K. K., “Contact surface and material nonlinearity modeling of human lungs,” Phys. Med. Biol. 53, 305–317 (2008). 10.1088/0031-9155/53/1/022 [DOI] [PubMed] [Google Scholar]
- Johns P. C. and Yaffe M. J., “X-ray characterisation of normal and neoplastic breast tissues,” Phys. Med. Biol. 32(6), 675–695 (1987). 10.1088/0031-9155/32/6/002 [DOI] [PubMed] [Google Scholar]
- Klein R., Aichinger H., Dierker J., Jansen J. T. M., Joite-Barfuß S., Säbel M., Shulz-Wendtland R., and Zoetelief J., “Determination of average glandular dose with modern mammography units for two large groups of patients,” Phys. Med. Biol. 42, 651–671 (1997). 10.1088/0031-9155/42/4/004 [DOI] [PubMed] [Google Scholar]
- Dance D. R., Skinner C. L., Young K. C., Beckett J. R., and Kotre C. J., “Additional factors for the estimation of mean glandular breast,” Phys. Med. Biol. 45, 3225–3240 (2000) (dose using the UK mammography dosimetry protocol). 10.1088/0031-9155/45/11/308 [DOI] [PubMed] [Google Scholar]
- Young K. C., Ramsdale M. L., and Bignall F., “Review of dosimetric methods for mammography in the UK breast screening programme,” Radiat. Prot. Dosim. 80, 183–186 (1998). [Google Scholar]


