Abstract
This paper presents a compact graphical method for comparing the performance of individual hearing impaired (HI) listeners with that of an average normal hearing (NH) listener on a consonant-by-consonant basis. This representation, named the consonant loss profile (CLP), characterizes the effect of a listener’s hearing loss on each consonant over a range of performance. The CLP shows that the consonant loss, which is the signal-to-noise ratio (SNR) difference at equal NH and HI scores, is consonant-dependent and varies with the score. This variation in the consonant loss reveals that hearing loss renders some consonants unintelligible, while it reduces noise-robustness of some other consonants. The conventional SNR-loss metric ΔSNR50, defined as the SNR difference at 50% recognition score, is insufficient to capture this variation. The ΔSNR50 value is on average 12 dB lower when measured with sentences using standard clinical procedures than when measured with nonsense syllables. A listener with symmetric hearing loss may not have identical CLPs for both ears. Some consonant confusions by HI listeners are influenced by the high-frequency hearing loss even at a presentation level as high as 85 dB sound pressure level.
INTRODUCTION
Consonant recognition studies have shown that hearing impaired (HI) listeners make significantly more consonant errors than normal hearing (NH) listeners both in quiet (Walden and Montgomery, 1975; Bilger and Wang, 1976; Doyle et al., 1981) and in presence of a noise masker (Dubno et al., 1982; Gordon-Salant, 1985). It has been shown that NH listeners demonstrate a wide range of performance across different consonants presented in noise (Phatak and Allen, 2007; Phatak et al., 2008), and it is likely that HI listeners would also exhibit a variance in performance across the same consonants. A quantitative comparison of recognition performances for individual consonants is necessary to determine whether the loss of performance for HI listeners is consonant-dependent. In this study, we present a graphical method to quantitatively compare the individual consonant recognition performance of HI and NH listeners over a range of signal-to-noise ratios (SNRs). Such comparison characterizes the impact of hearing loss on the perception of each consonant.
The effect of hearing loss on speech perception in noise has two components. The first component is the loss of audibility, which causes elevated thresholds for any kind of external sound. Modern hearing aids compensate this loss with a multichannel non-linear amplification. In spite of the amplification, HI listeners still have difficulty perceiving speech in noise compared to NH listeners (Humes, 2007). This difficulty in understanding speech in noise at supra-threshold sound levels is the second component and is known by different names such as “distortion” (Plomp, 1978), “clarity loss,” and “SNR-loss” (Killion, 1997). Audibility depends on the presentation level of the sound whereas the supra-threshold performance depends on the SNR. It is difficult to separate the two components, and this has led to controversies about characterizing of the SNR-loss. Technically, SNR-loss is defined as the additional SNR required by a HI listener to achieve the same performance as a NH listener. The difference between speech reception thresholds (SRTs) of HI and NH listeners, at loud enough presentation levels, is the commonly used quantitative measure of SNR-loss (Plomp, 1978; Lee and Humes, 1993; Killion, 1997). The SRT is the SNR required for achieving 50% recognition performance. We will use ΔSNR50 to refer to this metric, and the phrase SNR-loss to refer to the phenomenon of SNR deficit exhibited by HI listeners at supra-threshold levels.
Currently, the most common clinical method for measuring SNR-loss is the QuickSIN test developed by Etymotic Research (Killion et al., 2004). In this procedure, two lists of six IEEE sentences are presented at about 80–85 dB sound pressure level (SPL)1 to listeners with pure-tone average (PTA) (i.e., the average of audiometric thresholds at 500 Hz, 1 kHz, and 2 kHz) up to 45 dB hearing level (HL) and at a “Loud, but OK” level to those with PTA≥50 dB HL (QuickSIN manual, 2006) without pre-emphasis or high-frequency amplification. The first sentence of each list is presented at 25 dB SNR with a four-talker babble masker, and the SNR of subsequent sentences is decreased in 5 dB steps. The SRT is then estimated using method of Hudgins et al. (1947) described in Tillman and Olsen (1973), and ΔSNR50 is calculated by assuming that the average SRT for NH listeners on the same task is 2 dB SNR. The ΔSNR50 is presumed to be a measure of supra-threshold SNR-loss. However, the QuickSIN procedure does not guarantee that the HI listener listens at supra-threshold levels at all frequencies. Therefore, the ΔSNR50 thus obtained may not necessarily be an audibility-independent measure of the SNR-loss. Also, ΔSNR50 does not provide any information about the SNR differences at other performance points, e.g., 20% or 80% recognition, and therefore it is insufficient to characterize the SNR-loss.
Another difficulty in interpreting the results of most SNR-loss studies is that the speech stimuli used are either sentences or meaningful words (spondee). A context effect due to meaning, grammar, prosody, etc., increases the recognition scores in noisy conditions without actually improving the perception of speech sounds (French and Steinberg, 1947; Boothroyd and Nittrouer, 1988). The effect of context information on the ΔSNR50 metric has not been measured.
To address such issues regarding SNR-loss and consonant identification, a Miller and Nicely (1955) type confusion matrix (CM) experiment was conducted on HI listeners. The results of this experiment are compared with NH data from Phatak and Allen (2007) collected on the same set of consonant-vowel (CV) stimuli. In this paper, we develop a compact graphical representation of such comparison for each HI listener on a consonant-by-consonant basis. This representation, denoted the consonant loss profile (CLP), shows variations in the individual consonant loss over a range of performance. We also compare consonant confusions of HI and NH listeners. To estimate the effect of context, ΔSNR50 values obtained from our consonant recognition experiment will be compared with those obtained using the QuickSIN.
METHODS
The listeners in this study were screened based on their pre-existing audiograms and other medical history. Anyone with a conductive hearing loss or a history of ear surgery was excluded. All those listeners having sensorineural hearing loss with PTA between 30 and 70 dB HL, in at least one ear, were recruited for this study and their audiograms were re-measured. Table 1 shows details of the participants. Initially, 12 listeners were tested with their best ears, while both ears of 2 listeners were separately tested, resulting in 16 HI test ears. We call these as listener set 1 (LS1). 1 year later, six of the LS1 HI ears along with nine new HI ears (eight new HI listeners) were tested (LS2). In all, 26 HI ears were tested in this study.
Table 1.
Listener information: subject ID, ear tested (L: left, R: right), age (in years), gender (M: male, F: female), average pure-tone thresholds at 0.25, 0.5, 1, and 2 kHz (PTALF) and at 4 and 8 kHz (PTAHF), and the listener set (LS). Six listeners were common to both sets LS1 and LS2.
| Sub. ID | 1 | 2 | 3 | 4 | 12 | 39 | 48 | 58 | 71 | 76 | 112 | 113 | 134 | 148 | 170 | 177 | 188 | 195 | 200 | 208 | 216 | 300 | 301 |
|---|---|---|---|---|---|---|---|---|---|---|---|---|---|---|---|---|---|---|---|---|---|---|---|
| Ear | L | L,R | R | L,R | L | L | R | R | L | L | R | R | L | L | R | R | R | L | L,R | L | L | L | R |
| Age | 21 | 63 | 21 | 59 | 39 | 63 | 62 | 55 | 60 | 62 | 54 | 48 | 52 | 60 | 53 | 39 | 64 | 60 | 52 | 54 | 58 | 54 | 58 |
| Gender | F | F | M | F | F | M | M | F | M | F | F | M | F | M | M | F | M | F | M | F | F | M | F |
| PTALF | 27.5 | L:6.25 | 26.25 | L:40 | 31.25 | 26.25 | 26.25 | 43.75 | 25 | 42.5 | 11.25 | 42.5 | 18.75 | 15 | 3.75 | 31.25 | 16.25 | 16.25 | L:20 | 21.25 | 50 | 8.75 | 17.5 |
| R:10 | R:38.75 | R:25 | |||||||||||||||||||||
| PTAHF | 85 | L:60.0 | 40 | L:52.5 | 82.5 | 60 | 70 | 22.5 | 60 | 55 | 67.5 | 60 | 52.5 | 67.5 | 35 | 52.5 | 45 | 52.5 | L:55.0 | 47.5 | 65 | 50 | 90 |
| R:62.5 | R:47.5 | R:57.5 | |||||||||||||||||||||
| LS | 1 | 1 | 1 | 1 | 1,2 | 1 | 1,2 | 1,2 | 1 | 1 | 1,2 | 1,2 | 1,2 | 1 | 2 | 2 | 2 | 2 | 2 | 2 | 2 | 2 | 2 |
The degree of audiometric hearing loss of listeners varied from normal to moderate at frequencies up to 2 kHz (PTALF≤55 dB HL) and between moderate to profound at 4 kHz and above (PTAHF). The QuickSIN thresholds (standard, no filtering) were also measured for LS1 ears (Killion et al., 2004). Listeners were tested unaided in a sound-treated room at the Speech and Hearing Science Department of the University of Illinois at Urbana-Champaign. The testing procedures for the CM experiment were similar to those used in Phatak and Allen’s (2007) study. Isolated CV syllables with 16 consonants (∕p∕, ∕t∕, ∕k∕, ∕f∕, ∕θ∕, ∕s∕, ∕∫∕, ∕b∕, ∕d∕, ∕ɡ∕, ∕v∕, ∕ð∕, ∕z∕, ∕ʒ∕, ∕m∕, ∕n∕) and vowel ∕ɑ∕, each spoken by ten different talkers, were selected from LDC2205S222 2 database (Fousek et al., 2004). The stimuli were digitally recorded at a sampling rate of 16 kHz. The syllables were presented in noise masker at five SNRs (−12,−6,0,6,12 dB) and in the quiet condition (i.e., no masker). The masker was a steady-state noise with an average speech-like spectrum identical to that used by Phatak and Allen (2007). The masker spectrum was steady between 100 Hz and 1 kHz and had low-frequency and high-frequency roll-offs of 12 and −30 dB∕dec, respectively. Listeners were tested monaurally using Etymotic ER-2 insert earphones to avoid ear canal collapse and to minimize cross-ear listening. The presentation level of the clean speech (i.e., the quiet condition) was adjusted to the most comfortable level (MCL) for each listener using an external TDT PA5 attenuator. The attenuator setting was maintained for that listener throughout the experiment. Though the actual speech level for each listener was not measured, calibration estimates the presentation levels in the ear canal to be either 75 or 85 dB SPL depending on the attenuator setting. Each token was level-normalized before presentation using VU-METER software (Lobdell and Allen, 2007). No filtering was applied to the stimuli.
Listeners were asked to identify the consonant in the presented CV syllable by selecting 1 of 16 software buttons on a computer screen, each labeled with one consonant sound. A pronunciation key for each consonant was provided next to its button. This was necessary to avoid confusions due to orthographic similarity between consonants such as ∕θ∕-∕ð∕ and ∕z∕-∕ʒ∕. The listeners were allowed to hear the syllable as many times as they desired before making a decision. After they clicked their response, the next syllable was presented after a short pause. The syllable presentation was randomized over consonants, talkers, and SNRs.
The performance of each HI listener is then compared with the average consonant recognition performance of ten NH listeners. These NH data are a subset of the Phatak and Allen (2007) data (16 consonants, 4 vowels) that includes responses to the CV syllables with only vowel ∕ɑ∕, presented in speech-weighted noise (SNR: [−22,−20,−16,−10,−2] dB and quiet). In Phatak and Allen’s (2007) study, the stimuli were presented diotically via circumaural headphones. Though diotic presentation increases the percept of loudness, it does not provide any significant SNR-advantage over monaural presentation for recognizing speech in noise (Licklider, 1948; Helfer, 1994). Therefore, the results of this study do not require any SNR-correction for comparing with the results of Phatak and Allen (2007).
RESULTS
Test-retest measure
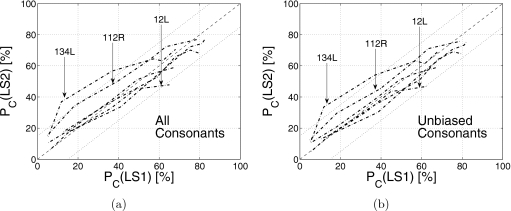
There was a gap of about 1 year between data collection from the two listener sets LS1 and LS2. The scores of six HI listeners, which were common to both sets, are compared for consistency in Fig. 1a. The average consonant recognition score Pc(SNR) is the ratio of the number of consonants recognized correctly to the total number consonants presented at a given SNR. Three of the six listeners, viz., 48R, 76L, and 113R, have very similar scores in both sets with correlation coefficients (r) greater than 0.99 (Table 2). Listeners 12L, 112R, and 134L have score differences of more than 15% across the two sets (i.e., ∣ΔPc∣=∣Pc(LS2)−Pc(LS1)∣>15%). However, these differences are primarily due to two to four consonants. Confusion matrices (not shown) reveal that these three listeners have significant biases toward specific consonants in the LS2 data. We define a listener to have a bias in favor of a consonant if at the lowest SNR (i.e., −12 dB), the total responses for that consonant are at least three times the number of presentations of that consonant. Such biases result in high scores. For example, at −12 dB SNR, listener 134L has a ∕s∕ recognition score of 70% due to a response bias indicated by a high false alarm rate for ∕s∕ (i.e., 27 presentations of consonant ∕s∕ and 87 ∕s∕ responses, out of which 19 were correct). Listener 76L also showed bias for consonant ∕s∕, whereas listeners 112R showed bias for ∕t∕ and ∕z∕ in LS2 data. Listeners 12L and 113R showed biases for ∕n∕ and ∕s∕, respectively, but in both sets. Such biases, though present, are relatively weaker in set LS1 for these three listeners. If average scores in both sets are estimated using only unbiased consonants for each listener, then five out of six listeners have score differences less than 15% [i.e., ∣ΔPc∣⩽0.15, Fig. 1b]. The higher LS2 scores for listener 134L could be a learning effect. Therefore, only LS1 data were used for 134L. For the other five listeners, both LS1 and LS2 data were pooled together before estimating CMs.
Figure 1.
(a) The average consonant scores in listener sets 1 [Pc(LS1)] and 2 [Pc(LS2)] for the six common listeners 12L, 48R, 76L, 112R, 113R, and 134L. (b) Same as (a), but with average consonant scores estimated using only unbiased consonants, as discussed in the text. The dotted lines parallel to diagonal represent ±15% difference (∣ΔPc∣=∣Pc(LS2)−Pc(LS1)∣=15%).
Table 2.
The correlation coefficients (r) between Pc(LS1) and Pc(LS2) scores for the six listeners from Fig. 1.
| Listener | 12L | 48R | 76L | 112R | 113R | 134L |
|---|---|---|---|---|---|---|
| All consonants | 0.980 | 0.992 | 0.992 | 0.987 | 0.994 | 0.946 |
| Unbiased consonants | 0.978 | 0.992 | 0.994 | 0.990 | 0.994 | 0.951 |
Context effect on ΔSNR50
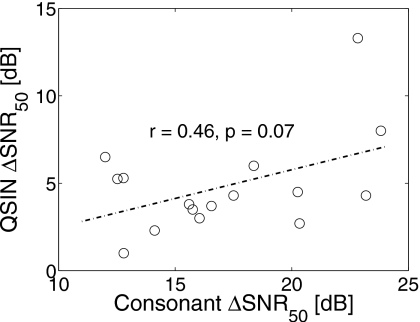
The consonant recognition SRT for each HI listener was obtained by interpolating the Pc(SNR) values for that listener. The ΔSNR50 was then calculated by comparing this SRT value to the corresponding SRT for average NH (ANH) performance from Phatak and Allen (2007). The ΔSNR50 values thus obtained for consonant recognition are compared with the measured QuickSIN ΔSNR50 values for LS1 listeners in Fig. 2. The two ΔSNR50 values are not statistically correlated (p>0.05) with each other. The variability across listeners is greater for consonant ΔSNR50 than for the QuickSIN ΔSNR50. Consonant ΔSNR50 values are moderately correlated (p<0.03) with the average of pure-tone thresholds at 4 and 8 kHz (PTAHF), accounting for 30% of the variance (r=0.55) in consonant ΔSNR50. The QuickSIN ΔSNR50 values are neither correlated with PTAHF nor with the traditional PTA (0.5, 1, and 2 kHz).
Figure 2.
A comparison of ΔSNR50 values estimated from our consonant recognition data (abscissa) and those measured using QuickSIN (ordinate). A linear regression line (dashed-dotted) is shown along with the correlation coefficient (r) and null-hypothesis probability (p) for the two sets of ΔSNR50 values.
The sentence ΔSNR50 obtained using QuickSIN is, on average, 12.31 dB lower than the consonant ΔSNR50. The difference in SRT estimation procedures [i.e., Tillman and Olsen (1973) vs linear interpolation of Pc(SNR)] cannot account for such a large difference. Therefore, the most likely reason for this difference could be the speech stimuli. Sentences have a variety of linguistic context cues that are not present in isolated syllables. HI listeners rely more than NH listeners on such context information in order to compensate for their hearing loss (Pichora-Fuller et al., 1995). This results in lower ΔSNR50 values for sentences than for consonants. The context effect may also be responsible for the absence of correlation between QuickSIN ΔSNR50 and the PTA values.
Average consonant loss
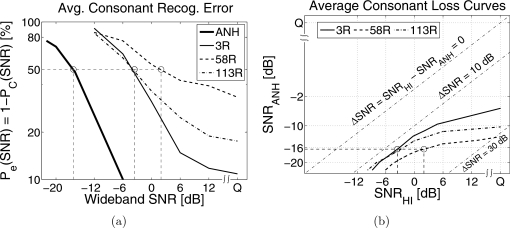
The average consonant recognition errors Pe(SNR)=1−Pc(SNR) for HI listeners are significantly higher than those for NH listeners. Figure 3a shows Pe(SNR) for three different HI listeners (3R, 58R, and 113R) and for the ANH data (solid line) on a logarithmic scale. The conventional ΔSNR50 measure would report the SNR difference between the 50% points (i.e., the SRT difference) of ANH and HI listeners denoted by the circles. The ANH and HI Pe(SNR) curves are not parallel, and therefore the SNR difference ΔSNR is a function of the performance level Pe. For example, listeners 3R and 113R have an identical SNR difference at Pe=50%, but listener 113R has a greater SNR difference than 3R at Pe=20%. Listener 58R cannot even achieve an error of 30%. Since the performance-SNR functions of HI and NH listeners are not parallel, the SNR difference at a single performance point, such as the SRT, is not sufficient to characterize the SNR deficit.
Figure 3.
(a) Average consonant recognition error Pe(SNR) for three HI listeners 3R, 58R, and 113R. The thick solid line denotes the corresponding Pe(SNR) for the average of ten NH listener data (i.e., ANH) from Phatak and Allen (2007). The circles represent the 50% performance points. (b) Average consonant loss curves for the same three listeners.
To characterize the SNR difference over a range of performance, we plot the SNR required by a HI listener against that required by an average NH listener to achieve the same average consonant score. We call this matched-performance SNR contour as the average consonant loss curve. Figure 3b shows the average consonant loss curves for 3R, 58R, and 113R obtained by comparing their scores with the ANH scores from Fig. 3a. The dash-dotted straight lines show contours for SNR differences (ΔSNR=SNRHI−SNRANH) of 0, 10, and 30 dB. In this example, 58R achieves 50% performance (circle) at 2 dB SNR, while the 50% ANH score is achieved at −16 dB SNR. Thus, the 50% point on the average consonant loss curve [circle in Fig. 3b] for 58R has an abscissa of SNRHI=2 dB and an ordinate of SNRANH=−16 dB. The conventional ΔSNR50=∣(SNRHI−SNRANH)∣Pc=50% value can be obtained for consonants by measuring the distance of this point from the ΔSNR=0 line, which depicts zero consonant loss (i.e., identical ANH and HI SNRs for a given performance). A curve below this line indicates that the HI listener performance is worse than the ANH performance (i.e., ΔSNR>0). These average consonant loss curves diverge from the ΔSNR=0 reference line in the SNRHI>0 dB region, indicating a greater consonant loss. Such variation in consonant loss cannot be characterized by the ΔSNR50 metric.
Consonant loss profile
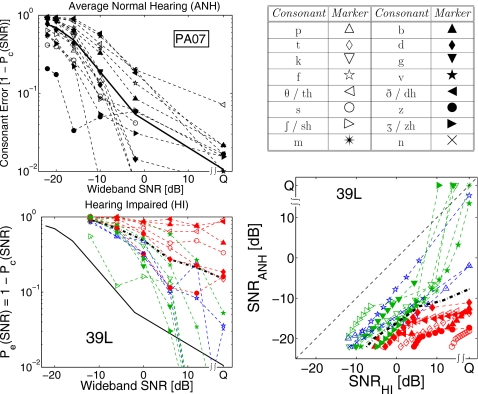
There is a significant variation in the performance of individual HI listeners across different consonants. The bottom left panel of Fig. 4 shows consonant error Pe(SNR) for HI ear 39L (i.e., listener 39, left ear) on a log scale. At 0 dB SNR, the average consonant error is 51%, but the error varies across consonants from 16% for ∕ʃ∕ to 87% for ∕v∕, resulting in a standard deviation of σPe(0 dB)=24%. Similar large variations in consonant errors are observed for all HI ears with σPe(0 dB) ranging from 19% to 34%. For the ANH consonant errors (Fig. 4, top left panel) the average error at −16 dB is 52%, but individual consonant error varies from 3% to 90% with σPe(−16 dB)=25%. Thus, a comparison of the average curves for ANH and HI listeners does not provide useful information about the SNR deficits for individual consonants.
Figure 4.
Top left: Consonant recognition errors Pe(SNR) on a log scale for average normal hearing data from Phatak and Allen (2007). The solid line shows the average consonant error. Top right: Marker symbols for the consonants. Bottom left: Pe(SNR) for HI listener 39, left ear. Thick, dash-dotted line shows the average consonant error for 39L, while solid line shows average consonant error for the ANH data (from top left panel). Bottom right: The consonant loss profile for HI ear 39L. The dashed reference line with no symbols represents ΔSNR=SNRHI−SNRANH=0 and the thick dash-dotted line is the average consonant loss curve.
To analyze the loss for individual consonants, the matched-performance SNR contours are plotted for each consonant for a given HI ear. We call this plot the consonant loss profile (CLP) of that ear. The bottom right panel in Fig. 4 shows the CLP for 39L. Each of the 16 CLP curves has ten data points, indicated by the marker positions, but with different spacing. For estimating the consonant loss curve for a consonant, first a range of performance Pe that was common to both HI and ANH performances for that consonant was determined and then SNRHI and SNRANH values for ten equidistant Pe points in this range were estimated by interpolating Pe(SNR) curves, resulting in different marker spacings on SNR scale. Thus, some consonants that have a small common Pe range across HI and ANH performance, such as ∕s∕ (○), have closely spaced markers, while others like ∕f∕ (✫) with a larger common Pe range have widely spaced markers.
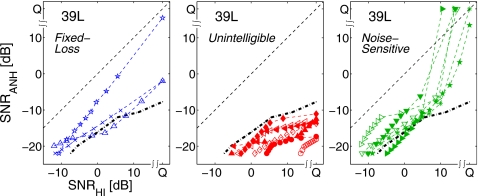
These individual consonant loss curves have patterns that are significantly different than the average curve (thick dash-dotted curve). The curves can be categorized into three sets, as shown in Fig. 5.
-
(1)
Fixed-loss consonants. These curves run almost parallel to the reference line with no significant slope change. The SNR difference for these consonants is nearly constant.
-
(2)
Unintelligible consonants. These curves, with very shallow slopes, indicate poor intelligibility even at higher SNR for HI listeners. The quiet condition (Q) performance of the HI ear for these consonants [Pc(Q)≈50%] is equivalent to the ANH performance at about −10 to −12 dB SNR. These consonants clearly indicate an audibility loss even at the MCL.
-
(3)
Noise-sensitive consonants. The HI ear performance for these consonants is close to, and sometimes even better than, the ANH performance in the quiet condition. In quiet, these consonants are not affected by the elevated thresholds of the HI ear. However, even a small amount of noise (i.e., SNRHI=12 dB) reduces the HI ear’s performance to an ANH equivalent of −8 to −12 dB SNR, resulting in significant SNR deficits for these noise-sensitive consonants.
Figure 5.
The consonant-loss profile curves of 39L separated into three groups: fixed-loss (∕∕p∕,∕f∕,∕n∕) (left), unintelligible (∕t∕,∕θ∕,∕s∕,∕b∕,∕d∕,∕ð∕,∕z∕) (center), and noise-sensitive (∕k∕,∕ʃ∕,∕ɡ∕,∕ʒ∕,∕v∕,∕m∕) (right).
The CLP characterizes the type and magnitude of the effect of hearing loss on each consonant. The unintelligible and the noise-sensitive consonant groups relate to Plomp’s A-factor (audibility) and D-factor (distortion) losses, respectively. For the purpose of this study, consonant loss curves that do not exceed a slope (i.e., ΔSNRANH∕ΔSNRHI) of tan(30°)=0.577 dB∕dB are categorized as unintelligible, while those which achieve a slope greater than tan(60°)=1.732 dB∕dB are categorized as noise-sensitive.
Note that the CLP is a relative metric because it is referenced to the ANH consonant scores. A consonant with the highest error, such as ∕θ∕ (◁) or ∕ð∕ (◀) for 39L (Fig. 4, bottom left panel), may not have the highest SNR difference (Fig. 4, bottom right panel) if the ANH performance for that consonant is also poor.
CLP types
The degree and type of consonant loss for a given consonant vary significantly across listeners. Every HI listener shows a different distribution of consonants in each of the three CLP sets (i.e., fixed-loss, noise-sensitive, and unintelligible). Depending on the number of consonants in each set, we divide the HI CLPs into three types. If more than half the consonants in a CLP are unintelligible (i.e., A-factor loss), then it is categorized as type A CLP. If more than half the consonants are noise-sensitive (i.e., D-factor loss), then the CLP is type D. All other CLPs, with intermediate distributions, are labeled as type M.
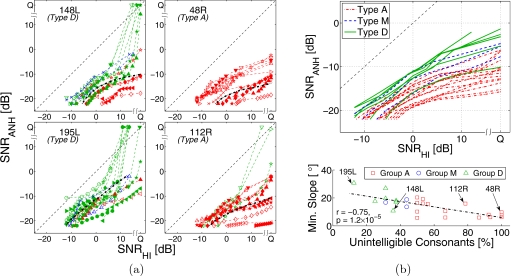
Figure 6a shows two type A and two type D CLPs. The average curves (dash-dotted) for type A CLP have shallower slopes than for type D due to higher percentage of unintelligible consonants. Also, within each type, more unintelligible consonants result in a flatter average curve. In general, the number of unintelligible consonants determines the shape of average consonant loss curves, i.e., a CLP with more unintelligible consonant curves has a flatter average consonant loss curve. The bottom panel in Fig. 6b shows that the minimum slope of average consonant loss curve is inversely proportional (r=−0.75, p<0.0001) to the percentage of unintelligible consonants. The top panel in Fig. 6b shows the average consonant loss curves for the 26 HI ears tested. The minimum slopes are always in the SNRHI>0 region. Though the curves associated with type A CLPs are relatively flatter than those associated with the other two CLP types, there is no well-defined boundary. These curves rather show a near continuum of average consonant loss.
Figure 6.
(a) Examples of type A (148L, 195L) and type D (48R, 112R) consonant loss profiles. The average consonant loss curves (thick, dash-dotted) are shown in black. (b) Top: The average consonant loss curves for all HI listeners. The CLP types associated with the curves are represented by line styles. Bottom: Comparison of percentage of unintelligible sounds in each CLP vs the minimum slope (in degrees) of the corresponding average consonant loss curve. Regression line and correlation coefficient are shown.
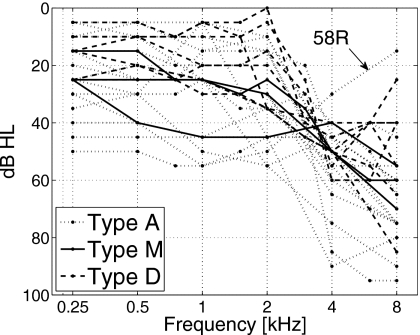
Figure 7 shows audiograms for all HI ears tested. The distribution of consonants in the three CLP sets and the listener group based on that distribution do not correlate well with the audiograms. Listeners with type A CLP (dash-dotted lines) have relatively higher hearing loss than the rest of listeners, but this difference is not statistically significant. Also, one type A listener (58R) has very good high-frequency hearing (15 dB HL at 8 kHz). This outlier listener has moderate hearing loss only in the mid-frequency range (1–2 kHz), suggesting the possibility of a cochlear dead region.
Figure 7.
Audiograms of the HI ears. The CLP type associated with each ear is represented by the line style.
Ear differences
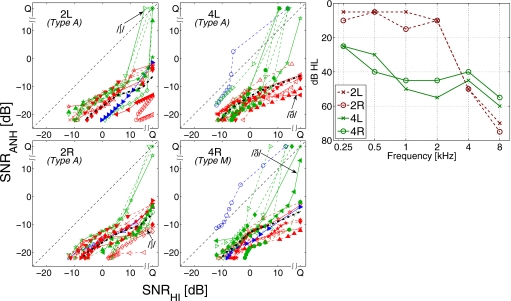
Both ears were tested for three HI listeners (2, 4, and 200). The left and right ear CLPs for two of these listeners (2 and 4) are compared in Fig. 8. Both listeners have symmetric hearing losses (right panel), and there are many similarities between the two CLPs of each listener. There are also some significant differences. For example, consonant ∕ʃ∕ (▷) is noise-sensitive for the right ear of listener 2, but not for the left ear. Similarly consonant ∕ð∕ (◀) is unintelligible to listener 4’s left ear, but not to the right ear. These differences between ears imply differences in the peripheral auditory system that are not accounted for by only the audiograms.
Figure 8.
Consonant loss profiles for both ears of two listeners: 2L, 2R (left) and 4L, 4R (center). For each listener, the consonants that are categorized differently in two ears are shown with solid curves. Audiograms for the four ears are shown in the right panel.
Consonant confusions
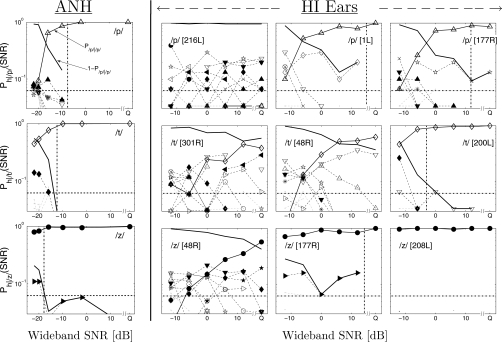
We use confusion patterns (CPs) to analyze consonant confusions. A confusion pattern [Ph∣s(SNR); s: spoken, h: heard] is a plot of all the elements in a row of a row-normalized CM (i.e., row sum=1) as a function of SNR. For example, the top left panel in Fig. 9 shows the row corresponding to the presentation of consonant ∕p∕ in the ANH CM [Ph∣s(SNR) for s=∕p∕]. Each curve with symbols shows values of one cell in the row as a function of SNR. For example, the curve P∕p∕∣∕p∕(SNR) represents the diagonal cell, i.e., the recognition score for ∕p∕. The solid line without any symbols represents the total error, i.e., 1−P∕p∕∣∕p∕(SNR). All other dashed curves are off-diagonal cells, which represent confusions of ∕p∕ with other consonants, denoted by the symbols. The legend of consonant symbols is shown in Fig. 4. The confusion of ∕p∕ with ∕b∕ (▲ in top left panel), a voicing confusion, has a maximum at −16 dB SNR. Thus, consonant ∕p∕ forms a weak confusion group with ∕b∕, below the confusion threshold of −16 dB SNR. At very low SNRs, all curves asymptotically converge to the chance performance of 1∕16 (horizontal dashed line).
Figure 9.
Three examples of consonant CPs for the ANH data are shown in the left column. The three examples are for consonants ∕p∕ (Δ, top row), ∕t∕ (◇, center row), and ∕z∕ (●, bottom row). The consonant CPs from three different HI ears (right three columns) are shown for each of these three consonants. Each dashed curve represents confusion with a consonant, denoted by the symbol. The legend of consonant symbols is provided in Fig. 4. The vertical dashed line in each panel indicates SNR90, i.e., the SNR at Pc=90%.
The ANH CPs have a small number of confusions, but with clearly formed maxima, for all consonants. For example, ∕t∕ (◇, center left panel) forms a confusion group with ∕d∕ (◆), and ∕z∕ (●, bottom left panel) with ∕ʒ∕ (▶). While this is true for the majority of HI CPs, a few HI CPs show several simultaneous confusions with poorly defined confusion groups. One such HI CP is shown in Fig. 9 for each of the three exemplary consonants (216L for ∕p∕, 301R for ∕t∕, and 48R for ∕z∕). The HI ears that exhibit CPs with a large number of competitors are different across consonants.
Figure 9 also shows two HI CPs with a small number of competitors (panels in columns 3 and 4) for each of the three consonants. Clear consonant confusion groups are observed in these CPs due to a small number of competitors. For some of these CPs, the confusion groups are similar to those observed in the ANH data. For example, ∕t∕-∕d∕ confusion for 200L and ∕z∕-∕ʒ∕ confusion for 177R are also observed in the corresponding ANH CPs (left column). However, several HI CPs show confusion groups that are different from those in the corresponding ANH CPs. For example, the ANH CP for ∕p∕ [i.e., ph∣∕p∕(SNR)] shows a weak ∕p∕-∕b∕ group, while HI ears show significant confusions of ∕p∕ with ∕t∕ and ∕k∕ (1L) and with ∕f∕ (177R). Similarly, HI listeners often confuse ∕t∕ with ∕p∕ and ∕k∕ (48R), unlike the ∕t∕-∕d∕ confusion in the ANH CP (left column, center panel). Occasionally, a HI listener may show better performance than ANH. For example, 208L (bottom right panel) did not confuse ∕z∕ with any other consonant, resulting in a score >90% even at a SNR of −12 dB.
The ∕t∕-∕p∕-∕k∕ confusion group from the HI CPs (∕p∕ for 1L and ∕t∕ for 48R) is not observed in the corresponding ANH data (left column, top 2 panels). However, NH listeners show the same confusion group in the presence of a white noise masker (Miller and Nicely, 1955; Phatak et al., 2008). This is because white noise masks higher frequencies more than speech-weighted noise at a given SNR. Several studies have shown that the bandwidth and intensity of the release burst at these high frequencies are crucial when distinguishing stop plosive consonants (Cooper et al., 1952; Régnier and Allen, 2008). In HI ears, audiometric loss masks these high frequencies, resulting in confusions similar to those for NH listeners in white noise. Note that 200L (PTAHF=55 dB HL), with relatively better high-frequency hearing than 48R (PTAHF=70 dB HL), did not show ∕t∕-∕p∕-∕k∕ confusion.
HI CPs are not as smooth as the ANH CPs. This is because the ANH data are pooled over many listeners, thereby increasing the row sums of CMs and decreasing the variance. The HI data are difficult to pool over listeners because of the large confusion heterogeneity across HI ears compared to NH data. The low row sums for listener-specific HI CMs increase the statistical variance of the confusion analysis, especially when there are multiple competitors. In such cases, the probability distribution of a row becomes multimodal, which is difficult to estimate reliably with low sample size (i.e., row sum). When the distribution is unimodal (no confusions) or bi-modal (one strong competitor), low row sums are adequate for obtaining reliable confusion patterns.
The HI listeners not only make significantly more errors than the ANH errors but also demonstrate different errors. In terms of the CPs, it means that the HI CPs not only have higher confusion thresholds but also have different competitors than those in the corresponding ANH CPs. Phatak et al. (2008) described two characteristics of the variability in confusion patterns. First is threshold variability, where the SNR below which the recognition score of a consonant drops sharply, varies across CPs. The second type of variability is confusion heterogeneity, where competitors of the same sound are different across CPs. Though it is difficult to characterize confusion heterogeneity across HI listeners due to low row sums, threshold variability can be characterized for each listener even with the relatively low row sums. This is because the threshold variability is quantified using the saturation threshold SNR90 (i.e., the SNR at which the recognition score is 90%) and the confusion threshold SNRg (i.e., the SNR at which a confusion group is formed). At SNR90, there are very few confusions, and thus the probability distribution of the row is unimodal, which can be reliably estimated even with low row sums.
The saturation thresholds (SNR90) are shown by vertical dash-dotted lines in Fig. 9. Listener 216L is unable to recognize ∕p∕ (top right panel), resulting in almost 100% error for ∕p∕ at all SNRs. In this case, 216L is considered to have a SNR90=∞ for consonant ∕p∕. On the other hand, 208L’s recognition score for ∕z∕ (bottom right panel) is always greater than 90% at all tested SNRs. This is represented with a SNR90=−∞.
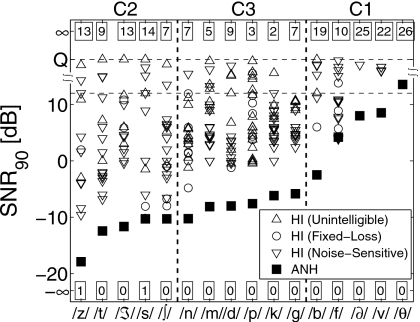
Figure 10 shows all SNR90 values for ANH (filled squares) and HI (open symbols) listeners for each consonant. The numbers at the top and bottom indicate the number of listeners with SNR90=∞ and −∞, respectively, for each consonant. The SNR90 values falling between +12 dB SNR and the quiet condition are estimated by assuming a SNR of +18 dB for the quiet condition. Hence the ordinate scale between the two horizontal dashed lines in Fig. 10 is warped. As discussed earlier, a single performance point, such as SNR90 or SNR50, cannot characterize the shape of consonant loss curves. Therefore, different symbols are used to indicate the CLP groups, which relate to the shapes of consonant loss curves. The symbol indicates whether a consonant was an unintelligible (△), a noise-sensitive (▽), or a fixed-loss (○) consonant for each listener.
Figure 10.
Saturation thresholds SNR90 for ANH (filled circles) and HI (open symbols) listeners sorted by ANH SNR90 values. The numbers at the top and the bottom indicate the number of listeners with SNR90=∞ (Pc<90% at all SNR) and SNR90=−∞ (Pc>90% at all SNR) for each consonant. The shapes of open symbols represent the consonant loss categories derived from the CLPs. The categorization of consonants in sets C1, C2, and C3 is according to Phatak and Allen (2007).
Phatak et al. (2008) collected data on NH listeners and used the saturation threshold SNR90 as a quantitative measure of noise-robustness (Régnier and Allen, 2008). However, for HI ears, it is a measure of overall consonant loss, which includes both audibility loss and noise-sensitivity. The special case of SNR90=∞ (i.e., Pc<90% in quiet) indicates audibility loss. Thus the SNR90 values, combined with the CLP groups (given by the symbols), can provide both the amount and the nature of consonant loss for each listener on a consonant-by-consonant basis.
The consonants in Fig. 10 are divided into three sets that, with the exception of ∕m∕, are same as the high-error set C1, low-error set C2, and average-error set C3 from Phatak and Allen (2007). Consonants from set C1={∕b∕,∕f∕,∕ð∕,∕v∕,∕θ∕} are difficult to recognize for both ANH and HI listeners. The ANH SNR90 values for the entire set C1 are all greater than −3 dB, and on an average, more than 20 HI listeners have C1 SNR90=∞. On the other hand, ANH scores for set C2={∕z∕,∕t∕,∕ʒ∕,∕s∕,∕∫∕} are very high (SNR90<−10 dB), but HI listeners have poor performance for these consonants too. On an average, more than 11 HI listeners have SNR90=∞ for set C2 consonants.
Table 3 shows that the mean PTAHF values for HI listeners with SNR90=∞ are relatively higher for C2 consonants (mean PTAHF>60 dB HL) than for the other two consonant sets. Phatak and Allen (2007) showed that the spectral energy in C2 consonants is concentrated at frequencies above 3 kHz, which could be obscured when the high-frequency audiometric thresholds are elevated. NH listeners benefit from this high-frequency speech information, which is not masked by a speech-weighted noise masker, but HI listeners are deprived of it due to their high-frequency hearing loss.
Table 3.
The number of HI listeners having SNR90=∞ and their mean PTAHF value for each consonant.
| Set | Consonant | HI group | Mean PTAHF (dB HL) | ||
|---|---|---|---|---|---|
| A (N=16) | M (N=3) | D (N=7) | |||
| C2 | ∕t∕ | 7 | 1 | 1 | 67.78 |
| ∕z∕ | 12 | 0 | 1 | 66.35 | |
| ∕ʒ∕ | 12 | 1 | 0 | 64.62 | |
| ∕s∕ | 11 | 1 | 2 | 64.46 | |
| ∕ʃ∕ | 7 | 0 | 0 | 61.43 | |
| C3 | ∕d∕ | 7 | 1 | 1 | 63.06 |
| ∕n∕ | 6 | 1 | 0 | 56.43 | |
| ∕m∕ | 5 | 0 | 0 | 55.50 | |
| ∕k∕ | 2 | 0 | 0 | 52.50 | |
| ∕ɡ∕ | 6 | 1 | 0 | 51.79 | |
| ∕p∕ | 3 | 0 | 0 | 46.67 | |
| C1 | ∕f∕ | 8 | 1 | 1 | 59.00 |
| ∕v∕ | 16 | 2 | 4 | 57.95 | |
| ∕b∕ | 13 | 2 | 4 | 56.71 | |
| ∕ð∕ | 16 | 2 | 7 | 57.90 | |
| ∕θ∕ | 16 | 3 | 7 | 57.50 | |
DISCUSSION
In this study we have analyzed the SNR differences between consonant recognition performances of HI and average NH listeners. Such an analysis was not possible with some of the past CM data on HI listeners, which were collected either in absence of masking noise (Walden and Montgomery, 1975; Bilger and Wang, 1976; Doyle et al., 1981) or at a single SNR (Dubno et al., 1982). The test-retest analysis shows that the results are consistent (r>0.95) for the six re-tested listeners (Fig. 1), indicating that the testing procedure is repeatable.
Festen and Plomp (1990) reported parallel psychometric functions of average NH (slope=21%∕dB) and average HI (slope=20.4%∕dB) listeners with sentences that suggest a score-independent constant SNR-loss. Data of Wilson et al. (2007) show that in multitalker babble masker, the relative slopes of NH and HI psychometric functions depend on the speech material. We found that the performance-SNR functions [i.e., Pe(SNR), Fig. 3a] of individual HI listeners for consonant recognition, measured using nonsense syllables in steady-state noise, are not parallel to the corresponding ANH function. Thus, the average consonant loss for individual HI listener is a function of the score [Fig. 3b]. This variation in SNR difference (i.e., the average consonant loss) is ignored in the traditional SRT-based measure of SNR-loss. The variation in consonant loss with performance level, indicated by the change in the slope of consonant loss curves, characterizes the nature of consonant loss (i.e., unintelligibility in quiet vs noise-sensitivity).
The SNR difference in HI and NH performances is consonant-dependent. Both HI and NH listeners have significant variability across consonants, which is obscured in an average-error measure by design. High consonant error does not necessarily imply high SNR difference for that consonant. A comparison with the corresponding ANH listener error is necessary for measuring the consonant-specific SNR deficit.3 The CLP is a compact graphical comparison of each HI listener to the average NH listener on a consonant-by-consonant basis (Fig. 5). The slopes of CLP curves separate the unintelligible consonants from the noise-sensitive ones. The two types of consonant loss, i.e., unintelligibility and noise-sensitivity, are related to Plomp’s (1978)A-factor (i.e., audibility) and D-factor (i.e., distortion or SNR-loss) losses, respectively. The CLPs reveal that the consonant loss for 16 of the 26 tested ears was dominated by the audibility loss, resulting in type A CLPs, which are characterized by average consonant loss curves with shallow slopes due to a majority of unintelligible consonants. Of the remaining ten HI ears, seven showed type D CLPs, which suggests that the consonant loss for these listeners was mostly due to noise-sensitivity or the SNR-loss. Listeners with type A CLP did not overcome audiometric loss as much as those with type D CLPs at their MCLs. However, there was no statistically significant difference between the audiograms of listeners with the two CLP types. A bilateral HI listener can have few but significant differences between CLPs for the two ears (Fig. 8). This suggests that the consonant loss depends, to some extent, on the differences in peripheral hearing other than the audiometric thresholds.
The audibility loss in HI listeners, quantified by large values of SNR90 (in many cases, SNR90=∞), was mostly restricted to the high-frequency C2 consonants (Fig. 10). While both ANH and HI listeners struggle with C1 consonants, only HI listeners with poorer high-frequency hearing performed poorly (SNR90=∞) for the high-frequency C2 consonants (Table 3), which are high-scoring consonants for the NH listeners (Phatak and Allen, 2007). Other than this relationship between high-frequency loss and C2 consonants, the exact distribution of consonants in the three CLP categories does not correlate with, and therefore cannot be predicted from, the audiograms.
CLPs could be used in clinical audiology to obtain a simple snapshot of the patient’s consonant perception. Collecting reliable confusion data is time consuming. The current CM experiment required approximately 3 h per subject. CLPs require only recognition scores (i.e., the CM diagonal element) and not individual confusions (i.e., the off-diagonal elements of CM). Reliable estimation of the recognition score does not require row sums as high as those required for estimating individual confusions. Also, CLP curves show significant variation in slope over a limited SNR range for HI listeners (i.e., for SNRHI>0 dB). By reducing the number of tokens of each consonant and the number of SNRs, the testing time can be reduced to 5–10 min.
The information obtained from such a short clinical test can be used to customize the rehabilitation therapy for a hearing aid or a cochlear implant patient. HI listeners trained on lexically difficult words show a significant improvement in speech recognition performance in noise (Burk and Humes, 2008). The duration of such training is generally long, spanning several weeks. This long-term training could be made shorter and more efficient by increasing the proportion of words containing unintelligible and noise-sensitive consonants for each listener. The information from the CLPs might also be used to optimize signal processing techniques in hearing aids. For example, if the unintelligible or the noise-sensitive consonants share some common acoustic features, then the hearing aid algorithms could be modified to enhance those particular types of features over others. Such an ear-specific processing could further “personalize” each hearing aid fitting.
The SNR-loss is intended to characterize the supra-threshold level loss (i.e., Plomp’s D-factor) and therefore one would expect it to be independent of the audio-metric thresholds. The flattening of average consonant loss curves at higher SNRs, due to the unintelligible consonants, indicates that audibility is not overcome at MCLs. It is impossible to know this information from a single performance point measure, such as ΔSNR50. It also raises doubts about the clinically measured ΔSNR50, using the QuickSIN recommended procedure, being a true measure of the audibility-independent SNR-loss. It is possible that even at levels as high as 85 dB SPL, speech may be below threshold at certain frequencies (Humes, 2007). Speech information is believed to have multiple cues, which may be redundant for a NH listener in the quiet condition (Jenstad, 2006). This redundancy would allow the HI listener to recognize speech even if elevated thresholds mask some speech cues. Such presentation levels may be incorrectly considered as supra-threshold presentation levels.
Another implication of this hypothesis is that the SNR-loss or the noise-sensitivity may be partially due to masking of noise-robust speech cues by elevated thresholds. Each speech cue has a different perceptual importance and noise-robustness. If the cue masked by the elevated thresholds is the most noise-robust cue for a given consonant, then the noise-robustness of that consonant will be reduced, turning it into a noise-sensitive consonant. For example, Blumstein and Stevens (1980) argued, using synthesized speech stimuli, that the release burst is the necessary and sufficient cue for the perception of stop plosives, and the formant movements are secondary cues. Using natural speech, Régnier and Allen (2008) clearly demonstrated that the release burst is also the most noise-robust cue for recognizing plosive ∕t∕. At MCL, HI listeners with high-frequency hearing loss have high scores for consonants ∕p∕, ∕t∕, and ∕k∕ in quiet, but not in the presence of noise. Under noisy conditions, ∕t∕-∕p∕-∕k∕ is the most common confusion for these consonants, which is caused by the high-frequency hearing loss (see Sec. 3E). Thus the elevated thresholds likely contribute to the noise-sensitivity. Therefore, it is critical to verify that the audiometric loss has been compensated with spectral shaping before estimating the SNR-loss.
Some past studies have concluded that the supra-threshold SNR-loss may be non-existent compared to the audibility loss (Lee and Humes, 1993; Zurek and Delhorne, 1987). Lee and Humes (1993) used meaningful sentences to measure the SNR-loss, which is the most common stimuli for measuring SNR-loss (Plomp, 1986; Killion et al., 2004). Context, due to meaning, grammar, prosody, etc., can partially compensate hearing deficits. Therefore words and sentences, though easier to recognize than nonsense syllables, can underestimate the SNR-loss. The ΔSNR50 measure with sentences are on an average 12 dB smaller than those measured with consonants (Fig. 2). Also, SNR-losses that exist for individual consonants, and which may exist for vowels, cannot be determined with an average measure like the word recognition score. Zurek and Delhorne (1987) used CV syllables, but they compared noise-masked normals with HI listeners. However, noise-masked elevated thresholds are not equivalent to a hearing loss, and additional hearing deficits exist in HI listeners that can affect speech perception (Humes et al., 1986). In many cases, a HI listener performs better than the corresponding noise-masked NH listener. A more relevant and perhaps more accurate comparison would be between an HI listener with spectral gain compensation for hearing loss and an average NH listener. Humes (2007) showed that the performance deficits in noise exist even after carefully compensating the audiometric losses of HI listeners. He attributed this SNR-loss to aging and differences in cognitive and central processing abilities. However, this loss could also be due to poor spectral and temporal resolution in the peripheral auditory system. A loss of resolution would lead to degradation of the spectral and temporal cues, which could affect the performance of subsequent auditory processing tasks that are involved in speech recognition, such as integration of speech cues across time and frequency (Allen and Li, 2009).
Since the purpose of our experiment was to analyze the effect of hearing loss on consonant perception, no spectral correction was provided to compensate for the listener’s hearing loss. Providing such correction will help the unintelligible consonants, but may not help the noise-sensitive consonants. Furthermore, the unintelligible consonants, after spectral correction, may not become low-loss consonants. Instead, they may still have noise-sensitivity due to hearing deficits other than the elevated thresholds. To answer these questions, this study is currently being repeated with spectrally corrected stimuli to compensate individual HI listener’s hearing loss (Li and Allen, 2009).
CONCLUSIONS
The key results in this study can be summarized as follows.
-
(1)
The CLP is a compact representation of the consonant-specific SNR differences over a range of performance for individual listeners (Fig. 5). It shows that the hearing loss renders some consonants unintelligible and reduces noise-robustness of other consonants. Audiometric loss affects some consonants at a presentation level as high as 85 dB SPL.
-
(2)
The SNR difference between HI and NH performances varies with the performance level (i.e. recognition score) (Fig. 3). This variation is ignored in the traditional ΔSNR50 metric for SNR-loss, which is measured at a single performance point (i.e., Pc=50%).
-
(3)
The loss in consonant recognition performance is consonant-specific. HI listeners with poorer hearing at and above 4 kHz show more loss for high-frequency consonants ∕s∕, ∕∫∕, ∕t∕, ∕z∕, and ∕ʒ∕ (Table 3).
-
(4)
Individual consonant losses, which determine the distribution of consonants in the CLP, cannot be predicted from the audiometric thresholds alone (Fig. 7).
-
(5)
Consonant confusions of HI listeners vary across the listeners and are, in many cases, significantly different from the ANH confusions (Fig. 9). Some HI confusions are a result of the high-frequency hearing loss (Sec. 3E).
-
(6)
Sentences are not the best stimuli for measuring the SNR-loss as the context information in sentences partially compensates the hearing loss. The ΔSNR50 values are about 12 dB greater for consonants than for sentences (Fig. 2).
ACKNOWLEDGMENTS
This research was supported by a University of Illinois grant. Partial salary support was provided by NIDCD (No. R03-DC06810) and by Cooperative Research and Development Agreements between the Clinical Investigation Regulatory Office, U.S. Army Medical Department and School and the Oticon Foundation, Copenhagen, Denmark. The opinions and assertions presented are the private views of the authors and are not to be construed as official or as necessarily reflecting the views of the Department of the Army, or the Department of Defense. The data collection expenses were covered through research funds provided by Etymotic Research and Phonak. Portions of this work were presented at the IHCON Meeting (Lake Tahoe, CA) in 2006, at the ARO Midwinter Meeting (Denver, CO), the AAS Conference (Scottsdale, AZ), and the Aging and Speech Communication Conference (Bloomington, IN) in 2007, and in the Department of Hearing and Speech Science Winter Workshop at the University of Maryland (College Park, MD) in 2008. We thank Ken Grant and Harvey Abrams for informative discussions and insights. Mary Cord and Matthew Makashay helped in QuickSIN level measurements.
Footnotes
With the recommended calibration procedures for QuickSIN (i.e., 0 VU input to the audiometer and 70 dB HL attenuator setting), the output level of the 1 kHz calibration tone is 88 dB SPL. At this level the most frequent peaks of the sentence stimuli are between 80 and 85 dB SPL. This measurement was done using GSI 61 digital audiometer, EARTONE 3A insert earphones, Zwislocki DB-100 coupler, and Larson Davis 800B sound level meter.
Complete documentation is available at http:∕∕www.ldc.upenn.edu∕Catalog∕docs∕LDC2005S22∕doc.txt.
While there is a variability in the consonant perception across the NH listeners, it is much greater across HI listeners. For example, the low-error, average-error, and high-error consonant sets, observed in study of Phatak et al. (2008), were the same for all NH listeners tested. Such an error-based consonant categorization is different for each HI listener. Therefore, the consonant CMs can be averaged across NH listeners to obtain ANH CMs, but such an average across HI listeners is statistically unstable.
References
- Allen, J. B., and Li, F. (2009). “Speech perception and cochlear signal processing,” IEEE Signal Process. Mag. 26, 73–77. 10.1109/MSP.2009.932564 [DOI] [Google Scholar]
- Bilger, R. C., and Wang, M. D. (1976). “Consonant confusions in patients with sensoryneural hearing loss,” J. Speech Hear. Res. 19, 718–749. [DOI] [PubMed] [Google Scholar]
- Blumstein, S. E., and Stevens, K. N. (1980). “Perceptual invariance and onset spectra for stop consonants in different vowel environments,” J. Acoust. Soc. Am. 67, 648–662. 10.1121/1.383890 [DOI] [PubMed] [Google Scholar]
- Boothroyd, A., and Nittrouer, S. (1988). “Mathematical treatment of context effects in phoneme and word recognition,” J. Acoust. Soc. Am. 84, 101–114. 10.1121/1.396976 [DOI] [PubMed] [Google Scholar]
- Burk, M. H., and Humes, L. E. (2008). “Effects of long-term training on aided speech-recognition performance in noise in older adults,” J. Speech Lang. Hear. Res. 51, 759–771. 10.1044/1092-4388(2008/054) [DOI] [PMC free article] [PubMed] [Google Scholar]
- Cooper, K. N., Delattre, P. C., Liberman, A. M., Borst, J. M., and Gerstman, L. J. (1952). “Some experiments on perception of synthetic speech sounds,” J. Acoust. Soc. Am. 24, 597–606. 10.1121/1.1906940 [DOI] [Google Scholar]
- Doyle, K. J., Danhauer, J. L., and Edgerton, B. J. (1981). “Features from normal and sensorinueral listeners’ nonsense syllable test errors,” Ear Hear. 2, 117–121. 10.1097/00003446-198105000-00006 [DOI] [PubMed] [Google Scholar]
- Dubno, J. R., Dirks, D. D., and Langhofer, L. R. (1982). “Evaluation of hearing-impaired listeners using a nonsense-syllable test II. Syllable recognition and consonant confusion patterns,” J. Speech Hear. Res. 25, 141–148. [DOI] [PubMed] [Google Scholar]
- Festen, J. M., and Plomp, R. (1990). “Effects of fluctuating noise and interfering speech on the speech-reception threshold for impaired and normal hearing,” J. Acoust. Soc. Am. 88, 1725–1736. 10.1121/1.400247 [DOI] [PubMed] [Google Scholar]
- Fousek, P., Svojanovsky, P., Grezl, F., and Hermansky, H. (2004). “New nonsense syllables database—Analyses and preliminary ASR experiments,” in Proceedings of the International Conference on Spoken Language Processing (ICSLP), pp. 2749–2752.
- French, N. R., and Steinberg, J. C. (1947). “Factors governing the intelligibility of speech sounds,” J. Acoust. Soc. Am. 19, 90–119. 10.1121/1.1916407 [DOI] [Google Scholar]
- Gordon-Salant, S. (1985). “Phoneme feature perception in noise by normal-hearing and hearing-impaired subjects,” J. Speech Hear. Res. 28, 87–95. [DOI] [PubMed] [Google Scholar]
- Helfer, K. S. (1994). “Binaural cues and consonant perception in reverberation and noise,” J. Speech Hear. Res. 37, 429–438. [DOI] [PubMed] [Google Scholar]
- Hudgins, C. V., Hawkins, J. E., Jr., Karlin, J. E., and Stevens, S. S. (1947). “The development of recorded auditory tests for measuring hearing loss for speech,” Laryngoscope 57, 57–89. 10.1288/00005537-194701000-00005 [DOI] [PubMed] [Google Scholar]
- Humes, L. E. (2007). “The contributions of audibility and cognitive factors to the benefit provided by amplified speech to older adults,” J. Am. Acad. Audiol 18, 590–603. 10.3766/jaaa.18.7.6 [DOI] [PubMed] [Google Scholar]
- Humes, L. E., Dirks, D. D., Bell, T. S., and Kincaid, G. E. (1987). “Recognition of nonsense syllables by hearing-impaired listeners and by noise-masked normal listeners,” J. Acoust. Soc. Am. 81, 765–773. 10.1121/1.394845 [DOI] [PubMed] [Google Scholar]
- Jenstad, L. (2006). “Speech perception and older adults: Implications for amplification,” Proceedings of the Hearing Care for Adults, Chap. 5, pp. 57–70.
- Killion, M. C. (1997). “SNR loss: I can hear what people say, I can’t understand them,” Hear. Rev. 4, 8–14. [Google Scholar]
- Killion, M. C., Niquette, P., Gudmundsen, G. I., Revit, L. J., and Banerjee, S. (2004). “Development of a quick speech-in-noise test for measuring signal-to-noise ratio loss in normal-hearing and hearing-impaired listeners,” J. Acoust. Soc. Am. 116, 2395–2405. 10.1121/1.1784440 [DOI] [PubMed] [Google Scholar]
- Lee, L. W., and Humes, L. E. (1993). “Evaluating a speech-reception threshold model for hearing-impaired listeners,” J. Acoust. Soc. Am. 93, 2879–2885. 10.1121/1.405807 [DOI] [PubMed] [Google Scholar]
- Li, F., and Allen, J. B. (2009). “Consonant identification for hearing impaired listeners,” J. Acoust. Soc. Am. 125, 2534. [Google Scholar]
- Licklider, J. C. R. (1948). “The influence of internal phase relations upon the masking of speech by white noise,” J. Acoust. Soc. Am. 20, 150–159. 10.1121/1.1906358 [DOI] [Google Scholar]
- Lobdell, B., and Allen, J. B. (2007). “Modeling and using the vu-meter (volume unit meter) with comparisons to root-mean-square speech levels,” J. Acoust. Soc. Am. 121, 279–285. 10.1121/1.2387130 [DOI] [PubMed] [Google Scholar]
- Miller, G. A., and Nicely, P. E. (1955). “An analysis of perceptual confusions among some English consonants,” J. Acoust. Soc. Am. 27, 338–352. 10.1121/1.1907526 [DOI] [Google Scholar]
- Phatak, S. A., and Allen, J. B. (2007). “Consonant and vowel confusions in speech-weighted noise,” J. Acoust. Soc. Am. 121, 2312–2326. 10.1121/1.2642397 [DOI] [PubMed] [Google Scholar]
- Phatak, S. A., Lovitt, A., and Allen, J. B. (2008). “Consonant confusions in white noise,” J. Acoust. Soc. Am. 124, 1220–1233. 10.1121/1.2913251 [DOI] [PubMed] [Google Scholar]
- Pichora-Fuller, M. K., Schneider, B. A., and Daneman, M. (1995). “How young and old adults listen to and remember speech in noise,” J. Acoust. Soc. Am. 97, 593–608. 10.1121/1.412282 [DOI] [PubMed] [Google Scholar]
- Plomp, R. (1978). “Auditory handicap of hearing impairment and the limited benefit of hearing aids,” J. Acoust. Soc. Am. 63, 533–549. 10.1121/1.381753 [DOI] [PubMed] [Google Scholar]
- Plomp, R. (1986). “A signal-to-noise ratio model for the speech-reception threshold of the hearing impaired,” J. Speech Hear. Res. 29, 146–154. [DOI] [PubMed] [Google Scholar]
- QuickSIN Manual (2006). QuickSIN Speech-in-Noise Test (Version 1.3), Etymotic Research, Inc., 1.3 ed.
- Régnier, M., and Allen, J. B. (2008). “A method to identify noise-robust perceptual features: Application for consonant ∕t∕,” J. Acoust. Soc. Am. 123, 2801–2814. 10.1121/1.2897915 [DOI] [PubMed] [Google Scholar]
- Tillman, T. W., and Olsen, W. O. (1973). “Speech audiometry,” in Modern Developments in Audiology, 2nd ed., edited by Jerger J. (Academic, New York: ), pp. 37–74. [Google Scholar]
- Walden, B. E., and Montgomery, A. A. (1975). “Dimensions of consonant perception in normal and hearing-impaired listeners,” J. Speech Hear. Res. 18, 444–455. [DOI] [PubMed] [Google Scholar]
- Wilson, R. H., McArdle, R. A., and Smith, S. L. (2007). “An evaluation of the BKB-SIN, HINT, QuickSIN, and WIN materials on listeners with normal hearing and listeners with hearing loss,” J. Speech Lang. Hear. Res. 50, 844–856. 10.1044/1092-4388(2007/059) [DOI] [PubMed] [Google Scholar]
- Zurek, P. M., and Delhorne, L. A. (1987). “Consonant reception in noise by listeners with mild and moderate sensorineural hearing loss,” J. Acoust. Soc. Am. 82, 1548–1559. 10.1121/1.395145 [DOI] [PubMed] [Google Scholar]


