

Abstract
Objectives
To examine the association between aging and physical function in men by testing a theoretically-based model of aging, hormones, body composition, strength, and physical function with data obtained from men enrolled in the Boston Area Community Health/Bone (BACH/Bone) Survey.
Design
Cross-sectional, observational survey.
Setting
Population-based
Participants
810 Black, Hispanic, and White Boston randomly-selected men ages of 30–79 y.
Measurements
Testosterone, estradiol, sex hormone-binding globulin, lean and fat mass, grip strength, and summated index of physical function (derived from walk and chair stand tests).
Results
Measures of grip strength and physical function declined strongly associated with age. For instance, 10 y of aging was associated with a 0.49-point difference (scale: 0–7) in physical function. Age differences in total testosterone and estradiol concentrations were smaller than age differences in their free fractions. Weak or non-significant age-adjusted correlations were observed between hormones and measures of physical function. Path analysis, however, revealed a positive association between testosterone and appendicular lean mass, and a strong negative association between testosterone and total fat mass. Lean and fat mass, in turn, were strongly associated with grip strength and physical function, indicating the possibility of testosterone influencing physical function via indirect associations with body composition.
Conclusions
The age-related decline in serum testosterone concentration in men has a relatively weak association with physical strength and functional outcomes via its associations with lean and fat mass.
Keywords: aging, androgens, body composition, estrogens, men, physical function, population studies
INTRODUCTION
In men, aging is associated with loss of muscle mass, muscle strength, and declines in physical function with associated increases in the prevalence of frailty, functional limitations, dependency, and osteoporotic fractures 1, 2. At the same time, the level of male sex hormones appears to decline. This is clearly documented for testosterone 3, 4, while age declines in estradiol are less clear 5, 6. Observational 7-10 and interventional 11-15 data show that higher sex hormone levels improve body composition, including increasing lean mass and decreasing fat mass. Improvements in body composition should have downstream influences on measures of physical performance and function, given their known association with muscle strength 1, 2. However, studies in racially diverse men are rare, there are limited data on the influence of sex hormones on physical function, and few studies have tested whether the observed associations of age-related changes in sex hormones on physical function are mediated by improvements in body composition.
To address these concerns, we examined a theoretically-based model of aging, sex hormones, body composition, strength, and physical function with data obtained from men enrolled in the Boston Area Community Health/Bone (BACH/Bone) Survey, a racially and ethnically diverse population-based random sample of men between the ages of 30 and 79 y. We hypothesize that age-related declines in physical function will be mediated by sex hormones, mainly via their associations with lean body mass.
METHODS
Study sample
Data were obtained from men enrolled in BACH/Bone, which is a cross-sectional observational study of skeletal health and related outcomes in 1,219 (of 1,877 eligible, 65% response rate) randomly selected Black, Hispanic, and White male Boston, MA residents aged 30 to 79 y 16. Persons of other racial/ethnic backgrounds were not enrolled. BACH/Bone subjects were a subset of 2,301 men previously enrolled in the parent Boston Area Community Health (BACH) Survey; full details of the BACH survey have been published previously 17. Study protocols were approved by Institutional Review Boards at New England Research Institutes (NERI) and Boston University School of Medicine (BUSM). All participants gave written informed consent separately for participation in each study.
Data collection
Trained staff at NERI and the BUSM’s General Clinical Research Center (GCRC) conducted interviews and measurements for BACH and BACH/Bone, respectively. Data collection for BACH generally occurred in participants’ homes while data collection in BACH/Bone occurred at the BUSM GCRC. Age, education, income, self-rated health, and smoking status were obtained by self-report. Physical activity level was measured using the Physical Activity for the Elderly (PASE) scale 18. Frequency and duration of leisure activities, paid or unpaid work (hours/week), and housework and similar duties (yes/no) over the past week were recorded for each subject. The PASE score was computed by multiplying the amount of time spent in each activity (hours/week) or participation (yes/no) in each activity by empirical item weights (derived from regressions of component scores developed from a 3-day physical activity monitor, 3-day physical activity diary, and a global self-report of physical activity on responses to the PASE in a community-dwelling sample of 277 older adults 18) and summing over all activities. Measurements of subjects’ height and weight were obtained using a stadiometer and digital scale, respectively. A non-fasting blood sample was collected close to waking time (median time since awakening 3 h 38 min). Serum samples were stored at −80° C until analysis.
Serum measurements
Testosterone, luteinizing hormone (LH), and sex hormone-binding globulin (SHBG) were measured at the Children’s Hospital Medical Center Research Laboratories (Boston, MA) by competitive electrochemiluminescence immunoassays on the 2010 Elecsys system (Roche Diagnostics, Indianapolis, IN). The lower limits of detection for testosterone, LH, and SHBG were 2 ng/dL (0.07 nmol/L), 0.10 IU/L, and 3 nmol/L, respectively. The inter-assay coefficients of variation (CV) for testosterone at concentrations of 24–700 ng/dL (0.83–24.31 nmol/L) were 7.4–1.7%, 5.2–2.0% for LH at concentrations of 0.5–50.7 IU/L, and 2.4–2.7% for SHBG at concentrations between 25–95 nmol/L. Estradiol was measured at the Mayo Clinic Core Laboratory (Rochester, MN) with liquid chromatography-tandem mass spectrometry. The lower limit of detection was 12.5 pg/mL (46 pmol/L). To reliably measure estradiol levels in the low range, estradiol values less than 12.5 pg/mL (46 pmol/L) were calculated by manual integration of chromatograms. The inter-assay CVs for estradiol concentrations 1.25–60 pg/mL (4.6–220 pmol/L) ranged between 13.4–6.0%. Free testosterone and estradiol concentrations were calculated from total testosterone or estradiol and SHBG concentrations using mass action equations 19, 20.
Measures of body composition
Measurements of lean mass and fat mass were obtained from whole body dual energy x-ray absorptiometry (DXA) scans using a QDR 4500W densitometer (Hologic, Inc., Waltham, MA) located at the BUSM GCRC. All mass quantities reported here exclude the head. Lean mass was calculated by subtracting bone mineral mass from nonfat mass, and appendicular lean mass (ALM) was calculated by adding the (non-bone) lean tissue mass in the arms and legs. The DXA system was monitored weekly for drift.
Measures of strength and physical function
Hand grip strength was measured using a Jamar Hydraulic Hand Dynamometer (Sammons Preston, Bolingbrook, IL), which measures isometric grip force. Subjects were instructed to exert maximum effort for three seconds during two trials, each separated by a 1-min rest. The maximum result was used for analysis.
The physical function tests included a timed walk test (time needed to walk 50 ft or 15.24 meters) and a chair stand test (time needed to stand up and sit down five times with arms folded) 21. Following Guralnik et al 21, we created a composite “physical function” variable. Those completing the walk and chair stand tests were assigned scores of 1–4, corresponding to the quartiles (derived from our population) of speeds in completing each task, with the fastest speeds scored 4. The cutpoints for walking speed are as follows: quartile 1 (≤1.18 meters/s); quartile 2 (>1.18–1.3 meters/s); quartile 3 (>1.3–1.4 meters/s); quartile 4 (>1.4 meters/s). The cutpoints for chair stand speed are: quartile 1 (≤0.313 stands/s); quartile 2 (>0.313–0.36 stands/s); quartile 3 (>0.36–0.43 stands/s); quartile 4 (>0.43 stands/s). Those who could not complete the test were assigned a score of 0. The two items were summed to a final score with possible range of 0 to 8. In actuality, only one subject was not able to complete the walk task, so we included that subject with those who were in the slowest quartile of walking speed. Thus, the score ranges from 0 to 7, with higher scores indicating better physical function.
Analysis samples
Of the 1,219 men in BACH/Bone, 10 men did not have DXA scans performed and 178 did not have their blood drawn in BACH. Of the remaining 1,031, we excluded 38 who were missing fat or lean mass, 18 men on medications that are known to affect sex hormone levels (GnRH agonists and antagonists, androgens, estrogens, progestins, 5-α-reductase inhibitors, ketoconazole, and clomiphine), and 12 men currently undergoing cancer treatment. An additional 141 men were missing testosterone or estradiol values and 12 men with extreme outlying values (≥ 4 standard deviations from mean) of testosterone or estradiol were also removed. This left 810 men available as a base for analysis. From this base analysis sample, we used the maximum available data for each of the outcome measures [walk test, N = 808; chair stand test, N = 804, grip strength, N = 678 (54 men were coded as missing due to dynamometer malfunction)].
Statistical methodology
Sampling weights were used to produce estimates for means and percentages that are representative of the Black, Hispanic, and White male population in Boston, MA between the ages of 30 and 79 y. Sampling weights account for the design effect of over-sampling of particular age and racial and ethnic groups 22. Statistical analyses were conducted using SUDAAN software (Research Triangle Institute, Research Triangle Park, NC).
Exploratory graphical analysis was conducted using generalized additive models (GAM) 23. Partial correlation coefficients (adjusted for age; rp) were used to estimate the linear relation (judged by visual display with GAM) between continuous versions of the hormones, body composition, strength, and physical function measures.
Based upon existing literature and our own prior studies 7, 24, we constructed a path model 25 depicting the total association between age and the physical function score. The model is displayed in Figure 1 (upper left). Here the association between age and physical function is depicted along overlapping paths, groups of which correspond to the mediating influences of hormones, physical activity, body composition, grip strength, and physical function, as well as a residual, “direct” path from age to physical function. In the model displayed, the influence of hormones is assumed to be mediated by estradiol and body composition in the form of appendicular lean and total body fat mass (although other variations, not shown, were also assessed; see Results). Fat mass was assumed to be positively associated with lean mass.
FIGURE 1.
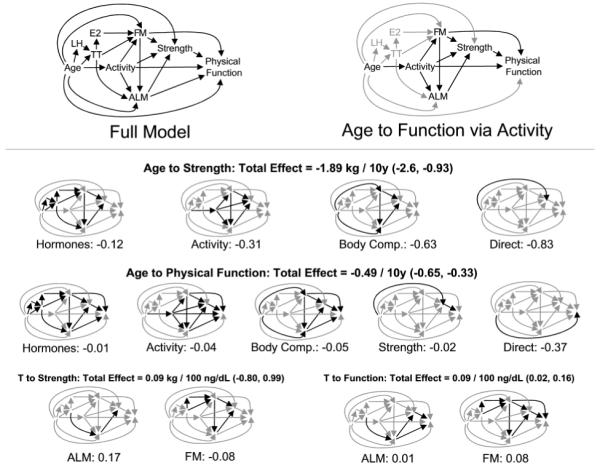
Path model depicting multiple paths from age to physical function. Hypothesized associations are depicted in the full model drawing (upper left). The model asserts that the association between age and physical function lies along many potential pathways, for instance through physical activity, which itself may influence body composition, strength, and physical function via direct and indirect means (upper right). Total estimated associations (displayed here accompanied by 95% confidence intervals) between age or testosterone and downstream outcomes may be decomposed into components accounted for by the different covariate groups (smaller drawings). The first row of these depicts the model’s decoupling of the influence of age on strength into components lying along the hormonal pathway (including portions mediated by hormones’ influence on body composition), physical activity (including portions mediated by the relation between activity and body composition), body composition (discounting the effects that pass through it via the hormonal and physical activity mechanisms), and the residual, “direct” association of age with strength that may be obtained from Table 5. In this way the model demonstrates that while much of the association between age and strength can be accounted for by the combined influences of hormones, activity, and body composition, a substantial direct association remains. All of these factors combined account for a relatively small proportion of the association between age and physical function. Meanwhile, the positive association between testosterone and strength as mediated by lean mass is partially offset by the negative associations mediated by fat mass, so that the overall relation between testosterone and strength is non-significant (lower left). At the same time, the bulk of the significant positive association between testosterone and physical function appears to be mediated by the negative association between fat mass and testosterone (lower right). Abbreviations: appendicular lean mass (ALM), estradiol (E2), fat mass (FM), luteinizing hormone (LH), testosterone (TT).
This model may be represented algebraically by a series of eight equations (see Table 3). Here each outcome variable is related to each of its immediate predictors in a simple or multiple linear regression model, and all equations are assumed to hold simultaneously. Regression effects quantify the direct associations symbolized by arrows in Figure 1. For instance, the direct association between age and testosterone corresponds to the coefficient α3 in equation 3. In addition to those variables depicted in Figure 1, height was included in models of lean and fat mass as an index of overall body size. Residual error terms (not depicted in Figure 1) for all combinations of outcome variables were assumed to be uncorrelated, with the following exception: the model allowed for the residuals of total / free testosterone to be associated with fat and lean mass, allowing for a feedback relation between adiposity and serum testosterone levels.
TABLE 3.
Estimated* regression effects, with standard errors in brackets. Results are given for each model equation shown in Table 4
| Equation Number and Outcome Variable | ||||||||
|---|---|---|---|---|---|---|---|---|
| (1) | (2) | (3) | (4) | (5) | (6) | (7) | (8) | |
| Predictor | PASE | LH | TT | E2 | FM | ALM | GRIP STRENGTH |
PHYSICAL FUNCTION |
| LH | 1.30 | |||||||
| [0.86, 1.75] | ||||||||
| TT | 0.22 | −2.81 | 0.13 | |||||
| [0.16, 0.27] | [−4.28, −1.33] | [−0.42, 0.68] | ||||||
| E2 | 2.24 | |||||||
| [1.06, 3.41] | ||||||||
| Height | 0.22 | 0.26 | ||||||
| [0.11, 0.33] | [0.21, 0.31] | |||||||
| PASE | −0.33 | 0.57 | 0.93 | 0.14 | ||||
| [−1.13, 0.47] | [0.28, 0.85] | [−0.27, 2.11] | [−0.05, 0.34] | |||||
| FM | 0.15 | −0.17 | −0.04 | |||||
| [0.11, 0.20] | [−0.35, 0.01] | [−0.06, −0.01] | ||||||
| ALM | 1.34 | 0.02 | ||||||
| [0.97, 1.72] | [−0.03, 0.07] | |||||||
| Grip | 0.03 | |||||||
| [0.003, 0.05] | ||||||||
| Age | −0.19 | 0.07 | −0.22 | 0.33 | −0.55 | −0.83 | −0.38 | |
| [−0.27, −0.10] | [0.03, 0.10] | [−0.40, −0.04] | [−0.42, 1.08] | [−0.82, −0.29] | [−1.81, 0.15] | [−0.56, −0.19] | ||
| Model R2 | 0.04 | 0.03 | 0.12 | 0.18 | 0.17 | 0.45 | 0.23 | 0.16 |
Estimates weighted according to sampling design (see Methods).
Abbreviations and units: luteinizing hormone (log-transformed LH, IU/L), total testosterone (TT, 100 ng/dL), total estradiol (E2, 10 pg/mL), Physical Activity Scale for the Elderly (PASE, 1 SD), fat and appendicular lean mass (FM and ALM, kg), grip (kg), age (10 y).
Listed below is the system of equations used to estimate the parameters in this table. Regression parameters α, λ, β, γ, and ζ quantify the association between upstream variables and downstream outcome measures including physical activity (PASE), hormones [testosterone (T), luteinizing hormone (LH), and estradiol (E2)], body composition [appendicular lean and total body fat mass (ALM and FM)], grip strength, and physical function, respectively, while ε indicates error terms.
PASE = λ0 + λ1Age + ε3
LH = α0 + α1Age + ε1
T = α2 + α3Age + α4LH + ε4
E2 = α5 + α6T + ε5
FM = β0 + β1Age + β2T + β3E2 + β4Height + β5PASE + ε6
ALM = β6 + β7Age + β8T + β9Height + β10PASE + β11FM + ε7
Grip Strength = γ0 + γ1Age + γ2PASE + γ3FM + γ4ALM + ε8
Phys. Function = ζ0 + ζ1Age + ζ2PASE + ζ3FM + ζ4ALM + ζ5Grip + ε9
Models were estimated using the Mplus software system version 4.1 (Muthén and Muthén, Los Angeles, CA), which fits path and latent variable models to complex survey data using maximum likelihood. All results were probability weighted in accordance with the complex sampling design of BACH/Bone, and may therefore be referenced to the greater Boston population. Overall model fit was assessed using the comparative fit index (CFI) and root mean square error of approximation (RMSEA) statistics 26, which are based on comparisons of observed correlations (Table 3) to those implied by the model. By convention, models are said to fit the data well if CFI ≥ 0.95 and RMSEA ≤ 0.05. Competing models’ adherence to the data was assessed using the Akaike Information Criterion (AIC), for which lower values denote better fit 27. The significance of individual estimated of path coefficients were assessed using Wald-type statistics. The multiple correlation between each outcome and its predictors was quantified using R2 statistics. Results were considered statistically significant if corresponding null hypotheses could be rejected at the 0.05 level.
Following estimation, the portion of the association between any two variables that is mediated by a particular pathway was then computed by multiplying the estimated coefficients lying along those paths.
RESULTS
Table 1 shows descriptive characteristics of the analysis sample. Mean age was 46.3 ± 12.4 y. Twenty-seven percent of the sample self-identified their racial/ethnic group as Black, whereas 33% were Hispanic, and 40% were White. Average weight was 87.8 kg. Subjects rated themselves in generally good health, with only 12% reporting fair or poor health, but 26% percent were current smokers and 9% reported drinking more than three alcoholic drinks per day.
TABLE 1.
Study sample characteristics (N=810)
| Variable | Mean ± Standard Deviation or N (Percent)† |
|---|---|
| Age, yr | 46.3 ± 12.4 |
| Race / Ethnicity | |
| Black | 220 (27.2%) |
| Hispanic | 267 (33.0%) |
| White | 323 (39.9%) |
| Education, yr | 15.3 ± 4.0 |
| Household income | |
| < $10k | 190 (15.4%) |
| $10k–29,9k | 219 (20.1%) |
| $30k–69,9k | 218 (32.8%) |
| ≥ $70k | 149 (31.8%) |
| Weight, kg | 87.8 ± 15.0 |
| Height, cm | 176.2 ± 7.4 |
| Self-rated health | |
| Excellent | 139 (21.7%) |
| Very Good | 227 (37.1%) |
| Good | 291 (29.8%) |
| Fair/Poor | 153 (11.5%) |
| Smoking | |
| Never | 320 (45.4%) |
| Former | 251 (28.4%) |
| Current | 236 (26.3%) |
| Alcohol, drinks/day | |
| 0 | 247 (23.1%) |
| < 1 | 275 (39.2%) |
| 1–3 | 188 (28.4%) |
| > 3 | 99 (9.4%) |
| Total testosterone, ng/dL‡ | 438.9 ± 180.1 |
| Free testosterone, ng/dL‡ | 9.0 ± 3.5*** |
| Total estradiol, pg/mL§ | 23.7 ± 9.2 |
| Free estradiol, pg/mL§ | 0.7 ± 0.3** |
| Luteinizing hormone, IU/L¶ | 4.6 ± 1.6*** |
| Fat mass, kg | 21.9 ± 8.3 |
| Appendicular lean mass, kg | 26.7 ± 4.1*** |
| Physical activity (PASE) | 193 ± 112*** |
| Grip strength, kg | 38.3 ± 11.1*** |
| Walking speed, meters/s | 1.4 ± 0.2*** |
| Chair stand speed, stands/s | 0.4 ± 0.1*** |
| Physical function score (0–7) | 4.2 ± 2.0*** |
Age trend, p < .05
Age trend, p < .01
Age trend, p < .001
With the exception of race/ethnicity, estimates are weighted according to sampling design (see Methods ).
To convert nmol/L, multiply values by 0.0347.
To convert pmol/L, multiply values by 3.671
Geometric means have been transformed from the natural log scale to original units for presentation. Sample sizes (N) vary according to missing data.
Mean values for the sex hormones, body composition, strength, and physical function and p-values for their cross-sectional age trends are displayed in Table 1. With the exception of LH and fat mass, all of these parameters declined with age. Total testosterone declined 12.2 ng/dL per 10 y of age (P = .16) and total estradiol did not change with age. Free testosterone and estradiol declined strongly with age (both P < .01), as did lean mass, physical activity, grip strength, walking speed, and chair stand speed (all P < .001). As shown in Figure 2, the composite physical function score declined significantly with age (−0.49 per 10 y of age, P < .001).
FIGURE 2.

Physical function score versus age, with jitter applied for visual clarity. The close agreement between means by decade (grey circles, with confidence intervals), a GAM fit via penalized smoothing splines (black line), and a simple linear regression fit (grey line), indicates that linear regression provides a reasonable summary of the cross-sectional association between age and physical function.
Age-adjusted partial correlations between the variables of interest in this analysis are shown in Table 2. The sex hormones were strongly correlated with one another. Total testosterone was negatively correlated with fat mass (rp = −0.34) and positively correlated with walking speed (rp = 0.12) but not with grip strength, chair stand, or the physical function composite. Free testosterone was negatively correlated with fat mass. Correlations between estradiol and body composition were comparatively weaker, but free estradiol was significantly and positively correlated with lean and fat mass. Lean mass showed a very strong positive correlation (rp = 0.41) with grip strength. The measures of strength and physical function were correlated with one another.
TABLE 2.
Age-adjusted Pearson correlations* between sex hormones, body composition, grip strength, and physical function
| Variable | TT | FT | E2 | FE2 | ALM | FM | Grip | Walking Speed† |
Chair Speed† |
Physical Function‡ |
|---|---|---|---|---|---|---|---|---|---|---|
| TT | -- | 0.83 | 0.41 | 0.28 | −0.14 | −0.34 | 0.06 | 0.12 | 0.02 | 0.06 |
| FT | <.001 | -- | 0.39 | 0.41 | −0.07 | −0.23 | 0.04 | 0.08 | 0.01 | 0.04 |
| E2 | <.001 | <.001 | -- | 0.96 | 0.12 | 0.08 | 0.04 | 0.02 | 0.03 | 0.05 |
| FE2 | <.001 | <.001 | <.001 | -- | 0.16 | 0.14 | 0.02 | 0.001 | 0.02 | 0.04 |
| ALM | .07 | .33 | .07 | <.01 | -- | 0.44 | 0.41 | 0.08 | 0.02 | 0.08 |
| FM | <.001 | <.001 | .11 | <.01 | <.001 | -- | 0.06 | −0.18 | −0.09 | −0.13 |
| Grip | .47 | .63 | .62 | .75 | <.001 | .47 | -- | 0.17 | 0.25 | 0.30 |
| Walking Speed | .01 | .11 | .73 | .98 | .09 | <.001 | <.01 | -- | 0.36 | 0.74 |
| Chair Speed | .79 | .87 | .59 | .62 | .76 | .12 | <.001 | <.001 | -- | 0.75 |
| Physical Function | .32 | .53 | .39 | .43 | .15 | .04 | <.001 | <.001 | <.001 | -- |
Estimates weighted according to sampling design (see Methods).
Subjects who were unable to perform the walk (N = 1) and chair stand test (N = 22) were coded as missing.
Composite physical function score (walk plus chair; see Methods). Higher scores indicate better physical function.
Bolded correlation coefficients are significant at P < .05. Significance levels are displayed in the grey highlighted areas below the diagonal.
Abbreviations: total testosterone (TT), free testosterone (FT), total estradiol (E2), free estradiol (FE2), appendicular lean mass (ALM), and fat mass (FM).
Table 3 shows the system of equations based on the hypothesized model shown in Figure 1. Regression parameters α, λ, β, γ, and ζ quantify the association between upstream variables and downstream outcome measures including hormones [testosterone (T), luteinizing hormone (LH), and estradiol (E2)], physical activity (PASE), body composition [lean and fat mass (ALM and FM)], strength (grip), and physical function, respectively, while ε indicates error terms.
Estimated path coefficients and R2 statistics for each model equation are given in Table 3. We observed statistically significant direct associations between almost all pairs of variables depicted in Figure 1. For instance, the model implies a cross-sectional increase of 0.15 kg lean mass per 1 kg increase in fat mass, with a corresponding 95% confidence interval of 0.11–0.20 kg. The positive association between testosterone and lean mass (0.13 kg per 100 ng/dL increase in testosterone, 95% CI: −0.42, 0.68) and the negative association between testosterone and fat mass (−2.81 kg per 100 ng/dL increase in testosterone, 95% CI: −4.28, −1.33) were in the expected directions once relevant control variables were included. Analyses indicated that the model fit the data well (CFI = 0.97; RMSEA = 0.037). A competing model hypothesizing additional, direct associations between testosterone, estradiol, and physical function was judged inferior by AIC, with these additional associations non-significant, and is not shown.
The decomposed associations of age and total testosterone on strength and function are given in the lower panel of Figure 1. Here we observe that while approximately 44% (−0.83/−1.89) of the total association between age and grip strength is mediated by the combined influences of hormone concentrations, physical activity, and body composition, only about 24% (−0.12/−0.49) of the association between age and physical function is mediated by those covariates and strength itself. Meanwhile, lean and fat mass appear to exercise offsetting influences on the association between testosterone and strength, but convergent influences (mainly via fat mass) contributing to the significant positive association between testosterone concentrations and physical function. While we present data for the total fractions of testosterone and estradiol, models employing the free fractions yielded very similar results.
DISCUSSION
In this study of randomly-selected, racially and ethnically diverse men, appreciable cross-sectional age-related declines in muscle strength and physical function were confirmed. Testing of the hypothesized pathway from age to strength and physical function through sex hormones and body composition revealed important insights about the role of sex hormones in accounting for the observed age differences in muscle strength and physical function. Namely, the testosterone level (but not the estradiol level) appears to exert its influence on these outcomes indirectly via its impact on lean and fat mass. Even allowing for these associations, age continues to exert a strong and direct influence on muscle strength and physical function.
The mechanisms by which sex hormones influence body composition, and by extension, strength and physical performance, are only partly understood. Possible biological mechanisms include the effects of testosterone on regulation of mesenchymal stem cell differentiation 28, 29 and muscle protein synthesis 30, 31 through androgen receptor-mediated pathways 29. Testosterone could also indirectly affect body composition through its effects on adiponectin, leptin, or inflammatory pathways 32-35. Consistent with the observations, observational studies in men show that age-related declines in testosterone levels influence lean and fat mass 8, 36, muscle strength 7-10, 36, and physical function 9, 10, 24, observations which have been confirmed in randomized clinical trials of testosterone administration 31, 37-40. However, not all studies are in agreement, particularly with regard to the association of the testosterone level with measured physical performance, with a number of observational studies 36, 41, 42 and clinical trials 11, 12, 43-45 showing no impact. Results from the current study are more in line with these latter studies, insofar as testosterone had no marginal or direct association with physical performance. Estrogen receptors are present in the skeletal muscle of men with inactivating mutations of the CYP19 aromatase gene and these men have decreased lean body mass and increased fat mass 46. Relatively few studies have examined the role of estradiol in body composition, strength, and physical function in men, but consistent with our results, the available data show little association of the estradiol level with strength 47, 48, body composition 48, or physical performance 47 in men. There are however, limited data to the contrary 9.
While some studies have shown that body composition is associated with physical function 49 others are in conflict. Indeed, alterations in body composition (i.e., increased lean and decreased fat mass) attributable to androgen administration have been shown to occur without accompanying changes in muscle strength and physical function 11, 12, 50. Part of this may be due a lack of appreciation in the epidemiologic literature that testosterone increases maximal voluntary strength of large limb girdle muscles but does not affect specific force (strength per unit muscle mass) 39. The dynamometers which have been widely used in epidemiologic studies (including the current study) do not measure maximal voluntary strength. In addition, physical function measures such as walking speed and chair stand depend crucially upon quadriceps mass strength, which has not been measured in most studies including ours. Grip strength is not a measure of quadriceps strength and function, which may be viewed as a limitation of the current investigation.
We noted that men with greater fat mass had lower physical function scores and that men with lower appendicular lean mass were weaker. This is consistent with some previous studies 51 and is relevant to two concurrent trends in the U.S.: the emerging obesity epidemic and the aging of the population, which could cause a major rise in the prevalence of what has come to be known as sarcopenic obesity 52, 53. Results from this study suggest that impaired physical function among obese men could represent a major public health challenge in the future, given the known influence of functional impairment and disability on osteoporotic fracture risk, functional dependency, long-term care use, and health care costs 1, 2, 54. Further understanding of strategies to prevent adverse outcomes in obese frail men is needed.
Limitations to the current study should be acknowledged. First, the cross-sectional design of the study is problematic, particularly in light of the weak association observed between the testosterone level and lean mass, which could have been obscured by the strong negative association between the testosterone level and fat mass. It is likely that the latter was driven mainly by the strong influence fat mass has on the testosterone level (i.e., reciprocal causation). Second, subjects were not asked to perform the tandem stand test, the third component of the performance battery of Guralnik et al. 21 In addition, the cutpoints for the walk and chair stand test established by Guralnik et al. were not used in this report. This has been done previously with this measure 41 and also for similar constructs 55, 56. Given the generally high levels of function of the population under study, the use of these established cutpoints induces a ceiling effect in this data set. This limitation is partially offset by the observation that the modified composite correlates well with theoretically related variables included in this analysis (age and grip strength), and the appeal of the composite as a global measure of physical function. Finally, subjects in this study were relatively healthy and active community-dwelling older men. It is possible that testosterone (and perhaps estradiol) may play a stronger role in determining age-related declines in physical function among more sedentary and frail individuals, but this is speculative.
These limitations must be balanced against the strengths of this study, which include a random, population-based study of a large number of racially and ethnically diverse men across a broad age range with robust measurement of the variables of interest. In addition, we posited a comprehensive model for age-related declines in physical function that is consistent with theory, that was tested in a manner consistent with good statistical practice, and that performed very well in terms of model fit. A similar approach to modeling the association between aging, the testosterone level, and muscle strength was employed by Roy and colleagues 8 with data from 262 subjects aged 24–90 y enrolled in the Baltimore Longitudinal Study of Aging. Our study is important in that we now extend these findings to include measures of functional performance.
In summary, in this racially and ethnically diverse sample of men, aging is associated with alterations in hormone levels, substantial changes in body composition, and declines in muscle strength and physical function. Age-related changes in the male sex hormones, however, while strongly influencing measures of body composition, play a relatively minor role in age-related declines in strength and physical performance.
ACKNOWLEDGEMENTS
The BACH/Bone Survey was supported by grant AG 20727 from the National Institute on Aging (NIA). The parent study (BACH) was supported by grant DK 56842 from the National Institute of Diabetes and Digestive and Kidney Diseases. Analyses for the current manuscript were supported through an unrestricted educational grant to New England Research Institutes, Inc. from GlaxoSmithKline. Additional support for S.B. was received from AG 14369 and HD 043348. R.E.W. and R.V.C. are employees of, and have equity interest in, GlaxoSmithKline. The authors appreciate the helpful comments of David J. Handelsman, M.B., B.S., Ph.D., who reviewed this manuscript in draft form.
Sponsor’s Role: R.E.W. and R.V.C., both employees of the Sponsor, contributed to the conception and design of the analysis, contributed to revisions of the manuscript for intellectual content, and approved the final version of the manuscript.
Grant Support: The BACH/Bone Survey was supported by grant AG 20727 from the National Institute on Aging (NIA). The parent study (BACH) was supported by grant DK 56842 from the National Institute of Diabetes and Digestive and Kidney Diseases. Analyses for the current manuscript were supported through an unrestricted educational grant to New England Research Institutes, Inc. from GlaxoSmithKline. Additional support for S.B. was received from AG 14369 and HD 043348.
Footnotes
Conflict of Interest Disclosures: Below is a checklist for all authors to complete and attach to their papers during submission.
| Elements of Financial/Personal Conflicts |
ABA, TGT, SB, GRE, JBM |
REW, RVC | ||
|---|---|---|---|---|
| Yes | No | Yes | No | |
| Employment or Affiliation | X | X | ||
| Grants/Funds | X | X | ||
| Honoraria | X | X | ||
| Speaker Forum | X | X | ||
| Consultant | X | X | ||
| Stocks | X | X | ||
| Royalties | X | X | ||
| Expert Testimony | X | X | ||
| Board Member | X | X | ||
| Patents | X | X | ||
| Personal Relationship | X | X | ||
Disclosures summary: A.B.A., T.G.T., G.R.E., and J.B.M. received funding for analysis and write-up of the current manuscript from GlaxoSmithKline. R.E.W. and R.V.C. are employees of, and have equity interest in, GlaxoSmithKline.
REFERENCES
- [1].Baumgartner RN. Body composition in healthy aging. Ann N Y Acad Sci. 2000;904:437–448. doi: 10.1111/j.1749-6632.2000.tb06498.x. [DOI] [PubMed] [Google Scholar]
- [2].Roubenoff R, Hughes VA. Sarcopenia: current concepts. J Gerontol A Biol Sci Med Sci. 2000;55:M716–724. doi: 10.1093/gerona/55.12.m716. [DOI] [PubMed] [Google Scholar]
- [3].Feldman HA, Longcope C, Derby CA, et al. Age trends in the level of serum testosterone and other hormones in middle-aged men: longitudinal results from the Massachusetts male aging study. J Clin Endocrinol Metab. 2002;87:589–598. doi: 10.1210/jcem.87.2.8201. [DOI] [PubMed] [Google Scholar]
- [4].Harman SM, Metter EJ, Tobin JD, Pearson J, Blackman MR. Longitudinal effects of aging on serum total and free testosterone levels in healthy men. Baltimore Longitudinal Study of Aging. J Clin Endocrinol Metab. 2001;86:724–731. doi: 10.1210/jcem.86.2.7219. [DOI] [PubMed] [Google Scholar]
- [5].Kaufman JM, Vermeulen A. The decline of androgen levels in elderly men and its clinical and therapeutic implications. Endocr Rev. 2005;26:833–876. doi: 10.1210/er.2004-0013. [DOI] [PubMed] [Google Scholar]
- [6].Orwoll E, Lambert LC, Marshall LM, et al. Testosterone and estradiol among older men. J Clin Endocrinol Metab. 2006;91:1336–1344. doi: 10.1210/jc.2005-1830. [DOI] [PubMed] [Google Scholar]
- [7].Mohr BA, Bhasin S, Kupelian V, Araujo AB, O’Donnell AB, McKinlay JB. Testosterone, sex hormone-binding globulin, and frailty in older men. J Am Geriatr Soc. 2007;55:548–555. doi: 10.1111/j.1532-5415.2007.01121.x. [DOI] [PubMed] [Google Scholar]
- [8].Roy TA, Blackman MR, Harman SM, Tobin JD, Schrager M, Metter EJ. Interrelationships of serum testosterone and free testosterone index with FFM and strength in aging men. Am J Physiol Endocrinol Metab. 2002;283:E284–294. doi: 10.1152/ajpendo.00334.2001. [DOI] [PubMed] [Google Scholar]
- [9].Schaap LA, Pluijm SM, Smit JH, et al. The association of sex hormone levels with poor mobility, low muscle strength and incidence of falls among older men and women. Clin Endocrinol (Oxf) 2005;63:152–160. doi: 10.1111/j.1365-2265.2005.02315.x. [DOI] [PubMed] [Google Scholar]
- [10].Szulc P, Claustrat B, Marchand F, Delmas PD. Increased risk of falls and increased bone resorption in elderly men with partial androgen deficiency: the MINOS study. J Clin Endocrinol Metab. 2003;88:5240–5247. doi: 10.1210/jc.2003-030200. [DOI] [PubMed] [Google Scholar]
- [11].Emmelot-Vonk MH, Verhaar HJ, Nakhai Pour HR, et al. Effect of testosterone supplementation on functional mobility, cognition, and other parameters in older men: a randomized controlled trial. Jama. 2008;299:39–52. doi: 10.1001/jama.2007.51. [DOI] [PubMed] [Google Scholar]
- [12].Snyder PJ, Peachey H, Hannoush P, et al. Effect of testosterone treatment on body composition and muscle strength in men over 65 years of age. J Clin Endocrinol Metab. 1999;84:2647–2653. doi: 10.1210/jcem.84.8.5885. [DOI] [PubMed] [Google Scholar]
- [13].Tenover JS. Effects of testosterone supplementation in the aging male. J Clin Endocrinol Metab. 1992;75:1092–1098. doi: 10.1210/jcem.75.4.1400877. [DOI] [PubMed] [Google Scholar]
- [14].Wang C, Eyre DR, Clark R, et al. Sublingual testosterone replacement improves muscle mass and strength, decreases bone resorption, and increases bone formation markers in hypogonadal men--a clinical research center study. J Clin Endocrinol Metab. 1996;81:3654–3662. doi: 10.1210/jcem.81.10.8855818. [DOI] [PubMed] [Google Scholar]
- [15].Wang C, Swerdloff RS, Iranmanesh A, et al. Transdermal testosterone gel improves sexual function, mood, muscle strength, and body composition parameters in hypogonadal men. J Clin Endocrinol Metab. 2000;85:2839–2853. doi: 10.1210/jcem.85.8.6747. [DOI] [PubMed] [Google Scholar]
- [16].Araujo AB, Travison TG, Harris SS, Holick MF, Turner AK, McKinlay JB. Race/ethnic differences in bone mineral density in men. Osteoporos Int. 2007;18:943–953. doi: 10.1007/s00198-006-0321-9. [DOI] [PubMed] [Google Scholar]
- [17].McKinlay JB, Link CL. Measuring the urologic iceberg: design and implementation of the Boston Area Community Health (BACH) Survey. Eur Urol. 2007;52:389–396. doi: 10.1016/j.eururo.2007.03.013. [DOI] [PMC free article] [PubMed] [Google Scholar]
- [18].Washburn RA, Smith KW, Jette AM, Janney CA. The Physical Activity Scale for the Elderly (PASE): development and evaluation. J Clin Epidemiol. 1993;46:153–162. doi: 10.1016/0895-4356(93)90053-4. [DOI] [PubMed] [Google Scholar]
- [19].Södergard R, Backstrom T, Shanbhag V, Carstensen H. Calculation of free and bound fractions of testosterone and estradiol-17 beta to human plasma proteins at body temperature. J Steroid Biochem. 1982;16:801–810. doi: 10.1016/0022-4731(82)90038-3. [DOI] [PubMed] [Google Scholar]
- [20].Vermeulen A, Verdonck L, Kaufman JM. A critical evaluation of simple methods for the estimation of free testosterone in serum. J Clin Endocrinol Metab. 1999;84:3666–3672. doi: 10.1210/jcem.84.10.6079. [DOI] [PubMed] [Google Scholar]
- [21].Guralnik JM, Simonsick EM, Ferrucci L, et al. A short physical performance battery assessing lower extremity function: association with self-reported disability and prediction of mortality and nursing home admission. J Gerontol. 1994;49:M85–94. doi: 10.1093/geronj/49.2.m85. [DOI] [PubMed] [Google Scholar]
- [22].Cochran WG. Sampling techniques. 3rd ed. John Wiley & Sons; New York: 1977. [Google Scholar]
- [23].Wood S. Generalized Additive Models: An Introduction with R. Chapman and Hall; Boca Raton: 2006. [Google Scholar]
- [24].O’Donnell AB, Travison TG, Harris SS, Tenover JL, McKinlay JB. Testosterone, dehydroepiandrosterone, and physical performance in older men: results from the Massachusetts Male Aging Study. J Clin Endocrinol Metab. 2006;91:425–431. doi: 10.1210/jc.2005-1227. [DOI] [PubMed] [Google Scholar]
- [25].Wright S. The Method of Path Coefficients. Ann Math Stat. 1934;5:161–215. [Google Scholar]
- [26].Muthen LK, Muthen BO. Mplus User’s Guide. 4 ed. Los Angeles: 2006. [Google Scholar]
- [27].Akaike H. A new look at the statistical model identification. IEEE Trans Automat Contr. 1974;19:716–723. [Google Scholar]
- [28].Bhasin S, Calof OM, Storer TW, et al. Drug insight: Testosterone and selective androgen receptor modulators as anabolic therapies for chronic illness and aging. Nat Clin Pract Endocrinol Metab. 2006;2:146–159. doi: 10.1038/ncpendmet0120. [DOI] [PMC free article] [PubMed] [Google Scholar]
- [29].Singh R, Artaza JN, Taylor WE, et al. Testosterone inhibits adipogenic differentiation in 3T3-L1 cells: nuclear translocation of androgen receptor complex with beta-catenin and T-cell factor 4 may bypass canonical Wnt signaling to down-regulate adipogenic transcription factors. Endocrinology. 2006;147:141–154. doi: 10.1210/en.2004-1649. [DOI] [PMC free article] [PubMed] [Google Scholar]
- [30].Brodsky IG, Balagopal P, Nair KS. Effects of testosterone replacement on muscle mass and muscle protein synthesis in hypogonadal men--a clinical research center study. J Clin Endocrinol Metab. 1996;81:3469–3475. doi: 10.1210/jcem.81.10.8855787. [DOI] [PubMed] [Google Scholar]
- [31].Ferrando AA, Sheffield-Moore M, Yeckel CW, et al. Testosterone administration to older men improves muscle function: molecular and physiological mechanisms. Am J Physiol Endocrinol Metab. 2002;282:E601–607. doi: 10.1152/ajpendo.00362.2001. [DOI] [PubMed] [Google Scholar]
- [32].Cesari M, Penninx BW, Pahor M, et al. Inflammatory markers and physical performance in older persons: the InCHIANTI study. J Gerontol A Biol Sci Med Sci. 2004;59:242–248. doi: 10.1093/gerona/59.3.m242. [DOI] [PubMed] [Google Scholar]
- [33].Kapoor D, Clarke S, Stanworth R, Channer KS, Jones TH. The effect of testosterone replacement therapy on adipocytokines and C-reactive protein in hypogonadal men with type 2 diabetes. Eur J Endocrinol. 2007;156:595–602. doi: 10.1530/EJE-06-0737. [DOI] [PubMed] [Google Scholar]
- [34].Maggio M, Basaria S, Ble A, et al. Correlation between testosterone and the inflammatory marker soluble interleukin-6 receptor in older men. J Clin Endocrinol Metab. 2006;91:345–347. doi: 10.1210/jc.2005-1097. [DOI] [PubMed] [Google Scholar]
- [35].Page ST, Herbst KL, Amory JK, et al. Testosterone administration suppresses adiponectin levels in men. J Androl. 2005;26:85–92. [PubMed] [Google Scholar]
- [36].Baumgartner RN, Waters DL, Gallagher D, Morley JE, Garry PJ. Predictors of skeletal muscle mass in elderly men and women. Mech Ageing Dev. 1999;107:123–136. doi: 10.1016/s0047-6374(98)00130-4. [DOI] [PubMed] [Google Scholar]
- [37].Bhasin S, Storer TW, Berman N, et al. The effects of supraphysiologic doses of testosterone on muscle size and strength in normal men. N Engl J Med. 1996;335:1–7. doi: 10.1056/NEJM199607043350101. [DOI] [PubMed] [Google Scholar]
- [38].Kenny AM, Prestwood KM, Gruman CA, Marcello KM, Raisz LG. Effects of transdermal testosterone on bone and muscle in older men with low bioavailable testosterone levels. J Gerontol A Biol Sci Med Sci. 2001;56:M266–272. doi: 10.1093/gerona/56.5.m266. [DOI] [PubMed] [Google Scholar]
- [39].Storer TW, Magliano L, Woodhouse L, et al. Testosterone dose-dependently increases maximal voluntary strength and leg power, but does not affect fatigability or specific tension. J Clin Endocrinol Metab. 2003;88:1478–1485. doi: 10.1210/jc.2002-021231. [DOI] [PubMed] [Google Scholar]
- [40].Page ST, Amory JK, Bowman FD, et al. Exogenous testosterone (T) alone or with finasteride increases physical performance, grip strength, and lean body mass in older men with low serum T. J Clin Endocrinol Metab. 2005;90:1502–1510. doi: 10.1210/jc.2004-1933. [DOI] [PubMed] [Google Scholar]
- [41].Schaap LA, Pluijm SM, Deeg DJ, et al. Low testosterone levels and decline in physical performance and muscle strength in older men: findings from two prospective cohort studies. Clin Endocrinol (Oxf) 2008;68:42–50. doi: 10.1111/j.1365-2265.2007.02997.x. [DOI] [PubMed] [Google Scholar]
- [42].Taaffe DR, Cooper CS, Holloway L, Duret C, Marcus R. Lack of association of anabolic hormone status and muscle strength with regional and whole body bone mineral density in healthy men aged 60–79 years. Aging (Milano) 1999;11:4–11. [PubMed] [Google Scholar]
- [43].Bhasin S, Woodhouse L, Casaburi R, et al. Older men are as responsive as young men to the anabolic effects of graded doses of testosterone on the skeletal muscle. J Clin Endocrinol Metab. 2005;90:678–688. doi: 10.1210/jc.2004-1184. [DOI] [PubMed] [Google Scholar]
- [44].Nair KS, Rizza RA, O’Brien P, et al. DHEA in elderly women and DHEA or testosterone in elderly men. N Engl J Med. 2006;355:1647–1659. doi: 10.1056/NEJMoa054629. [DOI] [PubMed] [Google Scholar]
- [45].Snyder PJ, Peachey H, Berlin JA, et al. Effects of testosterone replacement in hypogonadal men. J Clin Endocrinol Metab. 2000;85:2670–2677. doi: 10.1210/jcem.85.8.6731. [DOI] [PubMed] [Google Scholar]
- [46].Jones ME, Boon WC, McInnes K, Maffei L, Carani C, Simpson ER. Recognizing rare disorders: aromatase deficiency. Nat Clin Pract Endocrinol Metab. 2007;3:414–421. doi: 10.1038/ncpendmet0477. [DOI] [PubMed] [Google Scholar]
- [47].Orwoll E, Lambert LC, Marshall LM, et al. Endogenous testosterone levels, physical performance, and fall risk in older men. Arch Intern Med. 2006;166:2124–2131. doi: 10.1001/archinte.166.19.2124. [DOI] [PubMed] [Google Scholar]
- [48].van den Beld AW, de Jong FH, Grobbee DE, Pols HA, Lamberts SW. Measures of bioavailable serum testosterone and estradiol and their relationships with muscle strength, bone density, and body composition in elderly men. J Clin Endocrinol Metab. 2000;85:3276–3282. doi: 10.1210/jcem.85.9.6825. [DOI] [PubMed] [Google Scholar]
- [49].Visser M, Deeg DJ, Lips P, Harris TB, Bouter LM. Skeletal muscle mass and muscle strength in relation to lower-extremity performance in older men and women. J Am Geriatr Soc. 2000;48:381–386. doi: 10.1111/j.1532-5415.2000.tb04694.x. [DOI] [PubMed] [Google Scholar]
- [50].Ly LP, Jimenez M, Zhuang TN, Celermajer DS, Conway AJ, Handelsman DJ. A double-blind, placebo-controlled, randomized clinical trial of transdermal dihydrotestosterone gel on muscular strength, mobility, and quality of life in older men with partial androgen deficiency. J Clin Endocrinol Metab. 2001;86:4078–4088. doi: 10.1210/jcem.86.9.7821. [DOI] [PubMed] [Google Scholar]
- [51].Sternfeld B, Ngo L, Satariano WA, Tager IB. Associations of body composition with physical performance and self-reported functional limitation in elderly men and women. Am J Epidemiol. 2002;156:110–121. doi: 10.1093/aje/kwf023. [DOI] [PubMed] [Google Scholar]
- [52].Baumgartner RN, Wayne SJ, Waters DL, Janssen I, Gallagher D, Morley JE. Sarcopenic obesity predicts instrumental activities of daily living disability in the elderly. Obes Res. 2004;12:1995–2004. doi: 10.1038/oby.2004.250. [DOI] [PubMed] [Google Scholar]
- [53].Roubenoff R. Sarcopenic obesity: does muscle loss cause fat gain? Lessons from rheumatoid arthritis and osteoarthritis. Ann N Y Acad Sci. 2000;904:553–557. doi: 10.1111/j.1749-6632.2000.tb06515.x. [DOI] [PubMed] [Google Scholar]
- [54].US General Accounting Office . Report to Congressional Requesters. Washington, DC: 2000. SSA Disability: Other Programs May Provide Improving Return to Work Efforts. GAO-01-153. [Google Scholar]
- [55].Cawthon PM, Marshall LM, Michael Y, et al. Frailty in older men: prevalence, progression, and relationship with mortality. J Am Geriatr Soc. 2007;55:1216–1223. doi: 10.1111/j.1532-5415.2007.01259.x. [DOI] [PubMed] [Google Scholar]
- [56].Ensrud KE, Ewing SK, Taylor BC, et al. Comparison of 2 frailty indexes for prediction of falls, disability, fractures, and death in older women. Arch Intern Med. 2008;168:382–389. doi: 10.1001/archinternmed.2007.113. [DOI] [PubMed] [Google Scholar]