Abstract
Isoform-specific protein kinase C (PKC) activators may be useful as therapeutic agents for the treatment of Alzheimer disease. Three new ϵ-specific PKC activators, made by cyclopropanation of polyunsaturated fatty acids, have been developed. These activators, AA-CP4, EPA-CP5, and DHA-CP6, activate PKCϵ in a dose-dependent manner. Unlike PKC activators that bind to the 1,2-diacylglycerol-binding site, such as bryostatin and phorbol esters, which produce prolonged down-regulation, the new activators produced sustained activation of PKC. When applied to cells expressing human APPSwe/PS1δ, which produce large quantities of β-amyloid peptide (Aβ), DCP-LA and DHA-CP6 reduced the intracellular and secreted levels of Aβ by 60–70%. In contrast to the marked activation of α-secretase produced by PKC activators in fibroblasts, the PKC activators produced only a moderate and transient activation of α-secretase in neuronal cells. However, they activated endothelin-converting enzyme to 180% of control levels, suggesting that the Aβ-lowering ability of these PKCϵ activators is caused by increasing the rate of Aβ degradation by endothelin-converting enzyme and not by activating nonamyloidogenic amyloid precursor protein metabolism.
Introduction
Alzheimer disease is characterized by the accumulation of aggregated β-amyloid (Aβ),2 which is a 4-kDa peptide produced by the proteolytic cleavage of amyloid precursor protein (APP) by β- and γ-secretases. Oligomers of Aβ are the most toxic, whereas fibrillar Aβ is largely inert. Monomeric Aβ is found in normal patients and has an as-yet undetermined function. The earliest consistent cytopathological change in Alzheimer disease is loss of synapses (1, 2). Finding a way to protect against the loss of synapses is a major therapeutic goal. Protein kinase C (PKC) activators have demonstrated neuroprotective activity in animal models of Alzheimer disease (3), depression (4), and stroke (5). Bryostatin, a potent PKC activator, also increases the rate of learning in rodents, rabbits, and invertebrates (4, 6, 7). This effect is accompanied by increases in levels of synaptic proteins spinophilin and synaptophysin and structural changes in synaptic morphology (8). PKC activators also can reduce the levels of Aβ and prolong the survival of Alzheimer disease transgenic mice (3). Evidence suggests that PKCα and ϵ are the most important PKC isoforms in eliciting these changes. Antisense inhibition of PKCα blocks secretion of sAPPα, whereas indirect activators of PKC, such as carbachol, increase sAPPα secretion (9). Experiments with specific PKC isozyme inhibitors also point to PKCϵ as the isozyme that most effectively suppresses Aβ production (10). Thus, isoform-specific PKC activators are highly desirable as potential anti-Alzheimer drugs. Specific activators are preferable to compounds such as bryostatin that show less specificity among conventional and novel forms of PKC because nonspecific activation of PKCδ or β could produce undesirable side effects.
One compound known to activate PKCϵ specifically is DCP- LA (8-[2-(2-pentyl-cyclopropylmethyl)-cyclopropyl]-octanoic acid), a derivative of linoleic acid in which the double bonds are replaced by cyclopropane groups (11). Like the polyunsaturated fatty acids docosahexaenoic acid and arachidonic acid, DCP-LA binds to the phosphatidylserine-binding site and specifically activates PKCϵ (11). However, DCP-LA requires relatively high concentrations to produce its maximal effect. Therefore, we synthesized a variety of cyclopropanated fatty acid derivatives and compared their ability to activate PKCϵ. Two such compounds, DHA-CP6 and EPA-CP5, were found to be highly specific for the PKCϵ and were effective at 1000× and 100× lower concentrations than DCP-LA. DHA-CP6 also reduced the levels of Aβ by 60–70% in cells expressing APP with the Swedish mutation. This effect was not caused by activation of α-secretase, but may have been caused by increased Aβ degradation by endothelin-converting enzyme (ECE).
EXPERIMENTAL PROCEDURES
Materials
Culture media were obtained from K-D Medical (Columbia, MD) or Invitrogen. Aβ1–42 was purchased from Anaspec (San Jose, CA). Polyunsaturated fatty acid methyl esters were obtained from Cayman Chemicals, Ann Arbor, MI. Other chemicals were obtained from Sigma-Aldrich.
Cell Culture
Human SH-SY5Y neuroblastoma cells (ATCC) were cultured in 45% F12K, 45% minimum Eagle's medium, 10% fetal calf serum. Mouse N2a neuroblastoma cells were cultured in Dulbecco's modified Eagle's medium and 10% fetal calf serum without glutamine. Rat hippocampal neurons from 18-day-old embryonic Sprague-Dawley rat brains were plated on 24-well plates coated with poly-d-lysine (Sigma-Aldrich) in B-27 neurobasal medium containing 0.5 mm glutamine and 25 μm glutamate (Invitrogen) and cultured for 3 days in the medium without glutamate. The neuronal cells were grown under 5% CO2 for 14 days in an incubator maintained at 37 °C.
All experiments on cultured cells were carried out in triplicate unless otherwise stated. All data points are displayed as mean ± S.E. DCP-LA was used as its free acid in all experiments, whereas DHA-CP6, EPA-CP5, and AA-CP4 were used as their methyl esters.
TACE
TACE was measured (12) by incubating 5 μl of cell homogenate, 3 μl of buffer (50 mm Tris-HCl (pH 7.4) + 25 mm NaCl + 4% glycerol), and 1 μl of 100 μm TACE substrate IV (Abz-LAQAVRSSSR-DPa) (Calbiochem) for 20 min at 37 °C in 1.5-ml polypropylene centrifuge tubes. The reaction was stopped by cooling to 4 °C. The samples were diluted to 1 ml, and the fluorescence was rapidly measured (ex = 320 nm, em = 420 nm) in a Spex Fluorolog 2 spectrofluorometer.
PKC Assay
After removal of culture medium, cells were scraped in 0.2 ml of homogenization buffer (20 mm Tris-HCl (pH 7.4), 50 mm NaF, 1 μg/ml leupeptin, and 0.1 mm phenylmethylsulfonyl fluoride) and immediately homogenized in the cell culture plate by sonication in a Marsonix microprobe sonicator (5 s, 10 W). Aliquots were transferred immediately after sonication to 0.5-ml centrifuge tubes and frozen at −80 °C. To measure PKC, 10 μl of cell homogenate or purified PKC isozyme was incubated for 15 min at 37 °C in the presence of 10 μm histones, 4.89 mm CaCl2, 1.2 μg/μl phosphatidyl-l-serine, 0.18 μg/μl 1,2-dioctanoyl-sn-glycerol, 10 mm MgCl2, 20 mm HEPES (pH 7.4), 0.8 mm EDTA, 4 mm EGTA, 4% glycerol, 8 μg/ml aprotinin, 8 μg/ml leupeptin, and 2 mm benzamidine. 0.5 μCi of [γ- 32P]ATP was added, and [32P]phosphoprotein formation was measured by adsorption onto phosphocellulose as described previously (13). For measurements of activation by DCP-LA and similar compounds, PKC activity was measured in the absence of diacylglycerol (DAG) and phosphatidylserine, as described by Kanno et al. (11), and PKCδ and ϵ were measured in the absence of added EGTA and CaCl2, as described by Kanno et al. (11). Low concentrations of Ca2+ are needed because high Ca2+ interacts with the PKC phosphatidylserine-binding site and prevents activation. For measurements of bryostatin activation, DAG was omitted unless otherwise stated. Freeze-thawing of the samples more than once was avoided because it was found to greatly reduce the PKC activity and the degree of activation.
ECE Assay
ECE was measured fluorometrically using the method of Johnson and Ahn (14). A sample of cell homogenate (20 μl) was incubated in 50 mm MES-KOH (pH 6.0), 0.01% C12 E10 (polyoxyethylene-10-lauryl ether), and 15 μm McaBK2 (7-methoxycoumarin-4-acetyl [Ala7-(2,4-dinitrophenyl)Lys9]-bradykinin trifluoroacetate salt) (Sigma-Aldrich). After 60 min at 37 °C, the reaction was quenched by adding trifluoroacetic acid to 0.5%. The sample was diluted to 1.4 ml with water, and the fluorescence was measured at ex = 334 nm, em = 398 nm.
Other Assays
Aβ in cell extracts was measured using an Aβ1–42 human fluorometric ELISA kit (BioSource/Invitrogen). Aβ in culture medium was isolated by adsorption onto reversed phase columns (Waters Sep-Pak C18 cartridges). The columns were conditioned with acetonitrile and equilibrated with water.
The sample was applied and washed with 2 ml of 5% acetonitrile and 2 ml of 25% acetonitrile containing 0.1% trifluoroacetic acid. The Aβ was eluted with 1 ml 50% acetonitrile + 0.1% trifluoroacetic acid. The acetonitrile was evaporated by heating under a stream of nitrogen, and the solution was lyophilized to dryness and redissolved in a minimum volume of water followed by ELISA measurements. Fluorescence was measured in a Biotek Synergy HT microplate reader (ex = 460 nm, em = 560 nm). AlamarBlue and CyQuant NF (Invitrogen) were used according to the manufacturer's instructions.
Synthesis of Cyclopropanated Fatty Acids
Methyl esters of polyunsaturated fatty acids were cyclopropanated using the modified Simmons-Smith reaction with chloroiodomethane and diethylzinc (15–17). All apparatus was baked at 60 °C for 1 h and flame-dried while passing dry nitrogen through the apparatus. A 100-ml three-neck round-bottom flask with a stirring bar and a temperature probe was surrounded by a dry ice mixture and filled with 1.25 g (4.24 mmol) of linoleic acid methyl ester or docosahexaenoic acid methyl ester in 25 ml of dichloromethane and bubbled with N2. A 1 m solution of diethylzinc (51 ml, 54.94 mmol) in hexane was added anaerobically using a 24-inch-long 20-gauge needle, and the solution was cooled to −5 °C. Chloroiodomethane (ClCH2I, 8.02 ml, 109.88 mmol) was added dropwise, 1 drop/s, with constant stirring. The rate of addition was decreased if necessary to maintain the reaction mixture below 2 °C. The reaction mixture became cloudy during the reaction, and an insoluble white zinc product was produced. The flask was sealed, and the mixture was allowed to react further for 1 h and then allowed to come to room temperature gradually over 2 h.
To prevent the formation of an explosive residue in the hood, diethylzinc was not evaporated off. The mixture was poured slowly into 100 ml of water under stirring to decompose any excess diethylzinc. Ethane was evolved. The mixture was centrifuged at 5000 rpm in glass centrifuge tubes, and the upper aqueous layer was discarded. The white precipitate was extracted with CH2Cl2 and combined with the organic phase. The organic phase was washed with water and centrifuged. The product was analyzed by Silica Gel G TLC using hexane + 1% ethyl acetate and purified by chromatography on silica gel using increasing concentrations of 1–10% ethyl acetate in n-hexane and evaporated under nitrogen, leaving the methyl ester as a colorless oil. The Simmons-Smith reaction preserves the stereochemistry of the starting materials (16). Docosahexaenoic acid methyl ester was converted into DHA-CP6 in 90–95% yield. The product was a colorless oil with a single absorbance maximum at 202 nm in ethanol and no reaction with I2. The IR spectrum showed cyclopropane ring absorption at 3070 and 1450 cm−1. Under the same conditions, eicosapentaenoic acid methyl ester was converted to EPA-CP5, and arachidonic acid methyl ester was converted to AA-CP4. Linoleic acid methyl ester was converted to DCP-LA methyl ester, which was identical to a known sample.
Hydrolysis of Methyl Ester
The methyl ester (0.15 g) was dissolved in 1 ml of 1 n LiOH and 1 ml of dioxane. Dioxane and methanol were added until it became homogeneous, and the solution was stirred 60 °C overnight to 3 days. The product was extracted in CH2Cl2 and centrifuged. The aqueous layer and white interface were reextracted with water and washed until the white layer no longer formed. The product was evaporated under N2 and purified by chromatography on silica gel. The product, a colorless oil, eluted in 20% EtOAc in n-hexane. Its purity was checked by TLC in 10% EtOAc/hexane and by C18 reversed phase HPLC with UV detection at 205 nm, using 95% acetonitrile as the mobile phase.
RESULTS
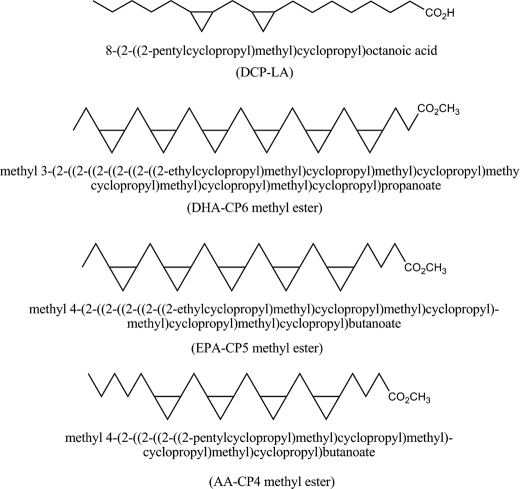
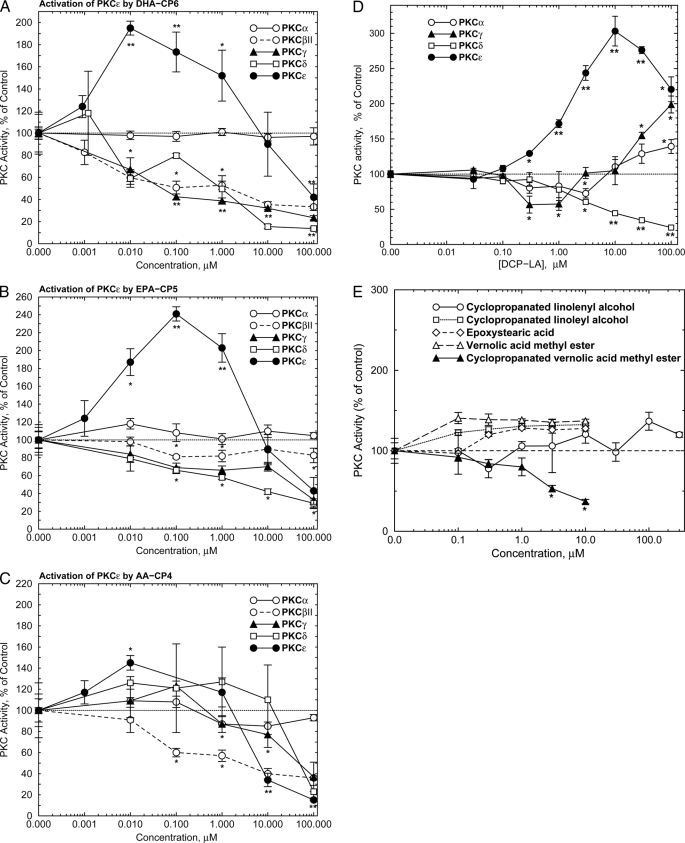
The structures of the new PKC activators are shown in Fig. 1. To determine their PKC isozyme specificity, the new compounds were preincubated with purified isoforms of PKC for 5 min, and the PKC activity was measured radiometrically. DHA-CP6 and EPA-CP5, which are cyclopropanated derivatives of docosahexaenoic acid and eicosapentaenoic acid, preferentially activated PKCϵ to a similar extent. The maximal effect for DHA-CP6 and EPA-CP5 was observed at 10 nm and 100 nm, respectively (Fig. 2, A and B). AA-CP4, the cyclopropanated derivative of arachidonic acid, produced only modest activation (Fig. 2C), and cyclopropanated linolenyl and linoleyl alcohols, epoxystearic acid, and vernolic acid methyl ester had little or no effect on PKC (Fig. 2E). Cyclopropanated vernolic acid methyl ester inhibited PKCϵ at concentrations above 1 μm (Fig. 2E). DCP-LA also activated PKCϵ, as reported by Kanno et al. (11), but required 1000× higher concentrations than DHA-CP6 for a maximal effect (Fig. 2D). At higher concentrations, the compounds were weak inhibitors of PKCγ, δ, and βII.
FIGURE 1.
Structures of DCP-LA, DHA-CP6, EPA-CP5, and AA-CP4.
FIGURE 2.
Activation of purified PKCϵ by PKC activators. Purified PKCα, βII, γ, δ, or ϵ (9 ng) was preincubated for 5 min at room temperature with DHA-CP6 (A), EPA-CP5 (B), AA-CP4 (C), or DCP-LA (D) followed by PKC activity measurement as described under “Experimental Procedures.” E, activation of purified PKCϵ by other cyclopropanated and epoxidized fatty acids, alcohols, and methyl esters. Samples were preincubated for 5 min at room temperature with purified PKCϵ (500 ng) followed by PKC activity measurement. Values are x̄ ± S.E., two-tailed Student's t test. *, p < 0.02; **, p < 0.001.
Incubation of DHA-CP6, EPA-CP5, or AA-CP4 with cultured human neuroblastoma cells produced activation of PKC that remained elevated for up to 1 h (Fig. 3A). Sustained activation was even more pronounced in primary neurons, with PKC activation lasting up to 24 h (Fig. 3B). In contrast to conventional PKC activators such as phorbol ester, no PKC down-regulation to below control levels was observed. However, inhibition could be produced at extremely high concentrations (>100 μm) (Fig. 2). In contrast, PKC activators that bind to the PKC DAG-binding site, including bryostatin, gnidimacrin, and phorbol esters, produce a transient (5–10 min) activation of PKC activity, followed by a prolonged down-regulation (data not shown). Following application of PMA (phorbol 12-myristate 13-acetate) at its effective concentration of 10–100 nm, PKC is rapidly down-regulated and remains at 20–30% of control levels for up to 24 h, whereas down-regulation by bryostatin is milder and relatively short lasting (18–20).3 These differences have been attributed to differences in the DAG-binding C1 domain of PKC (19).
FIGURE 3.
Time course of PKC activation in cultured human SH-SY5Y cells (A) and cultured primary rat hippocampal cells (B). DHA-CP6, EPA-CP5, or AA-CP4 in 10 μl of ethanol was added to cells growing in 6-well plates with 1 ml of culture medium. At the indicated time, the cells were washed with phosphate-buffered saline and scraped into 200 μl of homogenization buffer followed by PKC activity measurement as described under “Experimental Procedures.” *, p < 0.02; **, p < 0.001.
A growing body of evidence suggests that PKC down-regulation, particularly of PKCδ, may be responsible for the tumor-promoting effects of phorbol esters (18, 21). Down-regulation of PKC therefore complicates any proposed usage of DAG-binding PKC activators as therapeutic agents. Down-regulation has also been implicated as a factor in increasing Aβ production (22). Thus, the ability to produce sustained activation of PKC without inducing down-regulation is a highly desirable characteristic.
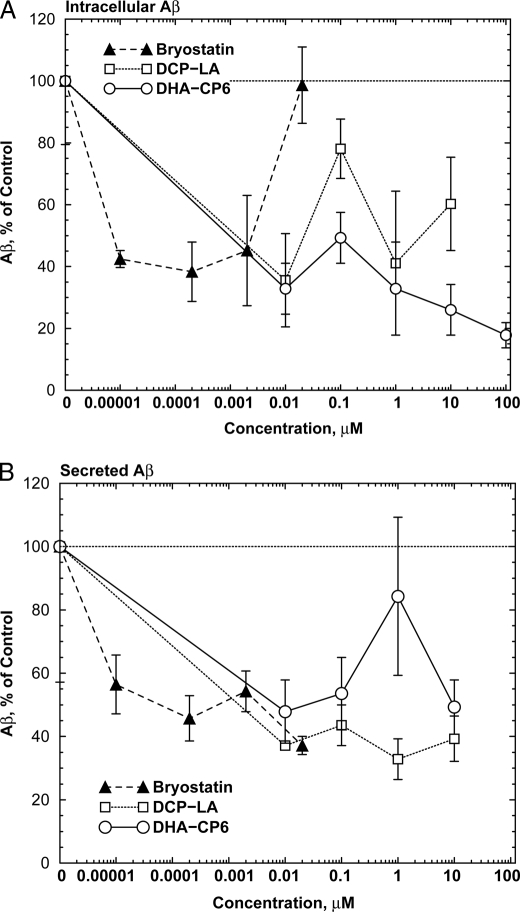
To measure the effects of PKCϵ activation on Aβ production, we used cells transfected with human APPSwe/PS1Δ9 (23, 24), which produce large quantities of Aβ. Incubation of these cells for 24 h with PKC activators markedly reduced the levels of both intracellular (Fig. 4A) and secreted (Fig. 4B) Aβ. For bryostatin, which activates PKC by binding to the DAG-binding site, the inhibition was biphasic, with concentrations of 20 nm or higher producing no net effect. This may be explained by the ability of this class of PKC activators to down-regulate PKC when used at high concentrations. In contrast, DCP-LA and DHA-CP6, which bind to the PKC phosphatidylserine site, showed monotonically increasing inhibition at concentrations up to 10 to 100 μm with no evidence of biphasic activity at higher concentrations.
FIGURE 4.
Decreased intracellular levels of Aβ in cells (A) and in culture medium (B) from cells exposed to PKC activators. Neuro2a neuroblastoma cells transfected with human APPSwe/PS1Δ9 (23, 24), growing in 6-well plates, were incubated with low serum (1%) medium for 24 h. The medium was replaced with fresh low serum medium and various concentrations of bryostatin, DCP-LA, or DHA-CP6 in 10 μl of ethanol, or 10 μl of ethanol alone was added. After 18 h, the cells were washed with phosphate-buffered saline and scraped into 200 μl of homogenization buffer, homogenized, and Aβ was measured by ELISA. The medium was collected, and Aβ was isolated by adsorption onto reversed phase columns (Waters C18 Sep-Pak cartridges), washed, and eluted with acetonitrile followed by ELISA measurements.
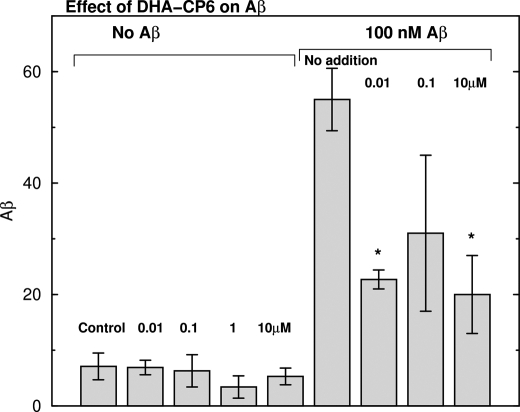
To determine whether the reduced levels of Aβ caused by PKC activators were due to inhibition of Aβ synthesis or activation of Aβ degradation, we applied DHA-CP6 and low concentrations (100 nm) of exogenous monomeric Aβ1–42 to cultured SH-SY5Y cells. This concentration of Aβ is too low to produce measurable toxicity or cell death. Because SH-SY5Y cells produce only trace amounts of Aβ, this experiment was an effective test of the ability of PKC activators to enhance Aβ degradation. By 24 h, most of the Aβ had been taken up by the cells, and the concentration of Aβ in the culture medium was undetectable. Addition of 0.01–10 μm DHA-CP6 to the cells reduced the cellular levels of Aβ by 45–63%, indicating that the PKCϵ activator increased the rate of degradation of exogenous Aβ (Fig. 5).
FIGURE 5.
Effect of DHA-CP6 on degradation of exogenously applied Aβ in human SH-SY5Y neuroblastoma cells. Various concentrations of DHA-CP6 in 10 μl of ethanol or 10 μl of ethanol alone were added to cells grown in 6-well plates. After 5 min, fresh Aβ1–42 (100 nm) or buffer was applied, and the cells were incubated for 24 h. Aβ1–42 was then measured in the cells and culture medium by ELISA. *, p < 0.02.
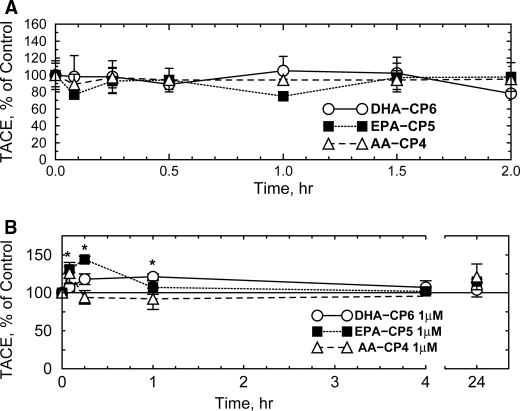
Previous researchers reported that PKC activators such as PMA produce large increases in TACE/ADAM17 activity (25, 26) which correlated with increased sAPPα and decreased Aβ, suggesting that TACE and BACE1 compete for availability of APP substrate and that PKC activators shift the competition in favor of TACE. However, many of these earlier studies were carried out in fibroblasts and other nonneuronal cell types, which may respond differently to PKC activators than neurons. For example, Etcheberrigaray et al. (27) found that activation of PKC in human fibroblasts by 10–100 pm bryostatin increased the initial rate of α-secretase activity by 16-fold and 132-fold, respectively. In contrast, in cultured human neuroblastoma cells (Fig. 6A), PKC activators produced no detectable increase in TACE activity. A transient increase in TACE activity was observed in primary neurons after EPA-CP5 (Fig. 6B). PMA also did not activate TACE in these cells (data not shown). This suggests that any reduction of Aβ levels in neuronal cells by PKC activators is caused by some mechanism other than activation of TACE.
FIGURE 6.
Effect of PKC activators on TACE activity in SH-SY5Y neuroblastoma cells (A) and cultured primary rat hippocampal neurons (B). DHA-CP6, EPA-CP5, or AA-CP4 in 10 μl of ethanol or 10 μl of ethanol alone was added at a final concentration of 1 μm to cells grown in 12- or 24-well plates. After various periods of time, the cells were collected, and TACE activity was measured fluorometrically. *, p < 0.02.
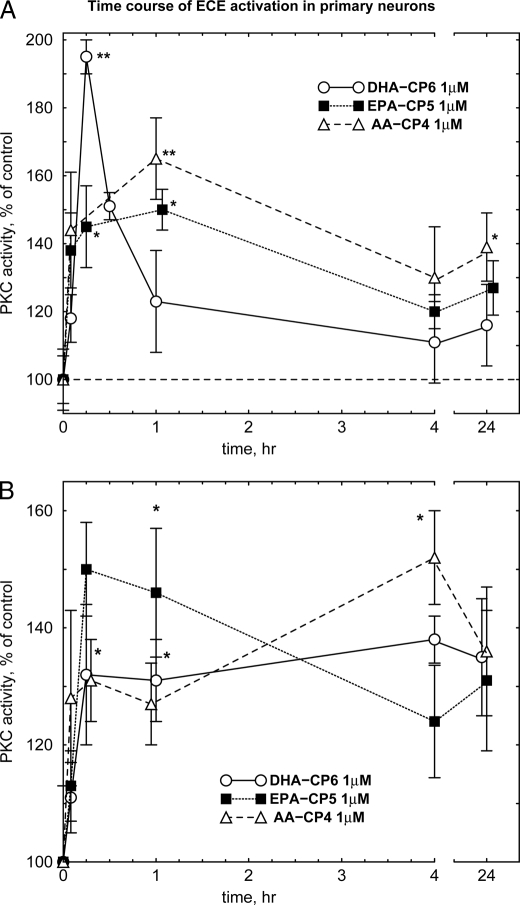
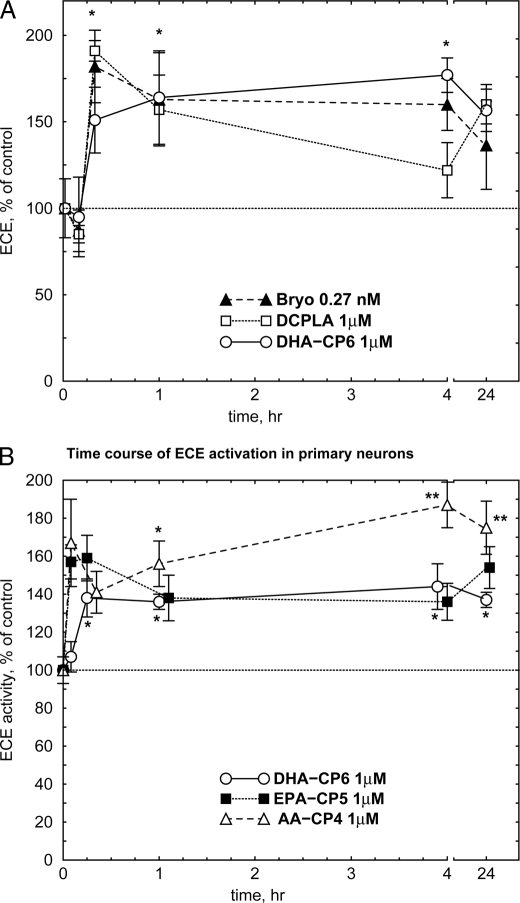
Aβ can be degraded in vivo by a number of enzymes, including insulin-degrading enzyme (insulysin), neprilysin, and ECE. Because PKCϵ overexpression has been reported to activate ECE (28), we examined the effect of PKC activators on ECE. Bryostatin, DCP-LA, and DHA-CP6 all produced a sustained increase in ECE activity (Fig. 7A). A similar effect was observed in primary cultured neurons (Fig. 7B). Because ECE does not possess a DAG-binding C1 domain or a PKC-like phosphatidylserine-binding C2 domain, this suggests that the activation was not due to direct activation of ECE, but must have resulted from indirect activation of ECE or some ECE-activating intermediate by PKC.
FIGURE 7.
Activation of ECE by PKC activators in SH-SY5Y cells (A) or cultured neurons (B). Bryostatin (Bryo; 0.27 nm), DCP-LA (1 μm), DHA-CP6 (1 μm), EPA-CP5 (1 μm), AA-CP4 (1 μm), or ethanol alone was added to cells growing on 12- or 24-well plates. After various periods of time, the cells were collected, and ECE activity was measured fluorometrically. *, p < 0.05; **, p < 0.001.
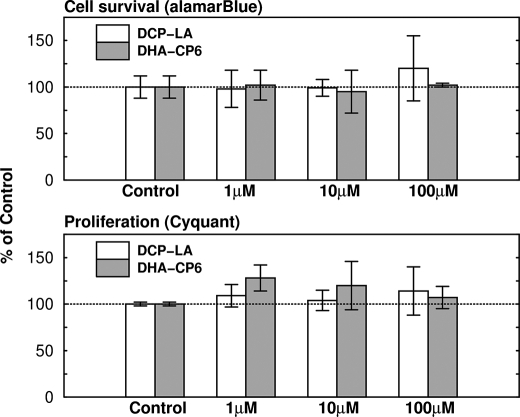
DHA-CP6, EPA-CP5, and AA-CP4 had no effect on the enzyme activity of purified ECE (Fig. 8). DHA-CP6, bryostatin, and DCP-LA had no effect on cell survival or on proliferation as measured by alamarBlue and CyQuant staining (Fig. 9), indicating that the reduction in Aβ production did not result from cell proliferation or a change in cell survival.
FIGURE 8.
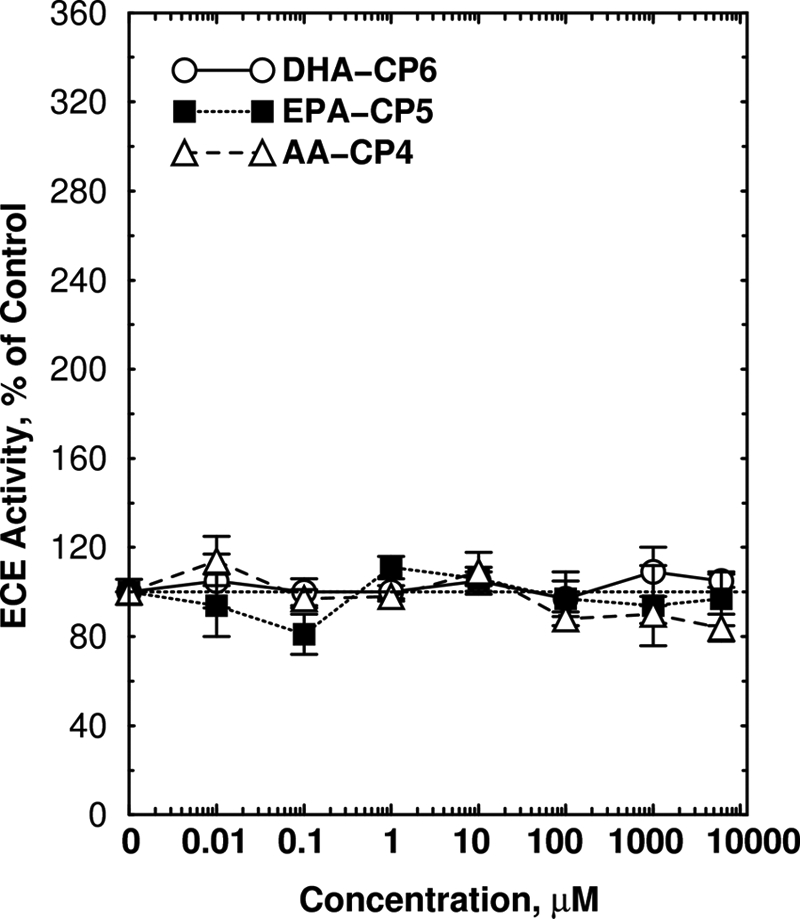
Lack of activation of purified ECE by PKC activators. ECE activity was measured as described under “Experimental Procedures” in the presence of recombinant ECE (1784ZN, 20 ng; R&D Systems) and varying concentrations of DHA-CP6, EPA-CP5, or AA-CP4 for 60 min at 37 °C.
FIGURE 9.
Lack of effect of DCP-LA and DHA-CP6 on cell survival and cell proliferation. Various concentrations of DCP-LA or DHA-CP6, or ethanol alone were added to SH-SY5Y cells growing on 6-well plates. Cell viability was measured by adding alamarBlue reagent (Invitrogen) to 10% of the culture volume. AlamarBlue is chemically reduced in viable cells to form a fluorescent product. The fluorescence was measured in a microplate reader at 1, 2, 3, and 4 h, and the slope of the curve of fluorescence intensity versus time was calculated. Cell proliferation was measured by adding 100 μl of CyQuant NF, which is a cell-permeable DNA-binding dye. After 60 min, the fluorescence, which is proportional to the number of cells, was measured in a microplate reader.
DISCUSSION
DHA-CP6, EPA-CP5, and DCP-LA represent a new class of PKC activators that are relatively specific for the PKCϵ isoform. PKCϵ is expressed at very low levels in all normal tissues except for brain (29, 30). Wetsel et al. (31) reported that PKCϵ and PKCϵ′ are expressed predominantly in brain, with very weak staining in other tissues. The high abundance of PKCϵ in presynaptic nerve fibers suggests a role in neurite outgrowth or neurotransmitter release (32). Therefore, effects of specific PKCϵ activators would be largely restricted to brain and unlikely to produce unwanted peripheral side effects (18).
The concentration of DHA-CP6 (10 nm) required for activation of PKC is comparable with that of PMA (10–100 nm) (33) but higher than that of bryostatin (0.2–1 nm). Further modifications of the structure of DHA-CP6, based on modeling studies of the PKC phosphatidylserine-binding site, could create derivatives with even higher affinity. Furthermore, because these new compounds are closely related to ω-3 and ω-6 polyunsaturated acids, they are likely to possess lower toxicity than many of the existing terpenoid secondary metabolite PKC activators. Thus, a requirement for higher concentrations might be less of a disadvantage.
There are several mechanisms by which activation of PKC could affect Aβ production. One mechanism is by activating TACE/α-secretase and shifting the competition for APP away from the amyloidogenic β-secretase. This appears to be an important mechanism in nonneuronal cells such as fibroblasts; however, our data show that PKCϵ activators have much less effect on TACE activity in neuronal cell types than in fibroblasts. Specific inhibitors of PKCϵ also block PMA-induced suppression of Aβ levels (10), suggesting that PKCϵ is the principal isoform responsible for depleting Aβ. However, da Cruz e Silva et al. (22) found that long term application of phorbol ester increases the synthesis of PKCϵ. Thus, part of the effect could also be mediated by induction of PKCϵ by PMA. Decreased expression of PKCϵ also reduces cholinergic regulation of sAPPα levels (34), which is consistent with the theory that sAPPα and Aβ compete for a limited pool of APP. Thus, in cells in which APP is rate-limiting, direct or indirect activation of α-secretase by PKCϵ could also reduce Aβ levels. Another possible mechanism is by increasing the rate of degradation. A recent report (28) presented evidence that PKCϵ increases the activity of ECE, an enzyme that degrades Aβ. These authors reported that in APP/PKCϵ transgenic mice, which overexpress PKCϵ, levels of Aβ were lower than in control animals, but there was no change in other Aβ-degrading enzymes, such as insulin-degrading enzyme or neprilysin, and no change in APP metabolism. However, it was unclear whether this effect can be produced by activation of PKCϵ in nontransgenic, adult animals. Our results showing that Aβ degradation is enhanced in cells treated with specific PKCϵ activators suggest that this may be the case.
A third mechanism is by stimulation of PKC-coupled M1 and M3 muscarinic receptors, which is reported to increase nonamyloidogenic APP processing by α-secretase (TACE/ADAM17 and/or ADAM10) (35). Muscarinic agonists rescue 3× transgenic Alzheimer disease mice from cognitive deficits and reduce Aβ and tau pathologies (36), in part by activating the TACE/ADAM17 nonamyloidogenic pathway. Muscarinic receptor signaling is closely tied to PKC: muscarinic receptor mRNA is regulated by PKC (37), and neuronal differentiation produced by M1 muscarinic receptor activation is mediated by PKC (38).
Activation of PKC can also have other neurotrophic or synaptogenic effects that complement the effect of lowering Aβ. For example, PKC activators can reverse some of the neurological damage in an ischemia/hypoxia model for stroke (5). PKC activators are also reported to induce expression of tyrosine hydroxylase (39) and induce neuronal survival and neurite outgrowth (8, 40). These neurotrophic effects may be mediated by neurotrophins such as brain-derived neurotrophic factor (40, 41). Neurotrophin signaling and APP metabolism pathways intersect at many points. For example, p75 and TrkA nerve growth factor receptor signaling increase APP mRNA expression (42). Both APP and p75 are cleaved by α- and γ-secretase (43). Cleavage of the p75 extracellular domain enables fibroblast growth factor 2 to stimulate neurite outgrowth and branching (44).
An advantage of compounds such as DCP-LA which specifically activate PKCϵ is that, in contrast to phorbol esters and similar DAG analogs, they do not produce detectable down-regulation. The biphasic response of PKC to DAG-based activators means that a PKC activator may produce opposite effects at different time points, such as reducing Aβ levels at one time point and increasing them at another (e.g. Ref. 22). Careful dosing and monitoring of patients would be required to avoid effects opposite to those that are intended. Because of the relative inability of this new class of PKC activators to down-regulate PKC, this problem can be avoided.
T. J. Nelson, unpublished results.
- Aβ
- β-amyloid peptide
- APP
- amyloid precursor protein
- DAG
- 1,2-diacyl-sn-glycerol
- ECE
- endothelin-converting enzyme
- ELISA
- enzyme-linked immunosorbent assay
- MES
- 4-morpholineethanesulfonic acid
- PKC
- protein kinase C
- PMA
- phorbol 12-myristate 13-acetate
- TACE
- tumor necrosis factor-α-converting enzyme
- ADAM17
- a disintegrin and metalloproteinase 17.
REFERENCES
- 1.Scheff S. W., Price D. A., Schmitt F. A., Mufson E. J. (2006) Neurobiol. Aging 27, 1372–1384 [DOI] [PubMed] [Google Scholar]
- 2.Marcello E., Epis R., Di Luca M. (2008) Eur. J. Pharmacol. 585, 109–118 [DOI] [PubMed] [Google Scholar]
- 3.Etcheberrigaray R., Matzel L. D., Lederhendler I. I., Alkon D. L. (1992) Proc. Natl. Acad. Sci. U.S.A. 89, 7184–7188 [DOI] [PMC free article] [PubMed] [Google Scholar]
- 4.Sun M. K., Alkon D. L. (2005) Eur. J. Pharmacol. 512, 43–51 [DOI] [PubMed] [Google Scholar]
- 5.Sun M. K., Hongpaisan J., Nelson T. J., Alkon D. L. (2008) Proc. Natl. Acad. Sci. U.S.A. 105, 13620–13625 [DOI] [PMC free article] [PubMed] [Google Scholar]
- 6.Wang D., Darwish D. S., Schreurs B. G., Alkon D. L. (2008) Behav. Pharmacol. 19, 245–256 [DOI] [PubMed] [Google Scholar]
- 7.Kuzirian A. M., Epstein H. T., Gagliardi C. J., Nelson T. J., Sakakibara M., Taylor C., Scioletti A. B., Alkon D. L. (2006) Biol. Bull. 210, 201–214 [DOI] [PubMed] [Google Scholar]
- 8.Hongpaisan J., Alkon D. L. (2007) Proc. Natl. Acad. Sci. U.S.A. 104, 19751–1975618056814 [Google Scholar]
- 9.Racchi M., Mazzucchelli M., Pascale A., Sironi M., Govoni S. (2003) Mol. Psychiatry 8, 209–216 [DOI] [PubMed] [Google Scholar]
- 10.Zhu G., Wang D., Lin Y. H., McMahon T., Koo E. H., Messing R. O. (2001) Biochem. Biophys. Res. Commun. 285, 997–1006 [DOI] [PubMed] [Google Scholar]
- 11.Kanno T., Yamamoto H., Yaguchi T., Hi R., Mukasa T., Fujikawa H., Nagata T., Yamamoto S., Tanaka A., Nishizaki T. (2006) J. Lipid Res. 47, 1146–1156 [DOI] [PubMed] [Google Scholar]
- 12.Jin G., Huang X., Black R., Wolfson M., Rauch C., McGregor H., Ellestad G., Cowling R. (2002) Anal. Biochem. 302, 269–275 [DOI] [PubMed] [Google Scholar]
- 13.Nelson T. J., Alkon D. L. (1995) J. Neurochem. 65, 2350–2357 [DOI] [PubMed] [Google Scholar]
- 14.Johnson G. D., Ahn K. (2000) Anal. Biochem. 286, 112–118 [DOI] [PubMed] [Google Scholar]
- 15.Tanaka A., Nishizaki T. (2003) Bioorg. Med. Chem. Lett. 13, 1037–1040 [DOI] [PubMed] [Google Scholar]
- 16.Furukawa J., Kawabata N., Nishimura J. (1968) Tetrahedron 24, 53–58 [Google Scholar]
- 17.Denmark S. E., Edwards J. P. (1991) J. Org. Chem. 56, 6974–6981 [Google Scholar]
- 18.Nelson T. J., Alkon D. L. (2009) Trends Biochem. Sci. 34, 136–145 [DOI] [PubMed] [Google Scholar]
- 19.Lorenzo P. S., Bögi K., Hughes K. M., Beheshti M., Bhattacharyya D., Garfield S. H., Pettit G. R., Blumberg P. M. (1999) Cancer Res. 59, 6137–6144 [PubMed] [Google Scholar]
- 20.Lee H. W., Smith L., Pettit G. R., Smith J. B. (1997) Mol. Pharmacol. 51, 439–447 [PubMed] [Google Scholar]
- 21.Lu Z., Hornia A., Jiang Y. W., Zang Q., Ohno S., Foster D. A. (1997) Mol. Cell. Biol. 17, 3418–3428 [DOI] [PMC free article] [PubMed] [Google Scholar]
- 22.da Cruz e Silva O. A., Rebelo S., Vieira S. I., Gandy S., da Cruz e Silva E. F., Greengard P. (2009) J. Neurochem. 108, 319–330 [DOI] [PMC free article] [PubMed] [Google Scholar]
- 23.Petanceska S. S., Seeger M., Checler F., Gandy S. (2000) J. Neurochem. 74, 1878–1884 [DOI] [PubMed] [Google Scholar]
- 24.Thinakaran G., Teplow D. B., Siman R., Greenberg B., Sisodia S. S. (1996) J. Biol. Chem. 271, 9390–9397 [DOI] [PubMed] [Google Scholar]
- 25.Buxbaum J. D., Liu K. N., Luo Y., Slack J. L., Stocking K. L., Peschon J. J., Johnson R. S., Castner B. J., Cerretti D. P., Black R. A. (1998) J. Biol. Chem. 273, 27765–27767 [DOI] [PubMed] [Google Scholar]
- 26.Buxbaum J. D., Koo E. H., Greengard P. (1993) Proc. Natl. Acad. Sci. U.S.A. 90, 9195–9198 [DOI] [PMC free article] [PubMed] [Google Scholar]
- 27.Etcheberrigaray R., Tan M., Dewachter I., Kuipéri C., Van der Auwera I., Wera S., Qiao L., Bank B., Nelson T. J., Kozikowski A. P., Van Leuven F., Alkon D. L. (2004) Proc. Natl. Acad. Sci. U.S.A. 101, 11141–11146 [DOI] [PMC free article] [PubMed] [Google Scholar]
- 28.Choi D. S., Wang D., Yu G. Q., Zhu G., Kharazia V. N., Paredes J. P., Chang W. S., Deitchman J. K., Mucke L., Messing R. O. (2006) Proc. Natl. Acad. Sci. U.S.A. 103, 8215–8220 [DOI] [PMC free article] [PubMed] [Google Scholar]
- 29.Mischak H., Goodnight J. A., Kolch W., Martiny-Baron G., Schaechtle C., Kazanietz M. G., Blumberg P. M., Pierce J. H., Mushinski J. F. (1993) J. Biol. Chem. 268, 6090–6096 [PubMed] [Google Scholar]
- 30.Van Kolen K., Pullan S., Neefs J. M., Dautzenberg F. M. (2008) J. Neurochem. 104, 1–13 [DOI] [PubMed] [Google Scholar]
- 31.Wetsel W. C., Khan W. A., Merchenthaler I., Rivera H., Halpern A. E., Phung H. M., Negro-Vilar A., Hannun Y. A. (1992) J. Cell Biol. 117, 121–133 [DOI] [PMC free article] [PubMed] [Google Scholar]
- 32.Shirai Y., Adachi N., Saito N. (2008) FEBS J. 275, 3988–3994 [DOI] [PubMed] [Google Scholar]
- 33.Leach K. L., Blumberg P. M. (1985) Cancer Res. 45, 1958–1963 [PubMed] [Google Scholar]
- 34.Lanni C., Mazzucchelli M., Porrello E., Govoni S., Racchi M. (2004) Eur. J. Biochem. 271, 3068–3075 [DOI] [PubMed] [Google Scholar]
- 35.Rossner S., Ueberham U., Schliebs R., Perez-Polo J. R., Bigl V. (1998) Prog. Neurobiol. 56, 541–569 [DOI] [PubMed] [Google Scholar]
- 36.Caccamo A., Oddo S., Billings L. M., Green K. N., Martinez-Coria H., Fisher A., LaFerla F. M. (2006) Neuron 49, 671–682 [DOI] [PubMed] [Google Scholar]
- 37.Barnes P. J., Haddad E. B., Rousell J. (1997) Life Sci. 60, 1015–1021 [DOI] [PubMed] [Google Scholar]
- 38.VanDeMark K., Guizzetti M., Giordano G., Costa L. G. (2009) J. Pharmacol. Exp. Ther. 329, 532–542 [DOI] [PMC free article] [PubMed] [Google Scholar]
- 39.Du X., Iacovitti L. (1997) J. Neurochem. 68, 564–569 [DOI] [PubMed] [Google Scholar]
- 40.Lallemend F., Hadjab S., Hans G., Moonen G., Lefebvre P. P., Malgrange B. (2005) J. Cell Sci. 118, 4511–4525 [DOI] [PubMed] [Google Scholar]
- 41.Rankin S. L., Guy C. S., Rahimtula M., Mearow K. M. (2008) Brain Res. 1217, 10–24 [DOI] [PubMed] [Google Scholar]
- 42.Rossner S., Ueberham U., Schliebs R., Perez-Polo J. R., Bigl V. (1998) J. Neurochem. 71, 757–766 [DOI] [PubMed] [Google Scholar]
- 43.Zampieri N., Chao M. V. (2006) Biochem. Soc. Trans. 34, 607–611 [DOI] [PubMed] [Google Scholar]
- 44.Ahmed Z., Mazibrada G., Seabright R. J., Dent R. G., Berry M., Logan A. (2006) FASEB J. 20, 1939–1941 [DOI] [PubMed] [Google Scholar]


