Abstract
Although metastasis-associated protein 1 (MTA1) has recently been shown as a DNA damage responsive protein, the underlying mechanism for its role in DNA double-strand break (DSB) repair remains unknown. Here, we show that MTA1 controls p53 stability through inhibiting its ubiquitination by E3 ubiquitin ligases mouse double minute 2 (Mdm2) and constitutive photomorphogenic protein 1 (COP1). The underlying mechanisms involve the ability of MTA1 to compete with COP1 to bind to p53 and/or to destabilize COP1 and Mdm2. Consequently, MTA1 regulates the p53-dependent transcription of p53R2, a direct p53 target gene for supplying nucleotides to repair damaged DNA. Depletion of MTA1 impairs p53-dependent p53R2 transcription and compromises DNA repair. Interestingly, these events could be reversed by MTA1 reintroduction, indicating that MTA1 interjects into the p53-dependent DNA repair. Given the fact that MTA1 is widely up-regulated in human cancers, these findings in conjunction with our earlier finding of a crucial role of MTA1 in DSB repair suggest an inherent role of the MTA1-p53-p53R2 pathway in DNA damage response in cancer cells.
Introduction
The p53 tumor suppressor is a central component of cellular mechanisms that respond to DNA damage signals to preserve genomic integrity (1, 2). Under physiological conditions, p53 is tightly regulated and normally maintained at low levels by the action of several RING finger E3 ubiquitin ligases, including constitutive photomorphogenic protein 1 (COP1) (3), mouse double minute 2 (Mdm2) (4, 5), and p53-induced protein with a RING H2 domain (Pirh2) (6). All of these ligases are transcriptionally stimulated by the p53 protein and in turn, target p53 for the ubiquitin-dependent proteolysis, thereby creating tight negative feedback loops for controlling p53 protein stability (7). Accordingly, disruption of these autoregulatory feedback loops is a pivotal event for the activation of p53 in response to various genotoxic stresses (8, 9). Following DNA damage, p53 protein is stabilized and activated through post-translational modifications, resulting in a controlled activation of a series of downstream target genes that mediate its functions (10–12). In addition to its important functions in cell cycle arrest and apoptosis (2, 12), the p53 protein plays a critical role in regulating DNA repair caused by various genotoxic stresses (13–17). Loss of p53 function leads to decreased repair of damaged DNA and is reflected by increased sensitivity to DNA damage agents. Therefore, blocking the p53-induced DNA repair could prove to be an efficient approach to enhance the efficacy of DNA-damaging agents (18).
Recently, numerous potential mechanisms have been described as to how p53 functions to regulate DNA repair. p53 directly associates with TFIIH, a nucleotide excision repair component (19) and transactivates genes implicated in DNA repair, such as p53R2, a newly identified subunit of ribonucleotide reductase (20, 21). The ability of p53R2 to supply nucleotides for repairing DNA damage requires the presence of a functional p53 protein, and inactivation of p53 directly interferes with the transcription of p53R2 in response to DNA damage (20). In function, inactivation of p53R2 impairs DNA repair and sensitizes several types of cancer cells to DNA-damaging anticancer agents or to ionizing radiation (IR) (20, 22, 23). Thus, it is quite clear that p53 protein plays a critical role in regulating DNA repair caused by various genotoxic stresses through transcriptional induction of p53R2.
The metastasis-associated protein (MTA)2 family represents an emerging family of ubiquitously expressed chromatin modifiers, which have an integral role in the nucleosome remodeling and histone-deacetylase (NuRD) complexes (24, 25). The members of MTA family have been shown to interact and deacetylate non-histone proteins. For example, the MTA2- histone deacetylase 1 (HDAC1) complex has been shown to deacetylate p53 and represses the ability of p53 to stimulate the transcription of genes important in growth and apoptosis (26). However, MTA family members exist in distinct NuRD complexes, and functional redundancy is lacking among MTA family members (27). MTA1 is highly up-regulated in a variety of human cancers with metastatic potential (28–30). Recent data suggest that MTA1 may interact with p53 (27, 31), but there are conflicting reports about its effect on p53 levels with no mechanistic insights (32, 33), and thus, the effect of MTA1 on p53 expression and involvement of MTA1 in p53-dependent DNA damage response remain unclear.
Recent data from our laboratory suggest that MTA1 is a DNA damage responsive protein as it is stabilized in response to IR, and facilitates DNA double-strand break (DSB) repair (34), but the underlying mechanism remains unknown. Here, using a variety of genetic, biochemical, and molecular approaches, we show that MTA1 is a direct stabilizer of the p53 protein by inhibiting its ubiquitination by E3 ligases, and therefore regulates p53-dependent function in DNA repair. These findings in conjunction with our earlier finding of a crucial role of MTA1 in DSB repair suggest that MTA1 is a potential therapeutic target that could be used to enhance the effectiveness of IR or DNA-damaging anticancer agents in cancer cells by targeting MTA1 expression.
EXPERIMENTAL PROCEDURES
Cell Lines and Cell Culture
Human U2OS, MCF-7, H1299, and HEK293 cells were obtained from the American Type Culture Collection (Manassas, VA). p53−/−/Mdm2−/− double knock-out mouse embryonic fibroblasts (MEFs) were kindly provided by Dr. G. Lozano (M. D. Anderson Cancer Center, Houston, TX). MTA1+/+ and MTA1−/− MEFs were generated in our laboratory from embryos at day 9 of development by using a standard protocol (35). Stable clones of MTA1−/− MEFs stably expressing V5-MTA1, and of MCF-7/pcDNA3.1 and MCF-7/T7-MTA1 have been described previously (34, 36). All cell lines were grown in the recommended medium by the providers supplemented with 10% fetal bovine serum and 1× antibiotic-antimycotic solution in a humidified 5% CO2 at 37 °C. Cell culture medium and additives were obtained from Invitrogen (Carlsbad, CA) if not otherwise stated.
Expression Vectors, Recombinant Proteins, siRNA, and Transfections
The following mammalian expression vectors were used in this study: pCMV-p53 (Duen-Hwa Yan, M. D. Anderson Cancer Center, Houston, TX), hemagglutinin (HA)-tagged ubiquitin (HA-Ub) (Peter B. Zhou, UT Medical School, Galveston, TX), pCMV-Mdm2 (Yanping Zhang, University of North Carolina at Chapel Hill, NC), pcDNA3-Flag-Mdm2 (Xiongbin Lu, University of South Carolina), glutathione S-transferase (GST)-Mdm2 deletion constructs (Mark K Saville, University of Dundee, UK), and GST-p53 deletion constructs (Arnold J. Levine, University of Medicine and Dentistry of New Jersey, Rutger, NJ). Full-length COP1 cDNA was subcloned into pcDNA3.1-T7 vector (Invitrogen) to generate T7-tagged COP1. Myc-tagged MTA1 (Myc-MTA1) and V5-tagged MTA1 (V5-MTA1) were generated by polymerase chain reaction (PCR)-based subcloning of full-length MTA1 cDNA into pCMV-Myc vector (Clontech, Mountain View, CA) and pcDNA6/V5-His C vector (Invitrogen), respectively. All GST recombinant proteins were expressed in Escherichia coli strain BL21 (DE3) (Stratagene, La Jolla, CA) and subsequently purified using the glutathione-Sepharose 4B batch method (Amersham Biosciences). In vitro transcription/translation of recombinant protein was performed using the TnT Quickcoupled Transcription/Translation system (Promega, Madison, WI). Plasmid transfections were carried out using FuGENE HD Transfection Reagent (Roche Applied Science) according to the manufacturer's instructions. Cells were cotransfected with the indicated vectors, and the total amounts of DNA were equalized with corresponding empty vectors. Specific siRNAs targeting human MTA1 (Cat. M-004127-02) and non-targeting control siRNAs (Cat. D-001210-01) were obtained from Dharmacon (Lafayette, CO). The transfection of siRNA was performed twice at 24-h intervals with Oligofectamine Reagent (Invitrogen) according to the manufacturer's protocol. Cells were collected after 36 h of transfection for further analyses.
Antibodies and Reagents
Sources of antibodies were as follows: rabbit polyclonal anti-p53 (FL393) (Santa Cruz Biotechnology, Santa Cruz, CA), anti-Flag (Sigma-Aldrich), anti-MTA1, and anti-COP1 (Bethyl Laboratories, Montgomery, TX), goat polyclonal anti-MTA1 (C17) (Santa Cruz Biotechnology), and rat monoclonal anti-HA (3F10) (Roche Applied Science). Mouse monoclonal anti-p53 (DO-1) (Santa Cruz Biotechnology), anti-Myc (9E10.3) (Neomarkers, Fremont, CA), anti-ubiquitin (P4D1) (Cell Signaling Technology, Danvers, MA), anti-Mdm2 (Ab-1 and Ab-4) (Calbiochem, San Diego, CA), anti-Flag (M2), and anti-actin (AC40) (Sigma-Aldrich). Horseradish peroxidase-conjugated secondary antibodies (Amersham Biosciences; eBioscience, San Diego, CA), alkaline phosphatase (AP)-conjugated secondary antibodies (Santa Cruz Biotechnology), and enhanced chemiluminescence (ECL) reagents (Amersham Biosciences). All of the primary antibodies were used according to the manufacturer's instructions. All reagents were from Sigma unless otherwise stated.
Comet Assay
The comet assay was performed as described previously with some modifications (37). Cells were irradiated with 10 Gy of IR, harvested at the indicated time points, and mixed with low melting temperature agarose. After lysis, electrophoresis was performed at 1 V/cm and 15 mA for 40 min. Slides were stained with SYBG green dye for 10 min. Fifty randomly selected cells per sample were captured under a Zeiss fluorescent microscope, and digital fluorescent images were obtained by using AxioVision software. The relative length and intensity of SYBG green-stained DNA tails to heads was proportional to the amount of DNA damage present in the individual nuclei and was measured by Olive tail moment using TriTek Comet Score software (TriTek). The changes in percentage of the relative comet tail moment between treatment (irradiation) and control shown in all histograms represent the averages of three independent experiments (n = 50) (lower panel).
Pulse Chase Analysis
Cells were plated in 60-mm dishes. One day later, the cells were incubated in Dulbecco's modified Eagle's medium (no l-glutamine, sodium pyruvate, l-methionine, or l-cystine) (Invitrogen, Cat. 21013-024) supplemented with 5% dialyzed fetal bovine serum, 1× l-glutamine, 1× sodium pyruvate (Invitrogen), and 100 μCi of EXPRE35S35S protein labeling mix (11 mCi/ml, PerkinElmer, Waltham, MA) for 1–2 h. The medium was replaced with Dulbecco's modified Eagle's medium containing 5% dialyzed fetal calf serum, 1× l-glutamine, 1× sodium pyruvate, 2 mm l-methionine, and 2 mm l-cystine (Sigma). At timed intervals during the chase period, cells lysates were prepared in Nonidet P-40 lysis buffer (50 mm Tris-HCl, pH 8, 150 mm NaCl, 0.5% Nonidet P-40, 10% glycerol, 2 mm MgCl2, and1 mm EDTA) and immunoprecipitated using the indicated antibodies. Immunocomplexes were resolved by SDS-PAGE and analyzed by phosphorimage analysis (GE Healthcare, Waukesha, WI).
Quantitative Real-time PCR
Total RNA was isolated by using TRIzol reagent (Invitrogen), and 2 μg of total RNA was reverse-transcribed using the SuperScript III First-strand synthesis system for reverse transcriptase-PCR (RT-PCR) (Invitrogen). Quantitative real-time PCR (qPCR) was done by using iQTM SYBR Green Supermix (Bio-Rad) on an iCycler iQ real-time PCR detection system (Bio-Rad). The values for specific genes were normalized to actin housekeeping controls. Primer sequences are available in the supplemental Table S1. Ionizing radiation (IR), in vivo ubiquitination assay, cycloheximide analysis, Western blot, and immunoprecipitation (IP) have been described previously in detail (34).
RESULTS AND DISCUSSION
MTA1, a New Upstream Stabilizer of p53
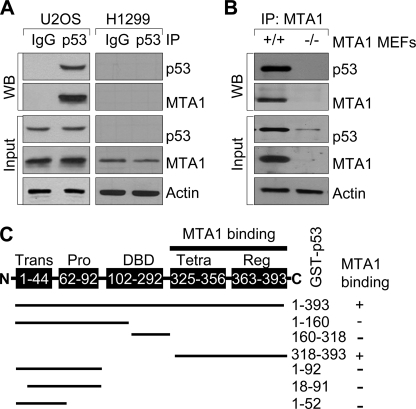
To explore a potential functional link between the MTA1 and p53 pathways, we first examined whether these two proteins interact using the wild-type p53-expressing human osteosarcoma U2OS cells (5) or p53-null human lung cancer H1299 cells (4). Consistent with previous studies (27, 31), we found an interaction between the endogenous MTA1 and p53 in the U2OS cells but not in the H1299 cells (negative control) (Fig. 1A). Furthermore, using MTA1 knock-out (MTA1−/−) MEFs (35) as negative control, we also confirmed the interaction between p53 and MTA1 in the wild-type (MTA1+/+) but not in the MTA1−/− MEFs (Fig. 1B). To determine whether MTA1 directly binds to p53, we next performed in vitro GST pull-down assays using 35S-labeled, in vitro-translated MTA1 protein and full-length GST-p53 fusion protein (38), and found that 35S-labeled MTA1 strongly bound to GST-p53 protein (supplemental Fig. S1A, lane 4). To further identify the regions of p53 involved in binding MTA1, we used a series of GST-p53 fusion proteins (38) and analyzed their ability to bind to 35S-labeled, in vitro-translated, full-length MTA1. We found that the observed MTA1 binding to p53 was confined to amino acids 318–393 in the C terminus (Fig. 1C and supplemental Fig. S1B). These findings in conjunction with other studies (27, 31) demonstrated that MTA1 physically associates with p53 in vitro and in vivo.
FIGURE 1.
MTA1 physically interacts with p53. A, protein extracts from the wild-type p53-expressing U2OS or p53-null H1299 (negative control) cells were immunoprecipitated with an anti-p53 antibody or IgG control, and immunoblotted with the indicated antibodies. B, protein extracts from the MTA1+/+ or MTA1−/− (negative control) MEFs were immunoprecipitated with an anti-MTA1 antibody and immunoblotted with the indicated antibodies. C, diagrammatic summary of in vitro-translated MTA1 binding with a series of GST-p53 constructs. Trans, transactivation domain; Pro, proline-rich domain; DBD, DNA binding domain; Tetra, tetramerization domain; Reg, regulatory domain.
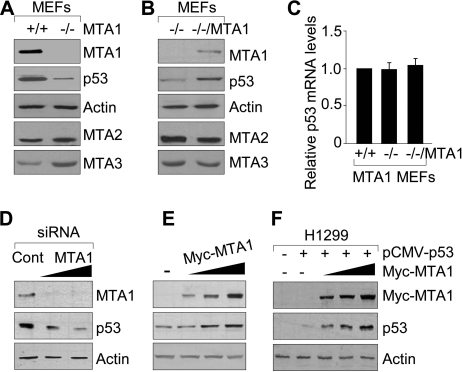
We next examined the effect of MTA1 depletion on the levels of endogenous p53. Interestingly, we discovered a marked reduction in the level of p53 protein in the MTA1−/− MEFs relative to its level in the wild-type (MTA1+/+) controls (Fig. 2A). Furthermore, the noticed p53 reduction in the MTA1−/− MEFs could be substantially reverted by reintroduction of MTA1 in the MTA1−/− MEFs (MTA1−/−/MTA1) (Fig. 2B). To assess whether the ability of MTA1 to affect p53 status in cells is caused by a transcriptional effect or not, we found no discernible difference in the level of p53 mRNA among the MTA1+/+, MTA1−/−, and MTA1−/−/MTA1 MEFs as assayed by qPCR (Fig. 2C), indicating a post-translational regulatory role of MTA1 in controlling the cellular level of p53 protein. To validate these findings, we showed that selective siRNA-mediated knockdown of the endogenous MTA1 in the U2OS cells lead to a dose-dependent reduction in p53 protein (Fig. 2D). Conversely, induced expression of MTA1 in the U2OS cells (Fig. 2E) or wild-type human p53 either alone or with increasing amounts of MTA1 in the p53-null H1299 cells (Fig. 2F) increases the steady-state levels of p53. Collectively, these findings suggest that MTA1 controls p53 protein expression through a post-translational regulation mechanism.
FIGURE 2.
MTA1 is an upstream stabilizer of p53. A and B, protein extracts from MTA1+/+ and MTA1−/− MEFs (A) or from the MTA1−/− and MTA1−/−/V5-MTA1 MEFs (B) were subjected to Western blot analysis with the indicated antibodies. C, qPCR analysis of p53 mRNA levels in the MTA1+/+, MTA1−/−, and MTA1−/−/MTA1 MEFs. D and E, Western blot analysis of MTA1 and p53 protein expression in the U2OS cells transfected with increasing amounts of specific siRNA targeting human MTA1 or control siRNA (D) or transfected with increasing amounts of Myc-MTA1 expression plasmids (E). F, H1299 cells were transfected with the pCMV-p53 plasmid either alone or in combination with increasing amounts of Myc-MTA1, and the expression of MTA1 and p53 proteins was detected by Western blot analysis.
Regulation of p53 Ubiquitination by MTA1
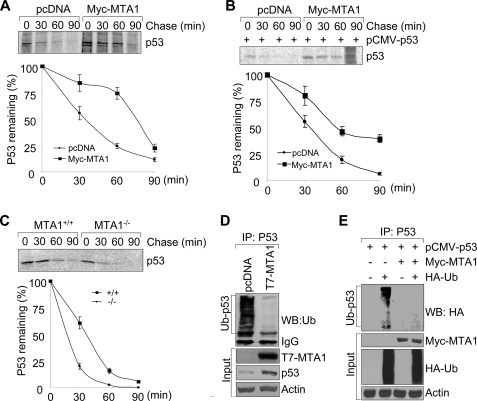
To further confirm the above observations, we next tested whether MTA1 affects the protein stability of p53 protein. As shown in supplemental Fig. S2, induced expression of MTA1 in the U2OS and H1299 cells in the presence of cycloheximide, an inhibitor of protein biosynthesis, enhances the half-life of p53 protein relative to the empty vector-transfected cells. To further confirm these findings, we performed the classic pulse chase experiments using metabolic labeling of cells with [35S]methionine. In agreement with the above observations, we found that MTA1 expression increases the half-life of both endogenous and exogenously transfected p53 protein in the wild-type p53-expressing U2OS (Fig. 3A) and p53-null H1299 (Fig. 3B) cells, respectively. To examine whether p53 half-life is critically regulated by endogenous MTA1 levels, we performed the metabolic labeling experiments as described above using the MTA1+/+ and MTA1−/− MEFs. As shown in Fig. 3C, knock-out of MTA1 causes a marked decrease in the half-life of p53 protein. Collectively, these results suggest that MTA1 controls the stability of p53 protein and consequently may constitute a new upstream regulator of p53 protein.
FIGURE 3.
MTA1 regulates p53 protein stability by inhibiting its ubiquitination. A and B, U2OS (A) or H1299 (B) cells were transfected with the indicated expression vectors. After 36 h of transfection, cells were labeled using [35S]methionine and subjected to pulse chase analysis. Cells were harvested at various time points during the chase period and immunoprecipitated using an anti-p53 antibody. Complexes were resolved by SDS-PAGE and exposed to storage phosphor screens. The intensity of the labeled p53 band was quantified by phosphorimage analysis using ImageQuant software (Molecular Dynamics), and the percent p53 remaining was calculated relative to that at the beginning of the chase period (time 0). The mean values from three independent experiments are shown. C, MTA1+/+ and MTA1−/− MEFs were labeled using [35S]methionine and subjected to pulse chase analysis as described above. D, protein extracts from the MCF-7/pcDNA and MCF-7/T7-MTA1 cells were subjected to IP with an anti-p53 antibody, following by Western blot analysis with the indicated antibodies. E, HEK293 cells were transfected with the indicated plasmids and subjected to the sequential IP/Western blot analysis as described above.
Regulation of p53 stability is achieved through a series of post-translational modifications, including ubiquitination (39). To test whether MTA1 stabilizes p53 by inhibiting its ubiquitination, we examined the effect of MTA1 on the levels of endogenous p53 ubiquitination in the MCF-7/pcDNA and MCF-7/T7-MTA1 stable clone cells (36). As shown in Fig. 3D, overexpression of MTA1 in the MCF-7 cells was accompanied by a decreased endogenous p53 ubiquitination and increased p53 protein. Similarly, Myc-MTA1 expression in HEK 293 cells also suppressed the level of p53 ubiquitination (Fig. 3E). To document the specificity of the noticed inhibitory effect of MTA1 on p53 ubiquitination, we showed that there was no inhibitory effect of MTA2 or MTA3 on p53 ubiquitination in HEK293 cells (supplemental Fig. S3). These findings suggest that MTA1 stabilizes p53 protein by, at least in part, inhibiting its ubiquitination.
MTA1 Inhibits the COP1-mediated p53 Ubiquitination and Degradation
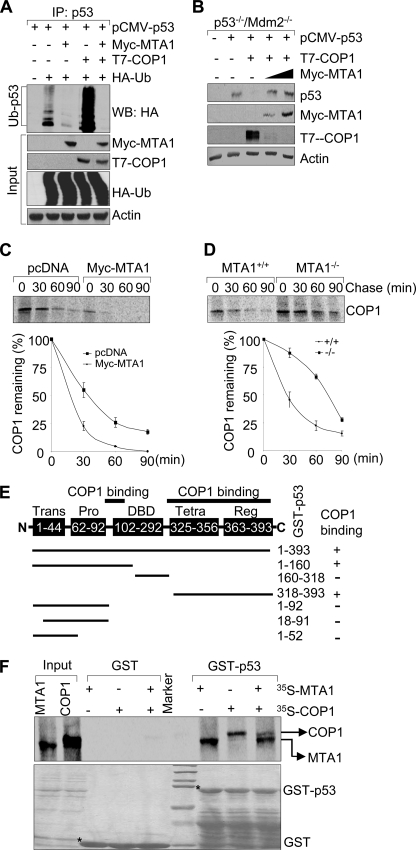
The p53 ubiquitination is primarily mediated by RING finger E3 ubiquitin ligases COP1 (3), Mdm2 (4, 5), and Pirh2 (6), leading to its proteasomal degradation. We next examined the effect of MTA1 on p53 ubiquitination mediated by these E3 ligases in HEK293 cells. We found that forced expression of MTA1 markedly abrogates p53 ubiquitination induced by COP1 (Fig. 4A, compare lane 5 with lane 4). In contrast, MTA1 expression only marginally inhibited the Pirh2-mediated p53 ubiquitination (supplemental Fig. S4). Given the fact that COP1 is a critical negative regulator of p53 (3) and emerging evidence that MTA1 promotes COP1 degradation by enhancing its auto-ubiquitination (34), we next tested whether MTA1 could protect p53 from degradation by COP1. To this end, the p53−/−/Mdm2−/− double-null MEFs (40) were transfected with pCMV-p53 either alone or in combination with a constant amount of T7-COP1, or with increasing amounts of Myc-MTA1. We found that COP1 expression in this experimental system leads to p53 degradation as expected (3). However, coexpression of MTA1 efficiently restored the levels of p53 by preventing its degradation by COP1 (Fig. 4B), presumably because of down-regulation of COP1 by MTA1(34), and thereby, rescuing p53 from COP1-mediated degradation. To further confirm this notion, we next examined the impact of MTA1 on COP1 stability by pulse chase analysis and found that induced expression of MTA1 in U2OS cells decreases the half-life of endogenous COP1 (Fig. 4C). In support of these findings, knock-out of MTA1 increases the half-life of endogenous COP1 (Fig. 4D). These results suggest that MTA1 inhibits the COP1-mediated p53 ubiquitination and degradation through, at least in part, destabilizing COP1.
FIGURE 4.
MTA1 inhibits the COP1-mediated p53 ubiquitination and degradation. A, HEK293 cells were transfected with the indicated plasmids. After 36 h of transfection, total cell lysates were prepared and subjected to the sequential IP/Western blot analysis with the indicated antibodies. B, p53−/−/Mdm2−/− double-null MEFs were transfected with the indicated expression vectors and immunoblotted with the indicated antibodies. C and D, U2OS cells transfected the indicated expression vectors (C) or MTA1+/+ and MTA1−/− MEFs (D) were labeled using [35S]methionine and subjected to pulse chase analysis as described above except that immunoprecipitations were carried out using an anti-COP1 antibody. E, schematic representation of the domains of p53 protein for COP1 binding. Trans, transactivation domain; Pro, proline-rich domain; DBD, DNA binding domain; Tetra, tetramerization domain; Reg, regulatory domain. F, in vitro competition binding assay of MTA1 and COP1 to p53. In vitro-translated 35S-labeled MTA1 or COP1 protein was incubated with GST or GST-p53-fused protein. Bound proteins were separated and analyzed by SDS-PAGE and autoradiography.
Because both COP1 (3) and MTA1 (Fig. 1C) (27) could directly interact with p53, we next explored an additional mechanistic possibility that MTA1 and COP1 may compete for binding to p53. In this context, because the exact p53 binding region for COP1 remains unknown, we first mapped the regions of p53 involved in binding COP1 using a series of GST-p53 fusion proteins (38). Results showed that 35S-labeled, in vitro-translated COP1 binds to the DNA binding domain (amino acids 92–160) and the C-terminal domain (amino acids 318–393) of p53 (Fig. 4E and supplemental Fig. S5). Because both MTA1 (Fig. 1C) and COP1 (Fig. 4E) proteins bind the amino-acids 318–393 in the C terminus of p53, it raised the possibility of competition of two proteins to a common p53 binding region. Indeed, we found that MTA1 and COP1 could interact with p53 and co-incubation of both MTA1 and COP1 blocks COP1 binding to p53 (Fig. 4F). In brief, MTA1 overexpression may inhibit the COP1-mediated p53 degradation by destabilizing COP1 (34) or by competing with COP1 to bind to p53 or by both mechanisms.
MTA1 Inhibits the Mdm2-mediated p53 Degradation
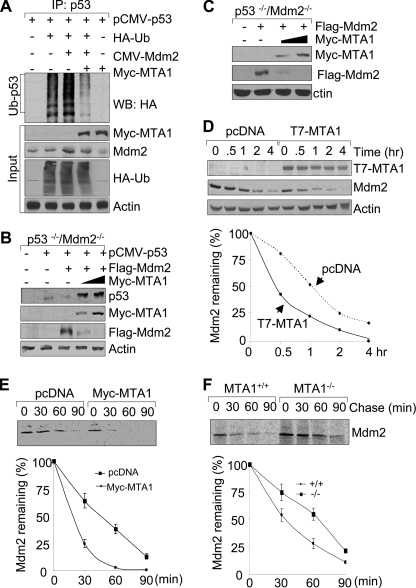
In addition to COP1, Mdm2 is another critical cellular antagonist of p53 (4, 5). Similar to COP1, we found that MTA1 also inhibits the Mdm2-mediated ubiquitination of p53 (Fig. 5A). To determine whether MTA1 could protect p53 from the Mdm2-mediated degradation, the p53−/−/Mdm2−/− MEFs were transfected with pCMV-p53 either alone or in combination with a constant amount of pCMV-Mdm2, and increasing amounts of Myc-MTA1. Consistent with previous reports (4, 5), Mdm2 overexpression decreases the level of p53. However, concurrent expression of MTA1 was accompanied by a reduced level of Mdm2 and in turn, increased amount of its target p53 (Fig. 5B). To identify the underlying mechanism of this event, we found that MTA1 overexpression led to a reduction in the level of the exogenously expressed Flag-Mdm2 in the p53−/−/Mdm2−/− MEFs (Fig. 5C). To test whether MTA1 expression affects the stability of Mdm2 protein, we measured the half-life of Mdm2 in the MCF-7/pcDNA and MCF-7/T7-MTA1 cells (36). Results indicated that the half-life of Mdm2 is substantially longer in the MCF7/pcDNA cells than that in the MCF7/T7-MTA1 cells (Fig. 5D), suggesting a destabilizing effect of MTA1 on Mdm2. To further confirm these findings, we performed the classic pulse chase experiments using metabolic labeling of cells with [35S]methionine. In line with the above observations, we found that induced expression of MTA1 in U2OS cells decreases the half-life of Mdm2 (Fig. 5E). In contrast, knock-out of MTA1 increases the half-life of endogenous Mdm2 (Fig. 5F). Although MTA1 expression promoted Mdm2 degradation (Fig. 5, B and C), paradoxically, it did not promote Mdm2 self-ubiquitination (supplemental Fig. S6) as was the case with COP1 (34). These findings are consistent with the recently emerging notion that the Mdm2 E3 function is not required for its self-degradation (41), the significance of which continues to be an important research question. Because Mdm2 (38) and MTA1 (Fig. 1C) bind to the different domains of p53, no binding competition is expected between these proteins for p53 binding as was the case for COP1 (Fig. 4F). In brief, MTA1 stabilizes p53 levels by down-regulating Mdm2 and thereby, preventing the ability of Mdm2 to ubiquitinate its substrate p53.
FIGURE 5.
MTA1 inhibits the Mdm2-mediated degradation of p53. A, HEK293 cells were transfected with the indicated plasmids and subjected to the sequential IP/Western blot analysis as described above. B and C, p53−/−/Mdm2−/− double-null MEFs were transfected with the indicated expression vectors and immunoblotted with the indicated antibodies. D, MCF-7/pcDNA and MCF-7/T7-MTA1 cells were treated with 100 μg/ml of cycloheximide and harvested at indicated times for Western blot analysis with the indicated antibodies (upper panel). Western blots were subjected to densitometric analysis and results were normalized based on actin expression levels and reported in graphical form (lower panel). E and F, U2OS cells transfected the indicated expression vectors (E) or MTA1+/+ and MTA1−/− MEFs (F) were labeled using [35S]methionine and subjected to pulse chase analysis as described above except that immunoprecipitations were carried out using an anti-Mdm2 antibody.
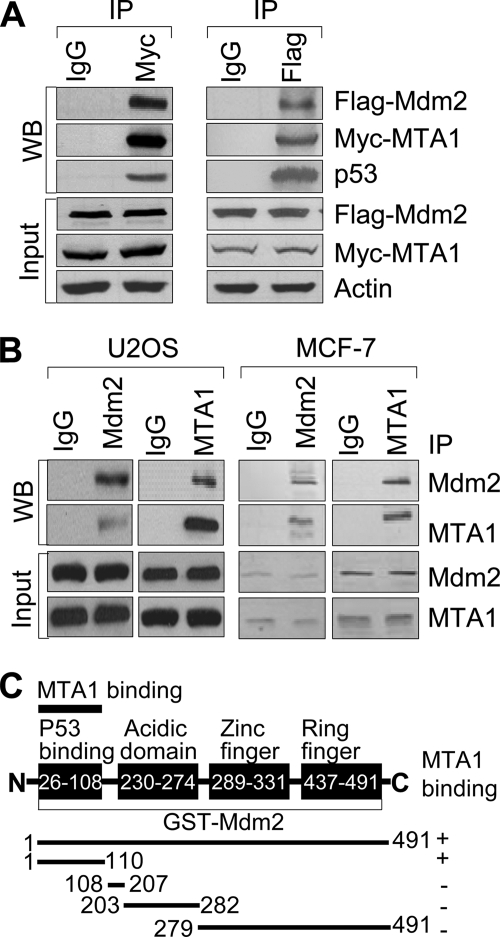
We next determined whether MTA1 could interact with Mdm2. We found that Myc-MTA1 specifically coimmunoprecipitates Flag-Mdm2 in HEK293 cells (Fig. 6A, left panel). Moreover, we also observed this interaction in a reverse experiment using an anti-Flag antibody for IP (Fig. 6A, right panel). More importantly, we also found evidence of a physical interaction between the endogenous MTA1 and Mdm2 in the U2OS and the MCF-7 cells by reciprocal IP using an anti-Mdm2 or anti-MTA1 antibody (Fig. 6B). To support these findings, in vitro GST pull-down assays revealed that indeed, recombinant MTA1 directly interacts with the N terminus of Mdm2 (amino acids 1–110) (Fig. 6C and supplemental Fig. S7). Collectively, these findings along with from the preceding sections suggest that MTA1 stabilizes the level of p53 via, at least in part, inhibiting its ubiquitination by COP1 and Mdm2.
FIGURE 6.
MTA1 physically interacts with Mdm2. A, HEK293 cells were transfected with expression vectors encoding Myc-MTA1 and Flag-Mdm2 and immunoprecipitated with IgG control or specific antibody against Myc or Flag, followed by immunoblotting with the indicated antibodies. B, protein extracts from the U2OS and MCF-7 cells were subjected to IP with anti-Mdm2 or anti-MTA1 antibody or IgG control, followed by Western blot analyses with the indicated antibodies. C, diagrammatic summary of in vitro-translated MTA1 binding with a series of GST-Mdm2 protein.
MTA1 Deficiency Impairs p53-dependent p53R2 Transcription and DNA Repair
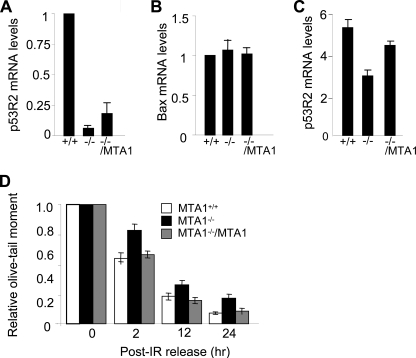
The p53 tumor suppressor is a sequence-specific transcriptional factor that is rapidly stabilized and activated in response to a variety of genotoxic stresses, resulting in a controlled activation of a series of downstream target genes involved in its functions (2, 10, 11, 42). p53R2, a recently identified ribonucleotide reductase, is directly induced by p53 in response to various genotoxic stresses, for supplying nucleotides to repair damaged DNA (20, 21). Thus, inactivation of p53 could directly interfere with damage-induced transcription of p53R2 (20). Given the fact that p53R2 expression is associated with p53 status and that MTA1 controls the steady-state levels of p53 protein (Fig. 2), we next examined whether MTA1 expression affects the p53-dependent p53R2 transcription. We found that the p53 reduction in the MTA1−/− MEFs was accompanied by a corresponding reduction in the level of p53R2 mRNA, compared with its level in MTA1+/+ MEFs (Fig. 7A). Moreover, the reduction of p53R2 mRNA levels in the MTA1−/− MEFs could be partially reverted by the reintroduction of MTA1 in the MTA1−/− MEFs (Fig. 7A); these changes parallel the observed p53 levels in these cells (Fig. 2, A and B). In contrast to p53R2, there was no significant change in the mRNA level of Bax gene, another p53 primary-response gene (43) (Fig. 7B). Although exposure of the MTA1+/+, MTA1−/−, and MTA1−/−/MTA1 MEFs to IR rapidly induced p53R2 mRNA expression in all three cell types, the maximum inducible level of p53R2 remained significantly lower in the MTA1−/− MEFs than that in the MTA1+/+ and MTA1−/−/MTA1 MEFs (Fig. 7C), supporting the idea that MTA1 regulates the p53-dependent p53R2 transcription.
FIGURE 7.
MTA1 deficiency impairs p53-dependent p53R2 transcription and DNA repair. A and B, qPCR analysis of p53R2 (A) or Bax (B) mRNA levels in the MTA1+/+, MTA1−/−, and MTA1−/−/MTA1 MEFs. C, MTA1+/+, MTA1−/−, and MTA1−/−/MTA1 MEFs were treated with 10 Gy of IR and harvested after 2 h of IR treatment for qPCR analysis of p53R2 mRNA levels. D, MTA1+/+, MTA1−/−, and MTA1−/−/MTA1 MEFs were left untreated or treated with 10 Gy of IR, and harvested at the indicated time points. Single cell gel electrophoresis (comet assay) was carried out, and the relative comet tail moment was measured. The changes in percentage of the relative comet tail moment between treatment (irradiation) and control shown in all histograms represent the averages of three independent experiments (n = 50).
Inhibition of endogenous p53R2 expression in cells with an intact p53-dependent DNA damage checkpoint reduces the ability of cell to repair DNA damage and leads to increased sensitivity to genotoxic stress (20, 22, 23). As we discovered that MTA1 is necessary for an efficient induction of p53 target p53R2 (Fig. 7, A and C), we next evaluated whether the DNA repair capacity was compromised in the MTA1−/− cells by performing single cell electrophoresis analysis under the neutral conditions (neutral comet assay) that specifically measures DNA DSBs in cells damaged by IR at the level of individual cells (37, 44). Results showed that, immediately after irradiation (0 h) by 10 Gy of IR, approximately the same amounts of DNA fragments were generated from the MTA1+/+, MTA1−/−, and MTA1−/−/MTA1 MEFs (Fig. 7D). When remaining unrepaired DNA fragments were monitored at various hours after IR treatment, we found that MTA1−/− MEFs exhibited the much higher levels of damaged DNA than the MTA1+/+ and MTA1−/−/MTA1 MEFs (Fig. 7D), suggesting that MTA1 is required for efficient DBS repair.
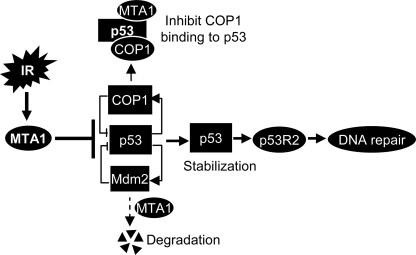
In summary, findings presented here establish that MTA1 controls p53 stability and consequently regulates p53-dependent transcription of p53R2, a gene responsive for supplying nucleotides for DNA repair following DNA damage (Fig. 8). This newly revealed function of MTA1 is mechanistically linked with its (but not MTA2 and MTA3) ability to inhibit p53 ubiquitination by destabilizing COP1 and Mdm2 or by competing with COP1 to bind to p53 protein (Fig. 8). Of interest, there was no compensatory effect of MTA1 depletion in MEFs on the levels of MTA2 (Fig. 2A), which as a part of the NuRD complex has been previously shown to deacetylate p53 and inhibits p53-dependent transcription of genes important in cell growth and apoptosis (26), whereas the role in DNA damage response was not investigated in that study. We found that MTA1 is required for the p53-dependent DNA repair and that inactivation of MTA1 increases the cellular sensitivity to IR-induced DNA damage (Fig. 7D). Because MTA1 is widely up-regulated in human cancers, findings presented here in conjunction with our earlier finding of a crucial role of MTA1 in DSB repair suggest an inherent role of MTA1-p53-p53R2 pathway in DNA damage response in cancer cells.
FIGURE 8.
Working model summarizing the findings presented here. MTA1 controls p53 stability through inhibiting the E3 ubiquitin ligases Mdm2- and COP1-mediated ubiquitination by destabilizing of Mdm2 and COP1 and/or by competing with COP1 to bind to p53, thereby regulating the p53-dependent transcription of p53R2, a direct p53 target gene for supplying nucleotides to repair damaged DNA, suggesting that MTA1 interjects into the p53-dependent DNA repair.
Acknowledgments
We thank Seetharaman Balasenthil and Sherri Luo for the in vivo ubiquitination assay and Comet assay, respectively. We thank Mong-Hong Lee, Duen-Hwa Yan, Shigetsugu Hatakeyama, Peter B. Zhou, Xiongbin Lu, Arnold J. Levine, Mark K. Saville, and Gigi Lozanno for providing essential expression vectors, reagents, and cell lines.
This work was supported, in whole or in part, by National Institutes of Health Grants CA98823 and CA98823-S1 (to R. K.).

The on-line version of this article (available at http://www.jbc.org) contains supplemental Figs. S1–S7 and Table S1.
- MTA
- metastasis-associated protein
- DSB
- double-strand break
- HA
- hemagglutinin
- GST
- glutathione S-transferase
- qPCR
- quantitative PCR
- MEF
- mouse embryonic fibroblast
- IP
- immunoprecipitation.
REFERENCES
- 1.Lakin N. D., Jackson S. P. (1999) Oncogene 18, 7644–7655 [DOI] [PubMed] [Google Scholar]
- 2.Levine A. J. (1997) Cell 88, 323–331 [DOI] [PubMed] [Google Scholar]
- 3.Dornan D., Wertz I., Shimizu H., Arnott D., Frantz G. D., Dowd P., O'Rourke K., Koeppen H., Dixit V. M. (2004) Nature 429, 86–92 [DOI] [PubMed] [Google Scholar]
- 4.Haupt Y., Maya R., Kazaz A., Oren M. (1997) Nature 387, 296–299 [DOI] [PubMed] [Google Scholar]
- 5.Kubbutat M. H., Jones S. N., Vousden K. H. (1997) Nature 387, 299–303 [DOI] [PubMed] [Google Scholar]
- 6.Leng R. P., Lin Y., Ma W., Wu H., Lemmers B., Chung S., Parant J. M., Lozano G., Hakem R., Benchimol S. (2003) Cell 112, 779–791 [DOI] [PubMed] [Google Scholar]
- 7.Harris S. L., Levine A. J. (2005) Oncogene 24, 2899–2908 [DOI] [PubMed] [Google Scholar]
- 8.Dornan D., Shimizu H., Mah A., Dudhela T., Eby M., O'Rourke K., Seshagiri S., Dixit V. M. (2006) Science 313, 1122–1126 [DOI] [PubMed] [Google Scholar]
- 9.Stommel J. M., Wahl G. M. (2004) EMBO J. 23, 1547–1556 [DOI] [PMC free article] [PubMed] [Google Scholar]
- 10.Ashcroft M., Taya Y., Vousden K. H. (2000) Mol. Cell Biol. 20, 3224–3233 [DOI] [PMC free article] [PubMed] [Google Scholar]
- 11.Colman M. S., Afshari C. A., Barrett J. C. (2000) Mutat. Res. 462, 179–188 [DOI] [PubMed] [Google Scholar]
- 12.Riley T., Sontag E., Chen P., Levine A. (2008) Nat. Rev. Mol. Cell Biol. 9, 402–412 [DOI] [PubMed] [Google Scholar]
- 13.Ford J. M., Hanawalt P. C. (1995) Proc. Natl. Acad. Sci. U.S.A. 92, 8876–8880 [DOI] [PMC free article] [PubMed] [Google Scholar]
- 14.Li G., Mitchell D. L., Ho V. C., Reed J. C., Tron V. A. (1996) Am. J. Pathol. 148, 1113–1123 [PMC free article] [PubMed] [Google Scholar]
- 15.Therrien J. P., Drouin R., Baril C., Drobetsky E. A. (1999) Proc. Natl. Acad. Sci. U.S.A. 96, 15038–15043 [DOI] [PMC free article] [PubMed] [Google Scholar]
- 16.Ford J. M., Hanawalt P. C. (1997) J. Biol. Chem. 272, 28073–28080 [DOI] [PubMed] [Google Scholar]
- 17.Zurer I., Hofseth L. J., Cohen Y., Xu-Welliver M., Hussain S. P., Harris C. C., Rotter V. (2004) Carcinogenesis 25, 11–19 [DOI] [PubMed] [Google Scholar]
- 18.Helleday T., Petermann E., Lundin C., Hodgson B., Sharma R. A. (2008) Nat. Rev. Cancer 8, 193–204 [DOI] [PubMed] [Google Scholar]
- 19.Wang X. W., Yeh H., Schaeffer L., Roy R., Moncollin V., Egly J. M., Wang Z., Freidberg E. C., Evans M. K., Taffe B. G., Bohr V. A., Weeda G., Hoeijmakers J. H. J., Forrester K., Harris C. C. (1995) Nat. Genet. 10, 188–195 [DOI] [PubMed] [Google Scholar]
- 20.Tanaka H., Arakawa H., Yamaguchi T., Shiraishi K., Fukuda S., Matsui K., Takei Y., Nakamura Y. (2000) Nature 404, 42–49 [DOI] [PubMed] [Google Scholar]
- 21.Kimura T., Takeda S., Sagiya Y., Gotoh M., Nakamura Y., Arakawa H. (2003) Nat. Genet. 34, 440–445 [DOI] [PubMed] [Google Scholar]
- 22.Devlin H. L., Mack P. C., Burich R. A., Gumerlock P. H., Kung H. J., Mudryj M., DeVere, White R. W. (2008) Mol. Cancer Res. 6, 808–818 [DOI] [PubMed] [Google Scholar]
- 23.Yokomakura N., Natsugoe S., Okumura H., Ikeda R., Uchikado Y., Mataki Y., Takatori H., Matsumoto M., Owaki T., Ishigami S., Aikou T. (2007) Oncol. Rep. 18, 561–567 [PubMed] [Google Scholar]
- 24.Denslow S. A., Wade P. A. (2007) Oncogene 26, 5433–5438 [DOI] [PubMed] [Google Scholar]
- 25.Manavathi B., Kumar R. (2007) J. Biol. Chem. 282, 1529–1533 [DOI] [PubMed] [Google Scholar]
- 26.Luo J., Su F., Chen D., Shiloh A., Gu W. (2000) Nature 408, 377–381 [DOI] [PubMed] [Google Scholar]
- 27.Yao Y. L., Yang W. M. (2003) J. Biol. Chem. 278, 42560–42568 [DOI] [PubMed] [Google Scholar]
- 28.Toh Y., Pencil S. D., Nicolson G. L. (1994) J. Biol. Chem. 269, 22958–22963 [PubMed] [Google Scholar]
- 29.Kumar R., Wang R. A., Bagheri-Yarmand R. (2003) Semin. Oncol. 30, 30–37 [DOI] [PubMed] [Google Scholar]
- 30.Toh Y., Nicolson G. L. (2009) Clin. Exp. Metastasis 26, 215–227 [DOI] [PubMed] [Google Scholar]
- 31.Moon H. E., Cheon H., Lee M. S. (2007) Oncol. Rep. 18, 1311–1314 [PubMed] [Google Scholar]
- 32.Li W., Bao W., Ma J., Liu X., Xu R., Wang R. A., Zhang Y. (2008) FEBS Lett. 582, 869–873 [DOI] [PubMed] [Google Scholar]
- 33.Qian H., Lu N., Xue L., Liang X., Zhang X., Fu M., Xie Y., Zhan Q., Liu Z., Lin C. (2005) Clin. Exp. Metastasis 22, 653–662 [DOI] [PubMed] [Google Scholar]
- 34.Li D. Q., Ohshiro K., Reddy S. D., Pakala S. B., Lee M. H., Zhang Y., Rayala S. K., Kumar R. (2009) Proc. Natl. Acad. Sci. U.S.A. 106, 17493–17498 [DOI] [PMC free article] [PubMed] [Google Scholar]
- 35.Manavathi B., Peng S., Rayala S. K., Talukder A. H., Wang M. H., Wang R. A., Balasenthil S., Agarwal N., Frishman L. J., Kumar R. (2007) Proc. Natl. Acad. Sci. U.S.A. 104, 13128–13133 [DOI] [PMC free article] [PubMed] [Google Scholar]
- 36.Mazumdar A., Wang R. A., Mishra S. K., Adam L., Bagheri-Yarmand R., Mandal M., Vadlamudi R. K., Kumar R. (2001) Nat. Cell Biol. 3, 30–37 [DOI] [PubMed] [Google Scholar]
- 37.Olive P. L., Banáth J. P. (2006) Nat. Protoc. 1, 23–29 [DOI] [PubMed] [Google Scholar]
- 38.Chen J., Marechal V., Levine A. J. (1993) Mol. Cell Biol. 13, 4107–4114 [DOI] [PMC free article] [PubMed] [Google Scholar]
- 39.Brooks C. L., Gu W. (2006) Mol. Cell 21, 307–315 [DOI] [PMC free article] [PubMed] [Google Scholar]
- 40.McMasters K. M., Montes de Oca Luna R., Peña J. R., Lozano G. (1996) Oncogene 13, 1731–1736 [PubMed] [Google Scholar]
- 41.Itahana K., Mao H., Jin A., Itahana Y., Clegg H. V., Lindström M. S., Bhat K. P., Godfrey V. L., Evan G. I., Zhang Y. (2007) Cancer Cell 12, 355–366 [DOI] [PubMed] [Google Scholar]
- 42.Lavin M. F., Gueven N. (2006) Cell Death Differ. 13, 941–950 [DOI] [PubMed] [Google Scholar]
- 43.Miyashita T., Reed J. C. (1995) Cell 80, 293–299 [DOI] [PubMed] [Google Scholar]
- 44.Singh N. P., McCoy M. T., Tice R. R., Schneider E. L. (1988) Exp. Cell Res. 175, 184–191 [DOI] [PubMed] [Google Scholar]


