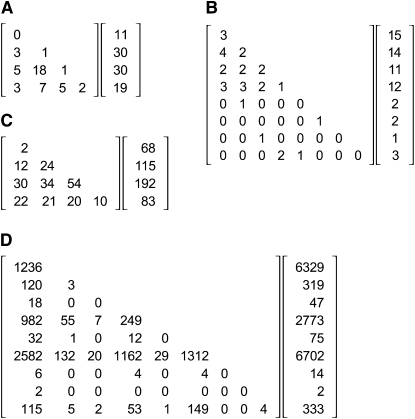
Figure 1.—
Sample data sets: examples that have been used in previous discussions of exact tests for HW proportions. For each data set, a triangular matrix of genotype counts is shown next to the vector of allele counts. (A) From Table 2, bottom row, of Louis and Dempster (1987). (B) From Figure 2 of Guo and Thompson (1992). (C) From the documentation included with the GENEPOP software package (Rousset 2008). (D) From Figure 5 of Guo and Thompson (1992).

