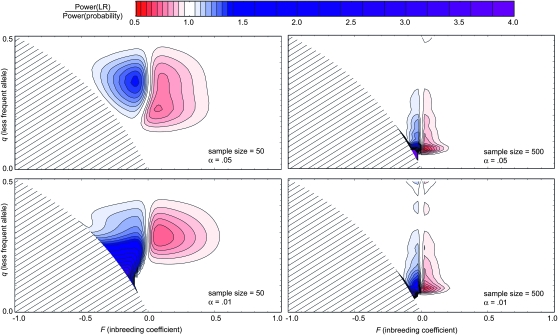
Figure 3.—
Power comparisons. Contour plots of the ratio of the power of the exact likelihood-ratio test (numerator) and the probability test (denominator) for the case of two alleles. Sample sizes and α-levels are as shown. Each plot was constructed from a grid of 2687 points distributed uniformly throughout the parameter space of allele frequency and inbreeding coefficient. For each such point, the power was determined by generating all possible multinomial samples and summing the probabilities of those whose P-value is less than or equal to α. Mathematica (Wolfram Research) was used to draw contour curves from the computed power ratios. File S2 contains similar contour plots covering more sample sizes.

