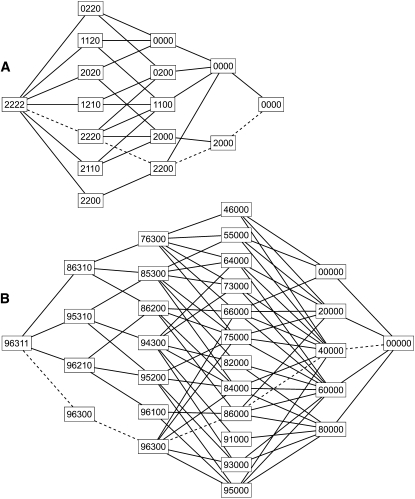
Figure 4.—
Network diagrams. The tables with a given set of allele counts can be represented by the paths through a network of nodes connected by arcs. Each path begins with the leftmost node and proceeds rightward. Each node is labeled with a string of digits indicating the residual allele counts at that point. (A) Network for the case of two copies of each of four alleles. There are 17 paths from (2222) to (0000). The dashed line represents the sample in which each homozygote is observed once. (B) Network showing the 139 paths for the case of  . The dashed lines specify the table that is indicated by the intersection of dashed lines in Figure 2.

