

Abstract
Escherichia coli LpxB, an inverting glycosyl transferase of the GT-B superfamily and a member of CAZy database family 19, catalyzes the fifth step of lipid A biosynthesis: UDP-2,3-diacylglucosamine + 2,3-diacylglucosamine-1-phosphate → 2′,3′-diacylglucosamine-(β,1′-6)-2,3-diacylglucosamine-1-phosphate + UDP. LpxB is a target for the development of new antibiotics, but no member of family 19, which consists entirely of LpxB orthologs, has been characterized mechanistically or structurally. Here, we have purified E. coli and Haemophilus influenzae LpxB to near-homogeneity on a 10–100 mg scale using protease-cleavable His10-tagged constructs. E. coli LpxB activity is dependent upon the bulk surface concentration of its substrates in a mixed micelle assay system, suggesting that catalysis occurs at the membrane interface. E. coli LpxB (Mr ~ 43 kDa) sediments with membranes at low salt concentrations but is largely solubilized with buffers of high ionic strength. It purifies with 1.6 to 3.5 moles of phospholipid per mole of LpxB polypeptide. Transmission electron microscopy reveals the accumulation of aberrant intra-cellular membranes when LpxB is over-expressed. Mutagenesis of LpxB identified two conserved residues, D89A and R201A, for which no residual catalytic activity was detected. Our results provide a rational starting-point for structural studies.
Gram-negative bacteria possess an asymmetric outer membrane in which the inner leaflet is composed primarily of glycerophospholipids while the outer leaflet contains mostly lipopolysaccharide (LPS) (1–3). LPS forms a structural barrier that protects Gram-negative bacteria from antibiotics and other environmental stressors (2). The lipid A anchor of LPS is a glucosamine-based saccharolipid that is further glycosylated with core and O-antigen sugars (1–4). Lipid A biosynthesis is required for viability in most species of Gram-negative bacteria (3). The minimum structure required for growth is usually lipid A derivatized with two Kdo (3-deoxy-D-manno-oct-2-ulosonic acid) residues (3, 5). In addition to serving a structural role as the hydrophobic anchor of LPS, lipid A is recognized as foreign by receptors of the innate immune system (6–8). In macrophages, lipid A stimulates the TLR4 (toll like receptor 4)/MD2 complex, which in turn activates a signal transduction cascade for the production of cytokines and other mediators of inflammation (8–11). In endothelial cells, lipid A also stimulates tissue factor production (12, 13). The over-production of these pro-inflammatory molecules can damage the microvasculature, contributing to Gram-negative septic shock and organ failure (14). Synthetic Escherichia coli lipid A by itself potently activates TLR4/MD2 and mimics many features of Gram-negative sepsis when injected into animals (15). Given lipid A’s importance for bacterial viability and pathogenesis, the enzymes of its biosynthetic pathway are promising targets for the design of new antibiotics (3, 16, 17).
The biosynthesis of E. coli lipid A is catalyzed by nine constitutive enzymes, which are conserved in most Gram-negative bacteria (1, 3) (Scheme 1). The genes encoding these enzymes are usually present in single copy. The first three enzymes, LpxA, LpxC and LpxD (Scheme 1), convert UDP-GlcNAc to UDP-2,3-diacylglucosamine (UDP-2,3,-diacyl-GlcN), whereupon LpxH (18, 19) cleaves off the UMP moiety to generate 2,3-diacylglucosamine-1-phosphate (2,3-diacyl-GlcN-1-P), also termed lipid X (20). Next, LpxB, an inverting glycosyl transferase (21, 22), condenses another molecule of UDP-2-3-diacyl-GlcN with 2,3-diacyl-GlcN-1-P to form 2′,3′-diacylglucosamine-(β,1′-6)-2,3-diacylglucosamine-1-phosphate (DSMP) and UDP (Scheme 1). Four additional enzymes convert DSMP to Kdo2-lipid A (Scheme 1) (1, 3).
Scheme 1. Role of LpxB in E. coli lipid A biosynthesis.

The constitutive enzymes of lipid A biosynthesis are shown in cyan, except for LpxB, which is highlighted in red. The glucosamine ring numbering is shown in red.
The characterization of LpxB affords an opportunity to gain new insights into the biochemistry of glycosyl transferases, which comprise 1–2% of the biomass of all life forms (23). LpxB is a member of the GT-B super-family, which encompasses a diverse subset of enzymes (23). There are currently ~90 CAZy families in the GT-B super-family (http://www.cazy.org/), of which one, family 19, consists exclusively of LpxB orthologs (23). However, no LpxB structures have been determined.
Here, we report the over-expression and purification of E. coli and Haemophilus influenzae LpxB to near-homogeneity on a 10–100 mg scale. We also describe an improved LpxB assay and characterize E. coli LpxB’s peripheral association with the cytoplasmic membrane. We demonstrate by mass spectrometry and autoradiography that 1.6 to 3.5 phospholipid molecules co-purify with each LpxB monomer, and we identify conserved residues required for LpxB activity. Our findings set the stage for mechanistic studies and x-ray crystallography of LpxB.
Materials and Methods
Molecular biology protocols
Plasmids described in this study (Table 1) were amplified in E. coli strain XL1-Blue (Stratagene, La Jolla, CA) and purified using Qiagen Mini-Prep kits (Qiagen, Valencia, CA). DNA fragments were purified using Quiaquick Spin kits (Qiagen, Valencia, CA). Both kits were employed according to the manufacturer’s recommendations. Restriction endonucleases, T4 DNA ligase, and calf intestinal alkaline phosphatase were obtained from New England Biolabs (Ipswich, MA). Pfu Turbo DNA polymerase, the 100 mM dNTP stocks (20 mM each of dATP, dTTP, dGTP and dCTP), and Pfu Turbo polymerase reaction buffer were obtained from Strategene (La Jolla, CA). Polymerase chain reaction (PCR) conditions were those recommended by Strategene, except for inclusion of 1% v/v dimethyl sulfoxide.
Table 1.
Bacterial strains and plasmids.
| Strain/plasmid | Description | Source of reference |
|---|---|---|
| Strains | ||
| C41(DE3) | F ompT hsdSB (rB−mB−) gal dcm (DE3) D (srl-recA)306::Tn10 | Ref. Miroux paper |
| W3110 | wild-type, F−, λ− | E. coli Genetic |
| XL1-Blue | recA1 endA1 gyrA96 thl-1 hsdR17 supE44 relA1 lac [F’proAB laclqZDM15 Tn10 (TefA)) | Stock Center (Yale) Stratagene |
| MN7 | K-12-derived pgsA444 lpxB1; accumulates lipid X | Ref. 44 in LpxL paper |
| Plasmids | ||
| pET21a(+) | expression vector containing a T7 promoter, AmpA | Novagen |
| pWSK29 | low-copy expression vector containing a T7 promoter, AmpA | Ref. 33 in LpxL paper |
| pET23b | expression vector containing a T7 promoter, AmpA, conters a non-cleavable C-terminal (His)6 tag | Novagan |
| pET30b | expression vector containing a T7 promoter, KanA, conters an enterokinase-cleavable C-terminal (His)B tag | Novagen |
| pET19b | expression vector containing a T7 promoter, AmpA, conters an enterokinase-cleavable N-terminal (His)10 tag | Novagen |
| pET16b | expression vector containing a T7 promoter, AmpA, conters a factor Xa-cleavable N-terminal (His)10 tag | Novagen |
| pECLpxB21 | pET21a(+) containing E. coli lpxB | this work |
| pECLpxBwsk29 | pWSK29 containing E. coli lpxB | this work |
| pECLpxB23 | pET23b containing E. coli lpxB | this work |
| pECLpxB30 | pET30b containing E. coli lpxB | this work |
| pECLpxB19 | pET19b containing E. coli lpxB | this work |
| pECLpxB16 | pET16b containing E. coli lpxB | this work |
| pHILpxB16 | pET16b containing H. Influenzae lpxB | this work |
| pECLpxB-TEV | pET16b containing E. coli lpxB wherein the factor Xa cleavage site is replaced by a TEV-protease site | this work |
| pHILpxB-TEV | pET16b containing H. Influenzae lpxB wherein the factor Xa cleavage site is replaced by a TEV-protease site | this work |
| pE15A | pET19b containing E. coli lpxB-E15A | this work |
| pS17A | pET19b containing E. coli lpxB-S17A | this work |
| pD98A | pET19b containing E. coli lpxB-D98A | this work |
| pF102A | pET19b containing E. coli lpxB-F102A | this work |
| pW126A | pET19b containing E. coli lpxB-W126A | this work |
| pR210A | pET19b containing E. coli lpxB-R210A | this work |
| pE227A | pET19b containing E. coli lpxB-E227A | this work |
| pL314A | pET19b containing E. coli lpxB-L314A | this work |
| pN316A | pET19b containing E. coli lpxB-N316A | this work |
Cloning of E. coli and H. influenzae lpxB genes
DNA oligomers (Erofins MWG Operon Huntsville, AL) were used to amplify lpxB genes from E. coli and H. influenzae genomic DNA (obtained from ATCC, Rockville, MD). The sequences of these primers are shown in Supporting Table 1. For the E. coli gene, primers were designed to confer 5′ ndeI or hindIII restriction sites, and 3′ xhoI or kpnI restriction sites. For H. influenzae lpxB, primers conferred 5′ ndeI and 3′ xhoI sites. Amplification from genomic DNA by PCR was accomplished using a Mastercycler Gradient thermocycler (Eppendorf, Hamburg, Germany). Amplified inserts were digested by the appropriate restriction endonuclease and ligated into similarly digested vectors (EMD Chemicals, Inc., Darmstadt, Germany) (Table 1) that had been treated with calf intestinal alkaline phosphatase. Ligation was performed using T4 ligase. E. coli lpxB was cloned into pET21a(+) and pET23b at 5′ hindIII and 3′ xhoI restriction sites, into pET30b at 5′ ndeI and 3′ kpnI sites, and into pET19b and pET16b at 5′ ndeI and 3′ xhoI sites (Table 1), using the designated primers shown in Supporting Table 1. H. influenzae lpxB was cloned into pET16b at 5′ ndeI and 3′ xhoI sites. For pECLpxB23 and pECLpxB30 (Table 1), the lpxB stop codons were removed to allow fusion to the C-terminal tag, using the primers EC_xhoI and EC_kpnI, as summarized in Supporting Table 1. The restriction endonucleases xbaI and xhoI were employed to sub-clone E. coli lpxB from pET21a into the low-copy plasmid pWSK29 (24). The use of these restriction endonucleases allowed for the transfer of the 5′ ribosome-binding site of pET21a together with E. coli lpxB. The vectors pET23b, pET30b, pET19b, pET16b confer a C-terminal non-cleavable His6 tag, a C-terminal factor Xa-cleavable His8 tag, a N-terminal enterokinase-cleavable His10 tag, or a N-terminal factor Xa-cleavable His10 tag, respectively (Table 1). Ligation was followed by heat-shock enhanced transformation into competent E. coli XL1-Blue cells (Novagen, EMD Chemicals, Inc., Darmstadt, Germany). The pET16b constructs expressing E. coli or H. influenzae LpxB were further altered to convert the factor Xa cleavage site into a tobacco etch virus (TEV) protease cleavage site with the sequence ENLYFSQS (25), using the Quick-Change mutagenesis kit (Stratagene, La Jolla, CA) with appropriate primers (Supporting Table 1). All constructs were confirmed by DNA sequencing.
Optimization of the in vitro assay for LpxB
The radiochemical LpxB assay described previously (22) was optimized and adapted to a thin-layer chromatography (TLC) system. The non-radioactive LpxB substrates lipid X and UDP-2,3-diacylglucosamine were prepared as described (22). The 32P-lipid X was prepared from E. coli mutant strain MN7 (Table 1) (22, 26). Unless otherwise indicated, the purified 32P-lipid X was re-suspended in a buffer containing 0.05% w/v Triton X-100, 1 mM EDTA, and 1 mM EGTA. The addition of detergent resulted in improved recovery of 32P-lipid X when stored in polypropylene tubes. Before use, 5 mM stocks of the two non-radioactive substrates (re-suspended in 20 mM HEPES pH 8.0) were mixed by vortexing, followed by immersion in a bath sonicator (Avanti Polar Lipids, Alabaster, AL) for 2 min. Typically, 25 μl reactions were prepared in 0.5 ml polypropylene tubes (Eppendorf, Hamburg, Germany), containing 0 – 1 % w/v fatty-acid free bovine serum albumin (BSA) (Sigma-Aldrich, St. Louis, MO), 0 – 2 % w/v Triton X-100 (Pierce), 400 μM lipid X, 600 μM UDP-2,3-diacylglucosamine, 20 mM HEPES pH 8.0, ~1000 cpm/μl 32P lipid X, and enzyme. Prior to enzyme addition, these components were equilibrated in a laboratory heat block for 10 min at 30°C. Reactions were usually initiated by the addition of 5 μl of enzyme to 20 μl of the reaction mixture. At various time-points, 3 μl portions were removed and spotted onto 10 × 20 cm silica gel TLC plates (250 μm) (EMD Chemicals, Inc., Darmstadt, Germany). TLC plates were air-dried at room temperature and developed in a system consisting of CHCl3/MeOH/H2O/acetic acid (25:15:4:2 v/v/v/v). When the solvent front reached ~0.5 cm from the top edge, the plates were dried with a hot air stream, and exposed to 35 × 43 cm Molecular Dynamics PhosphorImager Screens (GE Healthcare, Waukesha, WI). After > 5 hr exposure, these screens were scanned and quantified using a Molecular Dynamics Storm 840 PhosphorImager (GE Healthcare, Waukesha, WI) and its associated software.
In the absence of either Triton X-100 or BSA, the LpxB reactions reached ~60% completion and were linear with time for about the first 10% of the progress curve. The inclusion of Triton X-100 stimulated the initial rate ~5-fold and allowed the reactions to proceed to > 90% completion. The inclusion of BSA further improved assay linearity and reproducibility. Triton X-100 and BSA were therefore included in the standard assay and in the enzyme dilution buffer. The optimized LpxB assay contained 400 μM lipid X, 600 μM UDP-diacylglucosamine, 20 mM HEPES, pH 8.0, 0.05 % w/v Triton X-100, and 0.5 mg/ml fatty-acid free BSA.
Large-scale purification of E. coli and H. influenzae LpxB constructs
All procedures were carried out a 0–4°C. For either the pECLpxB-TEV or the pHILpxB-TEV plasmid (Table 1) expressed in C41(DE3) (also see Supporting Methods: optimized expression of E. coli and H. influenzae LpxB), ~15 g of wet cell pellet were suspended in 225 ml lysis buffer, consisting of 50 mM sodium phosphate buffer, pH 8.0, 250 mM NaCl, 25 mM imidazole, 10 mM β-mercaptoethanol, and 20% v/v glycerol. The mixture was filtered through a Buchner funnel into an ice-chilled Erlenmeyer flask to remove large clumps of cells. The cells were lysed by three passages through an ice-cold Cell-Cracker™ (Microfluidics International Corporation, Newton, MA). Cell debris and membranes were removed by ultracentrifugation at 100,000 x g for 1 h. Either 10% w/v Triton X-100 or 10% w/v β-D-dodecylmaltopyranoside (DDM) (Anatrace, Inc., Maumee, OH) were added to the supernatant to yield final concentrations of 0.2 % w/v or 0.1 % w/v, respectively, as indicated below. After mixing with gentle inversion for 30 min at 4 °C, the sample was loaded overnight onto a 5 ml Ni-NTA Superflow ™ cartridge at a flow rate of 0.25 ml/min, (Qiagen, Valencia, CA). The cartridge was first pre-equilibrated in lysis buffer containing the same detergent concentration as the sample. The flow rate was maintained with a Rabbit-plus peristaltic pump (Rainin Instrument, LLC, Oakland, CA). The column was washed with 10 bed volumes of lysis buffer containing the appropriate concentration of detergent. Excess detergent and contaminants were removed by washing at 0.25 ml/min with 50 column volumes (250 ml) of lysis buffer without detergent. Twenty column volumes (100 ml) of the same buffer, except containing 50 mM imidazole, were then applied as a wash step at 0.5 ml/min. Elution of LpxB was accomplished with 16 column volumes (80 ml) of the same buffer supplemented with imidazole at 300 mM at 0.5 ml/min. To the entire Ni-NTA eluate, 1 M DTT and 0.5 M EDTA, pH 7.5, were added immediately to yield final concentrations of 5 mM and 10 mM, respectively. Next, 10 ml of 0.5 mg/ml C-terminally His6-tagged TEV protease was added (25, 27) and thoroughly mixed with the LpxB by gentle pipetting. After 14 hours at 4 °C, the sample was dialyzed at 4 °C against 4 L of 20 mM HEPES pH 8.0, containing 200 mM NaCl, 10% glycerol v/v, and 10 mM β-mercaptoethanol. Following at least 8 h of dialysis, the TEV-digested LpxB was applied at 0.5 ml/min to 7 ml of Ni-NTA Superflow™ resin in a 3.7 cm diameter glass column (Bio-Rad) equilibrated in dialysis buffer. The run-through (~100 ml) was collected and concentrated on a 10,000 molecular weight cut-off YM10 membrane (Millipore, Billercia, MA) under nitrogen pressure in a 50 ml stirred ultra-filtration cell (model 8050, Millipore, Billercia, MA) until the final volume was 5–9 ml.
The sample was next passed through a 0.2 μm filter (Millipore, Billercia, MA) and loaded onto a 320 ml calibrated size exclusion column (Superdex 200 XK26/70, GE Healthcare, Waukesha, WI), equilibrated with a buffer containing 20 mM HEPES, pH 8.0, 150 mM NaCl (for E. coli LpxB) or 500 mM NaCl (for H. influenzae LpxB), and 5 mM tris-(2-carboxyethyl)-phosphine (TCEP). In some preparations, the buffer also contained 0.05% w/v DDM, as indicated. The sample was applied at 0.5 ml/min using an AKTA FPLC system equipped with the UNICORN program (GE Healthcare, Waukesha, WI). Elution with 1.1 column volumes (~350 ml) was at 1 ml/min, and 5 ml fractions were collected after the excluded volume (110 ml) of the column was reached. Fractions containing LpxB, as judged by A280 and SDS-PAGE, were pooled and concentrated to 10–20 mg/ml using Amicon Ultra 10,000 molecular weight cut-off centrifugal concentration devices (Millipore, Billercia, MA). Concentrated LpxB was divided into aliquots, flash-frozen using dry ice in ethanol, and stored at −80 °C. Protein concentration was determined by the bicinchoninic acid assay (28). The concentration of NaCl in the H. influenzae LpxB size-exclusion chromatography buffer was maintained at 500 mM, because the purified enzyme, when concentrated to > 5 mg/ml, precipitated at lower ionic strength. The protein’s apparent molecular mass (Mr) was estimated by fitting the observed elution volume to a set of standards (thyroglobulin, ferritin, aldolase, E. coli LpxD, serum albumin, conalbumin, ovalbumin, chymotripsin, and ribonuclease A). Except for lpxD (29), standards were obtained from GE Healthcare, Waukesha, WI.
Size exclusion chromatography of E. coli LpxB in the presence or absence of detergent
A 500 μl sample of purified E. coli LpxB (5 mg/ml) was loaded onto a 24 ml Superdex 200 Preparative grade column (GE Healthcare, Waukesha, WI), attached to an AKTA FPLC system, and eluted at a flow rate of 0.33 ml/min in buffer containing 20 mM Tris, pH 7.4, 200 mM NaCl, and 5% w/v glycerol. Elution was followed by A280 and SDS-PAGE analysis of 0.5 ml fractions. To determine whether detergent affects the estimated Mr, another size exclusion experiment was performed as above, except that 0.1% w/v DDM was included in the buffer.
Apparent kinetic parameters and pH dependency of E. coli LpxB
Velocity as a function of lipid X concentration was determined for purified E. coli LpxB using the optimized assay conditions, except that UDP-2,3-diacylglucosamine was held constant at 1200 μM, and lipid X was varied from 50 to 1000 μM. The velocities were fit to the Michaelis-Menten equation using KaleidaGraph (29). The apparent kinetic parameters with respect to UDP-2,3-diacylglucosamine concentration were determined as above, except that lipid X was held at 1200 μM, while UDP-2,3-diacylglucosamine was varied from 50 to 1000 μM. Typically, 5 nM enzyme was used to start the reaction, and time-points were taken at 3, 15, and 30 min.
To determine the pH dependence, LpxB was assayed in a triple-buffer system, consisting of 100 mM sodium acetate, 50 mM bis(2-hydroxymethyl)-imino-tris(hydroxymethly)-hexane, and 50 mM Tris, ranging in pH from 5.5 to 9.5 (30). Standard assay conditions with 5 nM enzyme were used, except that the usual 20 mM HEPES, pH 8.0, was replaced with the triple buffer. Product formation was determined at 15 and 30 min, and experiments were carried out in duplicate. KaleidaGraph was used to fit a two-limb pKa curve to the data (30).
Effect of detergent and surface concentration upon apparent LpxB activity
Purified E. coli LpxB was assayed under standard conditions (400 μM lipid X, 600 μM UDP-2,3-diacylglucosamine), except that the Triton X-100 was varied from 10 μM to 1 mM. To avoid detergent carry-over into the reactions, the purified enzyme was diluted as above, but in the absence of Triton X-100. The final LpxB concentration was 10 nM. For the same reason, 32P-lipid X used in this experiment was re-suspended in a buffer containing EDTA and EGTA, but lacking detergent.
To investigate the effects of bulk surface concentration ([lipid X] + [UDP-2,3-diacylglucosamine] + [Triton X-100]) on specific activity, the purified enzyme was assayed under standard assay conditions, except that the mole ratio of lipid X:UDP-2,3-diacylglucosamine:Triton X-100 was held constant at 2:3:4, and the bulk concentration was varied from 0.028 mM to 1.8 mM. The enzyme used in this experiment was diluted in 20 mM HEPES, pH 8.0, and 0.5 mg/ml BSA but without Triton.
To determine whether LpxB activity is affected by surface dilution (31), the purified enzyme was assayed in the presence of a fixed substrate concentrations (50 μM lipid X and 75 μM UDP-2,3-diacylglucosamine), while Triton X-100 was varied from 0.1 to 13.6 mM to reach a 100-fold excess in relation to the combined substrate concentrations.
Construction, purification, and characterization of E. coli LpxB point mutants
The plasmid pECLpxB19 (Table 1) was mutagenized using a Quick-Change kit (Stratagene, La Jolla, CA) with appropriate primers (Supporting Table 1). Mutagenized plasmids were amplified, purified, and confirmed by DNA sequencing. The plasmids were transformed into the C41(DE3) expression strain. The resultant constructs were inoculated into in LB broth (32) supplemented with 100 μg/ml ampicillin, induced at A600 of ~0.5 with 1 mM IPTG for 3 hours, and harvested as described in the Supporting Materials. Expression was confirmed by SDS-PAGE of cell lysates. Mutant LpxB enzymes were purified on a small scale in a manner analogous to that described above (see Supporting Methods), except that the membrane-free lysate was supplemented with DDM to 0.5% w/v, and the Ni-NTA eluant was exchanged into 20 mM HEPES, pH 8.0, 150 mM NaCl, 20% w/v glycerol, and 0.2% w/v DDM using a PD-10 solvent exchange column (GE Healthcare, Waukesha, WI). Purified mutant proteins were analyzed by SDS-PAGE and by the standard in vitro LpxB assay. Concentrations of each mutant enzyme were varied from ~1.3 μM to 13 nM as appropriate.
Extraction of phospholipids purifying with E. coli LpxB
Cells of C41(DE3)/pECLpxB19 (Table 1) were grown in a 750 ml culture, induced, and harvested as described in the Supporting Methods. Purification was accomplished as described in Supporting Methods, except that the lysate from the 750 ml culture was divided into four portions: one was not incubated with detergent prior to purification, while the other three were incubated at 4 °C for 30 minutes with either Triton X-100, octyl-β-D-glucopyranoside, or DDM, each of which was added to a final concentration of 1% w/v from 20% w/v stocks. Eluted protein (~0.5 mg/ml) obtained by Ni-NTA chromatography was estimated to be > 95% pure by SDS-PAGE. A 0.8 ml portion (0.4 mg) of each of the four purified protein samples was extracted with a 5.8 ml acidic two-phase Bligh-Dyer mixture (33). The lower phase (2 ml), containing phospholipids, was removed and transferred to a fresh glass tube. The lower phase was washed three times with 3.8 ml portions of pre-equilibrated acidic Bligh-Dyer upper phase (33). The washed lower phase was dried under N2, redissolved in 100 μl chloroform/methanol (2:1 v/v), and injected onto a QSTAR XL time-of-flight mass spectrometer (Applied Biosystems, Foster City, CA) operating in the ESI negative ion mode. A spectrum was collected in the m/z range of 60 to 2000 amu, with intensity counts accumulated over one minute.
Estimation of the phospholipid to LpxB ratio by quantitative LC/ESI-MS
A 2.3 μg sample of a synthetic phosphatidylethanolamine (PE) standard, consisting of 17:0, 14:1 PE (Avanti Polar Lipids, Alabaster, AL), was added to 0.4 mg of purified LpxB; this mixture was extracted by the acidic Bligh-Dyer method (33, 34). The lower phase was dried under N2 and redissolved in 100 μl of chloroform/methanol (2:1 v/v). Next, 20 μl of this material was mixed with 20 μl DMSO and 50 μl of liquid chromatography mobile phase A, consisting of methanol:acetonitrile:aqueous 1 mM ammonium acetate (60:20:20, v/v/v). A 20 μl portion of this mixture was injected onto a Zorbax SB-C8 reverse-phase column (5 μm, 2.1 × 50 mm) obtained from Agilent (Palo Alto, CA), using a Shimadzu LC system composed of a solvent de-gasser, two LC-10A pumps, and a SLC-10A system controller (Shimadzu Scientific Instruments, Kyoto, Japan) coupled to a QSTAR XL quadropole time-of-flight mass spectrometer (Applied Biosystems, Foster City, CA). For chromatography, 100% mobile phase A was run isocratically for 2 minutes, followed by a by a linear gradient from 100% mobile phase A to 100% mobile phase B (100% ethanol containing 1 mM ammonium acetate) over 14 minutes. The flow rate was maintained at 200 μl/min. About 10% of the column eluant was directed to the QSTAR XL for ESI-MS analysis in the negative-ion mode (35). The total ion current (TIC) and the derived mass-spectra were analyzed using the Analyst QS software package. Most of the PE species eluted from the C8 column between 8 and 13 minutes. The synthetic 17:0, 14:1 PE standard eluted at 10.59 minutes.
The quantification module of the Analyst software package was used to integrate the area of the extracted ion current (EIC) peak of the synthetic PE and the major endogenous PE species. First, the EIC area corresponding to the PE standard was calculated. Next, the EICs of the three most abundant PE species were integrated. These species were PE(34:1) (at m/z 716.51 amu), PE(32:1) (at m/z 688.48 amu), and the cyclopropane derivative PE(33:0) (at m/z 702.50 amu). To estimate the amount of each endogenous PE species, we calculated the ratio of that species’ EIC peak area to the internal standard’s EIC peak area. This ratio was then multiplied by the number of moles of internal standard that had been extracted together with the LpxB protein sample, and these values were summed. Given the moles of LpxB extracted, and assuming that the three major PE species accounted for about 50% of the total PE (36), and that PE comprised ~70% of the total phospholipids purifying with the LpxB (see below), we estimated the approximate molar ratio of non-covalently bound phospholipids to purified LpxB.
Estimation of the phospholipid to LpxB ratio by 32P labeling of cells
Cultures (50 ml) of C41(DE3)/pECLpxB19 expressing E. coli LpxB or the C41(DE3)/pET19b vector control (Table 1) were grown in LB broth containing 100 μg/ml ampicillin at 37 °C in rotary shaker at 200 rpm. At A600 of ~0.5 (mid-log phase), the cultures were induced with 1 mM IPTG. One set of vector-control and LpxB-expressing cultures was labeled with 32Pi (Perkin-Elmer, Inc., Waltham, MA) at 10 μCi/ml, while another set was grown without labeling. The cells were harvested after 3 hours, and the pellets were washed with PBS, and divided into two equal portions (each corresponding to 25 ml of culture). One set of pellets from each of the radio-labeled strains (vector-control and LpxB-over-expressing) was extracted in a 5.8 ml acidic two-phase Bligh-Dyer system (33, 34). The quantity of total lipid 32P in the washed lower phase of each sample was quantified by liquid scintillation counting (Packard, Inc., Prospect, CT). Approximately 15,000 cpm of each sample were spotted onto a silica TLC plate. The plates were quickly placed (prior to complete drying of the spots) into a tank equilibrated with chloroform/methanol/acetic acid (65/25/10, v/v/v). The developed plates were dried, exposed to PhosphorImager screens, and quantified. Phospholipids were identified by their Rf values.
Cells from the second set of radio-labeled pellets and a corresponding set of unlabeled pellets were lysed by sonic disruption (37) in 25 ml 50 mM sodium phosphate, pH 8.0, and 300 mM NaCl. Cell debris and membranes were removed by ultracentrifugation for 1 h at 100,000 × g. LpxB from these membrane-free lysates was purified by Ni-NTA chromatography, as described in the Supporting Methods, except that sonic irradiation was used to accomplish cell lysis. Phospholipids that co-purified with LpxB were extracted with an acidic Bligh-Dyer system (33, 34), separated and quantified as described above. The LpxB purified from the non-radiolabeled cell pellets was assayed under standard conditions and analyzed by SDS-PAGE to confirm over-expression and purity. The purified enzyme was fully active and greater than > 95% pure. The molar ratios of the 32P phospholipids to the purified LpxB samples from which they were extracted were estimated as follows: the assumption that ~10 μg of phospholipids can be extracted per A600 unit/ml of E. coli culture (38); the measured amount of LpxB protein purified from the 25 ml of culture; and the assumption that the average molecular weight of E. coli phospholipids is ~720 g/mol.
Transmission electron microscopy of E. coli cells over-expressing LpxB
The vector-control C41(DE3)pET19b and the LpxB-over-expressing C41(DE3)/pECLpxB19 were grown in LB broth at 37 °C to mid-log phase (A600 of ~0.5) and induced with 1 mM IPTG for three h. The cells were harvested by centrifugation at ~2500 × g and fixed with 2.5 % w/v glutaraldehyde and 1% w/v tannic acid. Cells were stained with osmium tetroxide, uranyl acetate, and lead acetate (39). Sectioning and transmission electron microscopy were conducted at the University of North Carolina: Chapel Hill, Department of Cell Biology and Physiology Electron Microscopy Facility.
Results
Cloning and expression of E. coli and H. influenzae LpxB
The lpxB genes of E. coli and H. influenzae were cloned into several vectors, including some that introduced N-terminal or C-terminal His tags (Table 1). Expression in E. coli C41(DE3) (40) was monitored by SDS-PAGE and LpxB assay. Maximal over-expression was obtained with high-copy pET plasmids encoding LpxB fused to a C-terminal His6 tag via a short, non-cleavable linker, or with a N-terminal His10 tag connected by an 8–12 residue protease-cleavable segment. Lysates of the best constructs over-expressed LpxB activity 20–40,000-fold relative to vector controls (Table 2 and Supporting Tables 2 and 3). Similar constructs were used to over-express H. influenzae LpxB. Membrane-free lysates of the best H. influenzae constructs had specific activities that were 10-fold lower than those of the corresponding E. coli lysates (Table 2 and Supporting Table 3) because of lower protein expression (Figure 1). Extracts of the various E. coli constructs (Table 1) with cleavable N-terminal His10 tags generally had specific activities that were within a factor of two each other, as did the corresponding Ni-NTA purified proteins (Supporting Table 2).
Table 2.
Purification of E. coli LpxB from C41(DE3)/pECLpxB-TEV.
| Step | Total Protein (mg) | Total Volume (ml) | Total Units (mmol/min) | Specific activity (μmol/min/mg) | Yield (%) | Fold-purification |
|---|---|---|---|---|---|---|
| Membrane-free lysate | 930 | 225 | 42 | 45 | 100 | 1.0 |
| Ni-NTA column fractions | 110 | 90 | 19 | 173 | 44 | 3.9 |
| TEV-digested Ni-NTA flow-through | 100 | 100 | 17 | 170 | 39 | 3.6 |
| Size exclusion chromatography | 52 | 25 | 9.5 | 183 | 23 | 4.0 |
Figure 1. Purification of E. coli and H. influenzae LpxB to near-homogeneity.

These 12% SDS-Tris-polyacrylamide gels show 30 μg protein samples from each step of the optimized purifications of N-terminally His10-tagged and TEV-protease cleavable E. coli (Panel A) and H. influenzae (Panel B) LpxB. The far left lanes are the molecular weight standards. Lane 1, membrane-free lysates; lane 2, the Ni-NTA column 300 mM imidazole fraction; lane 3, the TEV-protease digested protein after passage through a second Ni-NTA column; lane 4, the final material after purification by size-exclusion chromatography. MW denotes the molecular weights of the proteins standards. The molecular weights of the tagged and cleaved E. coli LpxB constructs are 45.9 kDa and 42.7 kDa, respectively, while those of the tagged and cleaved H. influenzae LpxB constructs are 46.1 kDa and 43.9 kDa. The activity yields for these E. coli and H. influenzae LpxB preparations are shown in Table 2 and Supporting Table 3 respectively.
An optimized autoradiographic assay for LpxB
A new autoradiographic assay, employing quantitative PhosphorImager analysis, was developed to monitor the LpxB activity based on the conversion of 32P-lipid X and UDP-2,3-diacyl-GlcN to 32P-DSMP (Scheme 1 and Figure 2A). The linearity and yield of product formation were improved compared to the previous assay (22) by inclusion of 0.05% w/v Triton X-100 and 0.5 mg/ml BSA in both the reaction mixture and the enzyme dilution buffer. The initial velocity was increased about 5-fold. Inclusion of 2 mM EDTA or EGTA, 2 mM DTT, or total 70 μg/ml total E. coli phospholipids had no effect under these conditions. The optimized system displayed linear product formation with time (Figure 2B) and protein concentration (Figure 2C).
Figure 2. An optimized quantitative in vitro assay for LpxB activity.
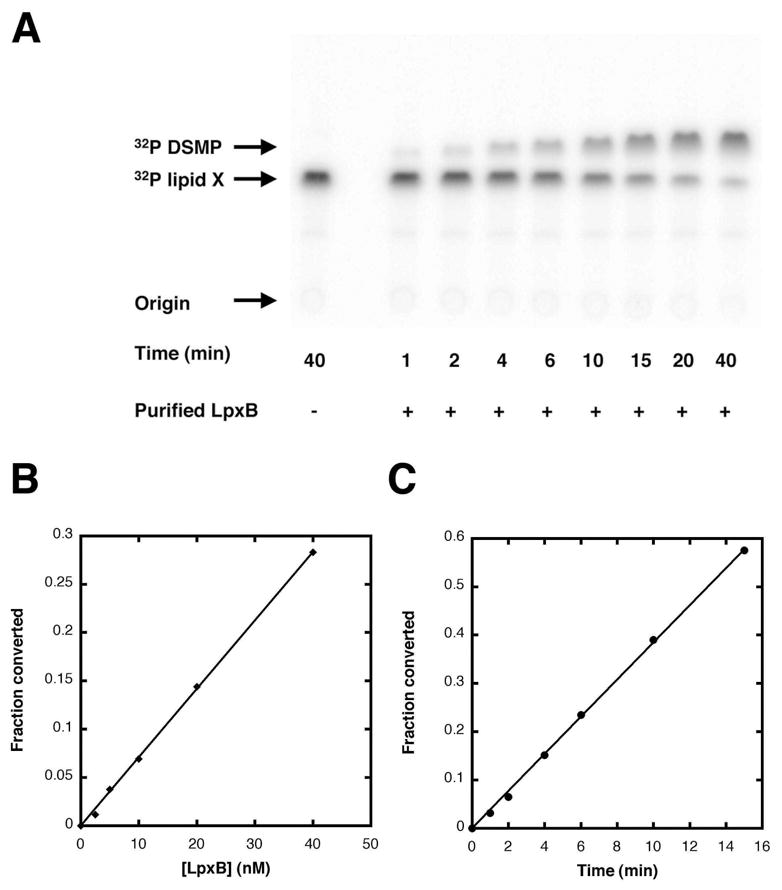
Reaction mixtures at 30 °C contained 400 μM lipid X, 1000 cpm/μl 32P-lipid X, 600 μM UDP-2,3-diacylglucosamine, 20 mM HEPES, pH 8.0, 0.5 mg/ml BSA, 0.05% w/v Triton X-100 and enzyme, as indicated in a final volume of 25 μL. At various times 3 μl portions were spotted onto a Silica Gel 60 plate and developed in chloroform/methanol/water/acetic acid (25/15/4/2, v/v/v/v). The plates were subsequently dried, and radioactivity was quantified using a PhosphorImager. Panel A. Image of a typical time course with LpxB purified from C41(DE3)/pECLpxB19 at 20 nM. Panel B. LpxB activity is linear with protein concentration, which was varied from 2.5 to 40 nM. Reactions were stopped after 3 min. Panel C. LpxB product formation is linear with time.
Peripheral association of E. coli LpxB with membranes
We previously observed that ~2/3 of E. coli LpxB activity sediments with E. coli membranes prepared from wild-type strains that had been lysed in low-salt buffers (22). To explore this issue in more detail, E. coli cells expressing LpxB were lysed in PBS, and membranes were separated from the soluble fraction by ultracentrifugation. The membranes contained ~75% of the LpxB activity. Next, they were divided into three portions, which were washed with either PBS, PBS supplemented with 250 mM NaCl, or PBS supplemented with 250 mM KSCN. The membranes were again collected by ultracentrifugation. Whereas over 80% of the LpxB units remained associated with membranes washed in PBS, inclusion of 250–300 mM NaCl reduced the membrane association to 32 %, and 250 mM KSCN released most of the LpxB into the soluble fraction (data not shown). When cells over-expressing LpxB were lysed in the presence of Ni-NTA loading buffer (50 mM sodium phosphate, pH 8.0, 250 mM NaCl, 25 mM imidazole and 20% glycerol, ~2/3 of the LpxB activity was recovered in the supernatant following ultracentrifugation. The latter procedure was the simplest for recovering LpxB on a large scale.
Purification of E. coli and H. influenzae LpxB
The previous purification of E. coli LpxB (22) used dye-affinity resins that are no longer manufactured and that preceded the advent of pET vectors. Because N-terminally His10-tagged LpxBs showed stronger affinity for Ni-NTA columns than those with C-terminal His6 tags, the former were used for large-scale purification. As noted above, membrane-free lysates, prepared in the high-salt Ni-NTA resin-loading buffer, contained about two-thirds of the LpxB activity. The addition of detergents (0.1% w/v DDM in the optimized large-scale purification scheme) to the supernatant at this stage improved LpxB recovery, even when DDM was omitted in the later steps.
N-terminally His10-tagged E. coli or H. influenzae LpxB, present in the DDM-treated supernatants of E. coli C41(DE3)/pECLpxB-TEV or E. coli C41(DE3)/pHILpxB-TEV (Table 1), was purified to about 95% homogeneity, as described in the methods section, by chromatography on Ni-NTA columns (Table 2 and Supporting Table 3, and Fig. 1). This step also removed the bulk DDM and the phospholipids that are otherwise non-covalently associated with LpxB (see below). TEV-protease (25, 27) was then used to cleave the His10 tag, after which both E. coli and H. influenzae LpxB were passed through the same Ni-NTA column to remove the cleaved tag, the remaining His10-tagged LpxB, the C-terminally His6-tagged TEV-protease, and minor contaminating E. coli proteins. The cleavage of the His10 tag was detected by gel electrophoresis of the initial Ni-NTA column eluate (Fig. 1, lane 2) versus the TEV-treated LpxB after the second Ni-NTA column (Fig. 1, lane 3). The shift in LpxB migration corresponded to the loss of ~2.5 kDa upon cleavage of the tag and its linker.
Size-exclusion chromatography was employed as the final purification step. E. coli and H. influenzae LpxBs were purified 3.9 and 16-fold, from their respective membrane-free lysates (Table 2 and Supporting Table 3, and Figure 1). From a 12 L induced culture grown to A600 = 3.5, about 50 mg of E. coli LpxB was obtained with an overall activity yield of 23% (Table 2), and 15 mg of H. influenzae LpxB was obtained with a yield of 21% (Supporting Table 3). The sequences of these purified constructs were confirmed by ESI/MS of the intact proteins. For the E. coli LpxB construct, a de-convoluted molecular weight of 42741.00 was measured (expected: 42737.80). For the H. influenzae LpxB construct, a de-convoluted molecular weight of 43995.00 was measured (expected: 43992.50). Each cleaved, purified protein contains three additional amino acid residues (SHM) at its N-terminus compared to wild-type. These residues are artifacts of the TEV protease cleavage sequence and the ndeI restriction site.
Size of E. coli and H. influenzae LpxB as judged by gel filtration
When analyzed in a detergent-free buffer on a calibrated Superdex 200 column, E. coli LpxB elutes at a volume consistent with a Mr of ~360 kDA (Figure 3A), whereas H. influenzae LpxB elutes with a Mr of ~42 kDA (Figure 3B). The estimated Mrs of E. coli and H. influenzae LpxB are consistent with an octamer and a monomer, respectively. When E. coli LpxB is passed through a similar gel filtration column in the presence of 0.1% w/v DDM, the peak shifts from one consistent with an octamer to a smaller species (Figure 3C).
Figure 3. Size exclusion chromatography of E. coli and H. influenzae LpxB.

Panel A As shown by the A280 profile, pure E. coli LpxB (21 mg as prepared in Table 2) emerges as an apparent octamer on a 350 ml Superdex 200 column, run at 1.0 ml/min in 20 mM HEPES, pH 8.0, 150 mM NaCl, and 5 mM TCEP. Panel B. H. influenzae LpxB (15 mg as prepared in Supporting Table 3) emerges as an apparent monomer under chromatographic conditions identical to those used for the E. coli enzyme, except for the inclusion of 500 mM NaCl to prevent precipitation above 5 mg/ml. Panel C. E. coli LpxB is shifted from an apparent octamer (blue trace) to an apparent dimer (red trace) when 0.1% w/v DDM is included in the buffer. In this experiment, a 24 ml Superdex 200 column was run at a flow rate of 0.33 ml/min in 20 mM Tris, pH 7.4, 200 mM NaCl, 5 mM TCEP, and 5% w/v glycerol. Panel D. The 350 ml Superdex 200 sizing column used in Panels A and B was calibrated with indicated protein standards to estimate the molecular weights of the LpxB peaks.
Apparent kinetic parameters and pH rate profile for E. coli LpxB
The apparent KM for lipid X was 381 ± 23 μM, and the apparent Vmax was 271 ± 6 nmol/min/mg with UDP-2,3-diacyglucosamine held at 1200 μM (Figure 4A). The apparent KM and Vmax when varying UDP-2-3-diacylglucosamine were 287 ± 34 μM and 147 ± 7 nmol/min/mg (Figure 4B). These values are “apparent” because of the surface dilution effects inherent in mixed-micelle systems (31). To determine its pH dependency, purified E. coli LpxB was assayed in a three-buffer system over the range of pH values shown in Figure 4C (30). An apparent pKa of 5.9 ± 0.2 and a pKb of 9.0 ± 0.4 were estimated from the data.
Figure 4. Apparent kinetic parameters and pH rate profile of E. coli LpxB.
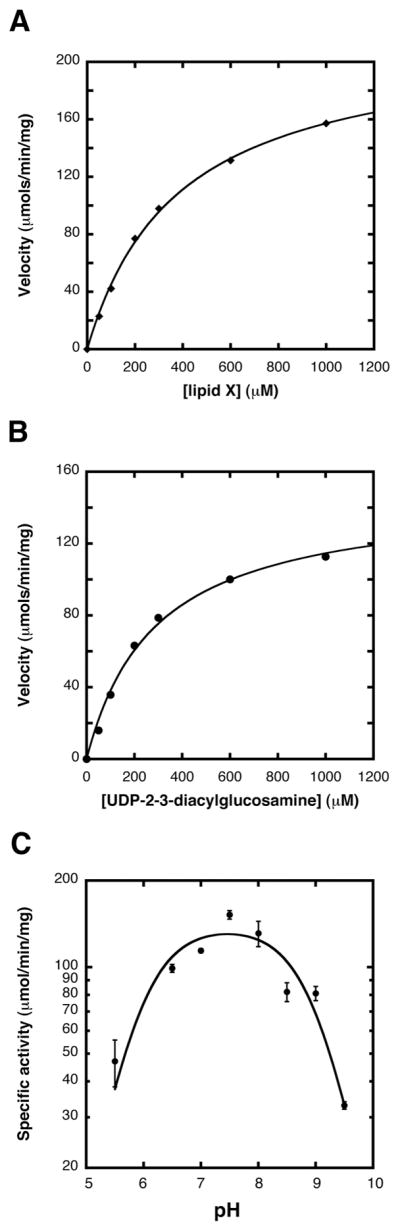
Panel A Purified E. coli LpxB from strain C41(DE3)/pECLpxB19 was assayed under standard conditions except that UDP-2,3-diacyl-GlcN was constant at 1200 μM, and lipid X was varied from 50 to 1000 μM. The velocities were fit to a standard Michaelis-Menten function using the program KaleidaGraph. The Michaelis-Menten plots were linear. With respect to lipid X, the apparent KM was 381 ± 23 μM, and the apparent Vmax was 271 ± 6 nmol/min/mg. Panel B. In this experiment lipid X was held at 1200 μM, while UDP-2,3-diacyl-GlcN was varied from 50 to 1000 μM. With respect to UDP-2,3-diacyl-GlcN, the apparent KM was 287 ± 34 μM, and the apparent Vmax was 147 ± 7 nmol/min/mg. Panel C. E. coli LpxB was assayed over the indicated pH range under optimized assay conditions with a triple-buffer system consisting of 100 mM sodium acetate, 50 mM bis(2-hydroxymethyl)-imino-tris(hydroxymethly)-hexane, and 50 mM Tris (30).
Effect of detergent on E. coli LpxB activity
Purified enzyme was assayed under standard assay conditions at varying concentrations of Triton X-100. Between 0 and 500 μM Triton X-100 increased the apparent specific activity five-fold (Figure 5A) with lipid X and UDP-2-3-diacylglucosamine concentrations held at 400 μM and 600 μM, respectively. The Triton X-100 concentration in this experiment never exceeded 1 mM. To determine whether LpxB activity is dependent upon the bulk concentration of the micelle surface (31), the molar ratios of lipid X, UDP-2-3-diacylglucosamine, and Triton X-100 were fixed with respect to each other. The bulk concentration ([lipid X] + [UDP-2-3-diacylglucosamine] + [Triton X-100]) was then varied from 28 μM to 1.8 mM (Figure 5B). A sigmoidal relationship, highlighted in the inset, is seen when the bulk surface concentration is varied between ~60 and 230 μM. This behavior is suggestive of interfacial activation, because the apparent specific activity drops sharply as the mixed micelle surface approaches the critical micelle concentration of Triton X-100 (50–100 μM) (31).
Figure 5. Effect of detergent concentration on E. coli LpxB activity.

Panel A Pure LpxB from C41(DE3)/pECLpxB23 (Table 1) was assayed under standard conditions (400 μM lipid X and 600 μM UDP-2,3-diacyl-GlcN), except that the concentration of Triton X-100 (estimated average molecular of 647) was varied from 10 μM to 1 mM. Each point represents the average of two identical experiments. Panel B. Pure LpxB from C41(DE3)/pECLpxB-TEV was assayed under conditions similar to those in Panel A, except that the molar ratio of lipid X:UDP-2,3-diacyl-GlcN:Triton X-100 was held constant at 2:3:4, and then varied from 0.028 mM to 1.8 mM. The inset shows the sigmoidal behavior of the reaction velocity at low bulk concentrations. Panel C. To evaluate the effects of surface dilution, pure LpxB from C41(DE3)/pECLpxB-TEV was assayed with 50 μM lipid X and 75 μM UDP-2,3-diacylglucosamine, and the concentration of Triton X-100 was varied from 0.1 to 13.6 mM. The resulting curve was fit to a single exponential decay function.
To probe the effect of surface dilution on the apparent specific activity of E. coli LpxB, the Triton X-100 concentration was varied over a larger concentration range (50 μM to 14 mM) than used in Figure 5A. Moreover, the substrate concentrations were fixed at ~10-fold lower values (50 μM and 75 μM for lipid X and UDP-2-3-diacylglucosamine, respectively) than those used in the standard assay condition. The resulting curve was fit to a single exponential decay (Figure 5C), consistent with the dilution of the LpxB substrates at the micelle surface by Triton X-100 (31).
Site directed mutagenesis of conserved E. coli LpxB residues
Highly (~90%) or absolutely conserved residues present in the available LpxB orthologs were mutated to alanine. These mutant proteins were expressed, purified, and assayed for activity as described in the Supporting Information. As judged by SDS-PAGE analysis, the expression levels and purification behaviors of the mutant proteins were similar to the wild-type (data not shown). Among the subset of absolutely conserved residues, two LpxB variants (D98A an R201A) had no detectable activity, suggesting that they may play important roles in catalysis or substrate binding. Substitution of the other residues with alanine resulted in mutant proteins that retained between 1 and 10% of the wild-type LpxB activity (Supporting Table 4). The absolutely conserved residues T277 and E281 and the highly conserved residue E326 were not investigated.
Identification of bound phospholipids purifying with E. coli LpxB
LpxB that was not exposed to DDM or Triton X-100 after the initial ultracentrifugation step could be purified by the standard metal affinity chromatography and TEV protease cleavage protocols. The phospholipids associated with the protein were extracted using a two-phase Bligh-Dyer system and analyzed in the negative ion mode by ESI-MS (Figure 6A). The major phospholipids associated with LpxB are similar in composition to the total E. coli phospholipids (41), suggesting that LpxB does not bind a particular molecular species. Upon repetition of this experiment with purified LpxB that had been treated with or 1% w/v DDM prior to Ni-NTA chromatography, a ~100-fold reduction in LpxB-associated phospholipids was observed (Figure 6B). Treatment with 1% w/v Triton X-100 or 1% w/v octyl-β-D-glucopyranoside yielded similar results (data not shown).
Figure 6. Phospholipids are bound to E. coli LpxB purified in the absence of detergents.

Panel A Pure LpxB, prepared without exposure to detergent from C41(DE3)/pECLpxB19 (Table 1), was extracted with a two-phase Bligh-Dyer system. The lower phase was dried under N2, re-dissolved in chloroform/methanol (2:1, v/v), and analyzed by ESI/MS in the negative ion mode following direct injection into an ABI QSTAR-XL time-of-flight mass spectrometer. The phospholipids species are: PE, phosphoethanolamine; and PG, phosphatidylglycerol. Panel B. E. coli LpxB was purified as above, except that the Ni-NTA-immobilized enzyme was washed with buffer containing 1% w/v DDM, as in the preparation shown in Table 2. There is a 100-fold decrease in the amount of phospholipids recovered in comparison to Panel A.
In order to quantify the ratio of bound phospholipids per LpxB monomer, purified E. coli LpxB that had not been treated with detergent was extracted together with a known amount of a synthetic phosphatidylethanolamine standard (17:0, 14:1) with an exact mass of 675.48. The extracted phospholipids were then fractionated by reverse-phase chromatography, and the effluent was continuously monitored by ESI-MS (35). The area of the extracted ion current (EIC) of the standard was compared to the corresponding areas of the three most abundant endogenous phosphatidylethanolamine species (Supporting Table 5), allowing us to estimate the approximate molar quantity of each (Supporting Table 5). With the additional assumptions described in the Materials and Methods section, the molar ratio of phospholipids to LpxB monomer was about 1:1.6.
Quantification of phospholipids bound to E. coli LpxB by 32P-labeling
The molar ratio of phospholipids bound to LpxB (purified without exposure to detergent) was confirmed by labeling cultures of E. coli C41(DE3)/pECLpxB19 and the vector control C41(DE3)/pET19b with 32Pi. The cell pellets were divided into two portions: one was directly extracted by the Bligh-Dyer method to determine the total phospholipid content. The cells in the other portion were lysed and subjected to Ni-NTA affinity chromatography. The LpxB-containing fractions in the 300 mM imidazole eluate were then extracted with the Bligh-Dyer method. The total number of counts in each fraction was quantified. There were 100 times fewer counts in the Ni-NTA fractions from the vector control than from the (His)10-tagged LpxB fractions (Supporting Table 6), confirming that some phospholipid molecules are indeed associated with LpxB. Assuming that ~10 μg of phospholipids are present per ml of culture at A600 = 1.0 (38) and knowing the amount of LpxB protein recovered, we calculated that 9.3 nmol or 12.6 nmol of phospholipids were purified together with 2.9 nmol of LpxB in two separate experiments, corresponding to an average protein to phospholipid to molar ratio of 1:3.5 (Supporting Table 6). Although this value is slightly higher than the amount determined by mass spectrometry (Supporting Table 5), both results exclude the possibility of a phospholipid vesicle being associated with the purified LpxB protein (42).
Nearly two times more total 32P-labeled phospholipids were extracted from the cell pellets of the LpxB over-expressing strain relative to the vector control (Supporting Table 5). To determine whether or not the over-expression of LpxB altered the phospholipid composition of the host cells, we separated the labeled phospholipids by TLC and quantified their relative amounts. The LpxB over-expressing strain contained somewhat more phosphatidylglycerol and cardiolipin than the vector control (Supporting Table 7). However, the composition of the phospholipids associated with LpxB was indistinguishable from that of the total wild-type cell pellet.
Transmission electron microscopy of E. coli cells over-expressing LpxB
E. coli cells in which LpxB is massively over-expressed contain nearly twice the quantity of phospholipids as paired vector-controls (Supporting Table 6), suggesting that LpxB over-expression perturbs the membrane phospholipid biosynthesis. LpxB-expressing and vector-control strains were therefore examined by thin-section transmission electron microscopy. The vector-control strain showed a typical E. coli cell envelope (Figure 8A and B). In contrast, at least 50% of the LpxB-expressing cells accumulated aberrant tubular membranes (Figure 8C and D) of a uniform diameter, situated mainly along the inner surface of the inner membrane.
Discussion
LpxB, the lipid A disaccharide synthase, is an essential enzyme in nearly all Gram-negative bacteria (3). As members of the GT-B superfamily of glycosyltransferases, E. coli and H. influenzae LpxB are inverting glycosyltransferases in CAZy sub-family 19 (http://www.cazy.org/), a grouping that includes hundreds of putative LpxB orthologs, but no other glycosyltransferases. Equipped with an improved autoradiographic LpxB assay (Figure 2), we have now developed robust expression and purification procedures for E. coli and H. influenzae LpxB (Figure 1). E. coli LpxB activity is surface-concentration dependent (Figure 5), but its surface association is largely mediated by ionic interactions. Phospholipids co-purify with E. coli LpxB, as demonstrated by radioactive labeling and mass-spectrometry (Figure 6 and Supporting Tables 5, 6 and 7). Alanine-scanning mutagenesis of a subset of conserved LpxB residues, and purification of the mutant gene products, allowed us to identify two conserved residues without which there is no measurable LpxB activity (Supporting Table 4).
High-copy pET plasmids, induced in the E. coli BLR(DE3)-derived strain, C41(DE3) (40), yielded nearly 100-fold greater LpxB over-expression than our previously reported strains (22). Moreover, the addition of a C- or N-terminal polyhistidine tag to LpxB was crucial for over-expression. This observation has precedent, although it is unclear whether the polyhisitidine tag is disrupting regulatory mRNA structure, preventing protein degradation, or enhancing protein folding. The use of these tags also facilitated the development of a rapid purification by Ni-NTA affinity chromatography. Moreover, the use of TEV-protease-cleavable polyhistidine tags (25, 27) facilitated the efficient removal of co-purifying contaminant proteins, and permitted us to purify both E. coli and H. influenzae LpxB to near-homogeneity (Figure 1).
The oligomerization states of E. coli and H. influenzae LpxB were probed by size exclusion chromatography (Figure 3). E. coli LpxB, in the absence of detergent, elutes as an apparent octamer (Figure 3A), while the H. influenzae enzyme is an apparent monomer under similar conditions (Figure 3B). When sizing chromatography is performed on E. coli LpxB in the presence of DDM, the octamer shifts to a smaller species consistent with either a monomer or a dimer (Figure 3C). This observation further suggests that the self-association of purified E. coli LpxB may be mediated, at least in part, by hydrophobic contacts.
We determined the apparent kinetic parameters for purified E. coli LpxB (Figure 4). The KM values were within two-fold of those that we previously reported in the absence of Triton X-100 (22), while the apparent Vmax values were about 10-fold higher, probably because of the optimized assay. Given that surface dilution effects are observed in this system (Figure 5), the physiological relevance of these apparent kinetic parameters is difficult to evaluate. When the substrate concentrations were fixed at low values and the concentration of Triton was varied from 1 to 112-fold that of the substrates (Figure 5C), the apparent LpxB activity decreased dramatically. This dilution effect is characteristic of surface-active enzymes (31).
If LpxB is not exposed to detergent during purification, it contains several bound E. coli phospholipid molecules per monomer, as judged by negative-mode ESI-MS analysis (Figure 6 and Supporting Table 5) and 32P labeling studies (Supporting Tables 6 and 7). The bound lipids were not enriched for any particular species. LpxB activity is not stimulated by E. coli phospholipids, nor is the phospholipid free preparation less active than the phospholipid-containing enzyme (data not shown).
When comparing the total 32P-labelled phospholipid content of an E. coli LpxB over-expressing strain to that of a matched vector control, we noted a two-fold accumulation of phospholipids in cells over-producing LpxB (Supporting Table 6). Moreover, we observed a statistically significant relative increase in the amount of anionic phospholipids (Supporting Table 7). We therefore examined the morphology of these LpxB over-expressing strains by transmission electron microscopy and noted the accumulation of tubules of uniform diameter along the inner membrane (Figure 7). Similar, aberrant membrane phenotypes have been observed in E. coli strains that over-express sn-glycerol-3-phosphate acyltransferase (43) and the peptidoglycan biosynthetic glycosyl transferase MurG (42, 44). How the overproduction of a specific membrane protein stimulates de novo phospholipid synthesis requires further exploration.
Figure 7. Transmission electron microscopy of E. coli cells over-expressing LpxB.

Thin-section transmission electron micrographs of induced C41(DE3)/pET19b vector control cells (Panels A and B) compared to induced C41(DE3)/pECLpxB19 cells (Panels C and D). Cells were fixed with 2.5 % w/v glutaraldehyde and 1% w/v tannic acid, and then were stained with osmium tetroxide, uranyl acetate, and lead acetate (39). Aberrant tubular membranes (black arrows) were observed in over 50% of the induced C41(DE3)/pECLpxB19 cells.
Alanine-scanning mutagenesis of a subset of conserved LpxB residues was carried out, and the mutant proteins were expressed, purified to homogeneity, and assayed. Two mutants, D98A and R201A, had no detectable catalytic activity (Supporting Table 4). Given that these constructs did not form inclusion bodies and purified in a manner similar to the wild-type enzyme, it is unlikely that either mutation caused gross protein misfolding. The micellar nature of the LpxB substrates (22, 45) (Figure 5) precludes the facile analysis of these mutants by standard enzyme kinetics.
Our analysis of LpxB’s behavior at the membrane surface (Figure 5) and its purification with a small number of lipid molecules (Figure 6) may facilitate its crystallization. The identification of key functional residues (Supporting Table 4) should further aid in mechanistic and structural studies. Precedent exists for using inactive point mutants to capture membrane proteins in conformations that promote crystal formation (46). Although LpxB has a predicted secondary structure that is similar to those of other glycosyl transferases, including MurG for which a structure is available (44), the diversity of glycosyl transferase substrate binding sites and catalytic strategies probably arises from the variable loops between the regions of conserved secondary structure (23). Knowledge of the structure of LpxB should reveal its unique lipid-binding properties (Scheme 1) and may facilitate the development of novel inhibitors with utility as antibiotics.
Supplementary Material
Acknowledgments
This research was supported by NIH Grant GM-51310 to C. R. H. Raetz and the LIPID MAPS Large Scale Collaborative Grant GM-069338. Louis Metzger was supported by National Science Foundation Graduate Research Fellowship 2005029353.
We thank Dr. Teresa Garrett, Dr. David Six, Dr. Hak Suk Chung, Dr. Jinshi Zhao, and Dr. John K. Lee for helpful discussions and advice. We thank Dr. Ziqiang Guan, Ms. Andrea Ryan, and Mr. Reza Kordestani for their assistance with mass spectrometry, and Mr. Harold Meekel (University of North Carolina, Chapel Hill) for his assistance with transmission electron microscopy. We thank Dr. David Six and other members of the Raetz laboratory for their critical reading of the manuscript.
The abbreviations are
- CL
cardiolipin
- DDM
dodecylmaltoside
- 2,3-diacyl-GlcN or lipid X
2,3-diacylglucosamine-1-phosphate
- DSMP
2′,3′-diacylglucosamine-(β,1′-6)-2,3-diacylglucosamine-1-phosphate
- EIC
extracted ion current
- ESI-MS
electrospary-ionization mass spectrometry
- HEPES
4-(2-hydroxyethyl)-1-piperazineethanesulfonic acid
- IPTG
isopropyl β-D-1-thiogalactopyranoside
- LPS
lipopolysaccharide
- PBS
phosphate-buffered saline
- PCR
polymerase chain reaction
- PE
phosphatidylethanolamine
- PG
phosphatidylglycerol
- SDS-PAGE
sodium dodecyl sulfate-polyacrylamide gel electrophoresis
- TCEP
tris-(2-carboxyethyl)-phosphine
- TEV protease
tobacco etch virus protease
- TLC
thin-layer chromatography
- UDP-2,3-diacyl-GlcN
UDP-2,3-diacylglucosamine.
References
- 1.Raetz CRH, Whitfield C. Lipopolysaccharide endotoxins. Annu Rev Biochem. 2002;71:635–700. doi: 10.1146/annurev.biochem.71.110601.135414. [DOI] [PMC free article] [PubMed] [Google Scholar]
- 2.Nikaido H. Molecular basis of bacterial outer membrane permeability revisited. Microbiol Mol Biol Rev. 2003;67:593–656. doi: 10.1128/MMBR.67.4.593-656.2003. [DOI] [PMC free article] [PubMed] [Google Scholar]
- 3.Raetz CRH, Reynolds CM, Trent MS, Bishop RE. Lipid A modification systems in gram-negative bacteria. Annu Rev Biochem. 2007;76:295–329. doi: 10.1146/annurev.biochem.76.010307.145803. [DOI] [PMC free article] [PubMed] [Google Scholar]
- 4.Brade H, Opal SM, Vogel SN, Morrison DC. Marcel Dekker, Inc; New York: 1999. p. 950. [Google Scholar]
- 5.Meredith TC, Aggarwal P, Mamat U, Lindner B, Woodard RW. Redefining the requisite lipopolysaccharide structure in Escherichia coli. ACS Chem Biol. 2006;1:33–42. doi: 10.1021/cb0500015. [DOI] [PubMed] [Google Scholar]
- 6.Medzhitov R, Janeway C., Jr Innate immunity. N Engl J Med. 2000;343:338–344. doi: 10.1056/NEJM200008033430506. [DOI] [PubMed] [Google Scholar]
- 7.Akira S, Uematsu S, Takeuchi O. Pathogen recognition and innate immunity. Cell. 2006;124:783–801. doi: 10.1016/j.cell.2006.02.015. [DOI] [PubMed] [Google Scholar]
- 8.Gay NJ, Gangloff M. Structure and function of toll receptors and their ligands. Annu Rev Biochem. 2007;76:141–165. doi: 10.1146/annurev.biochem.76.060305.151318. [DOI] [PubMed] [Google Scholar]
- 9.Poltorak A, He X, Smirnova I, Liu MY, Huffel CV, Du X, Birdwell D, Alejos E, Silva M, Galanos C, Freudenberg M, Ricciardi-Castagnoli P, Layton B, Beutler B. Defective LPS signaling in C3H/HeJ and C57BL/10ScCr mice: mutations in Tlr4 gene. Science. 1998;282:2085–2088. doi: 10.1126/science.282.5396.2085. [DOI] [PubMed] [Google Scholar]
- 10.Hoshino K, Takeuchi O, Kawai T, Sanjo H, Ogawa T, Takeda Y, Takeda K, Akira S. Cutting edge: Toll-like receptor 4 (TLR4)-deficient mice are hyporesponsive to lipopolysaccharide: evidence for TLR4 as the Lps gene product. J Immunol. 1999;162:3749–3752. [PubMed] [Google Scholar]
- 11.Park BS, Song DH, Kim HM, Choi BS, Lee H, Lee JO. The structural basis of lipopolysaccharide recognition by the TLR4-MD-2 complex. Nature. 2009;458:1191–1195. doi: 10.1038/nature07830. [DOI] [PubMed] [Google Scholar]
- 12.Li A, Chang AC, Peer GT, Hinshaw LB, Taylor FB., Jr Comparison of the capacity of rhTNF-alpha and Escherichia coli to induce procoagulant activity by baboon mononuclear cells in vivo and in vitro. Shock. 1996;5:274–279. doi: 10.1097/00024382-199604000-00007. [DOI] [PubMed] [Google Scholar]
- 13.Drake TA, Cheng J, Chang A, Taylor FB., Jr Expression of tissue factor, thrombomodulin, and E-selectin in baboons with lethal Escherichia coli sepsis. Am J Pathol. 1993;142:1458–1470. [PMC free article] [PubMed] [Google Scholar]
- 14.Russell JA. Management of sepsis. N Engl J Med. 2006;355:1699–1713. doi: 10.1056/NEJMra043632. [DOI] [PubMed] [Google Scholar]
- 15.Rietschel ET, Kirikae T, Schade FU, Mamat U, Schmidt G, Loppnow H, Ulmer AJ, Zähringer U, Seydel U, Di Padova F, Schreier M, Brade H. Bacterial endotoxin: molecular relationships of structure to activity and function. FASEB Journal. 1994;8:217–225. doi: 10.1096/fasebj.8.2.8119492. [DOI] [PubMed] [Google Scholar]
- 16.Onishi HR, Pelak BA, Gerckens LS, Silver LL, Kahan FM, Chen MH, Patchett AA, Galloway SM, Hyland SA, Anderson MS, Raetz CRH. Antibacterial agents that inhibit lipid A biosynthesis. Science. 1996;274:980–982. doi: 10.1126/science.274.5289.980. [DOI] [PubMed] [Google Scholar]
- 17.McClerren AL, Endsley S, Bowman JL, Andersen NH, Guan Z, Rudolph J, Raetz CRH. A slow, tight-binding inhibitor of the zinc-dependent deacetylase LpxC of lipid A biosynthesis with antibiotic activity comparable to ciprofloxacin. Biochemistry. 2005;44:16574–16583. doi: 10.1021/bi0518186. [DOI] [PMC free article] [PubMed] [Google Scholar]
- 18.Babinski KJ, Kanjilal SJ, Raetz CRH. Accumulation of the lipid A precursor UDP-2,3-diacylglucosamine in an Escherichia coli mutant lacking the lpxH gene. J Biol Chem. 2002;277:25947–25956. doi: 10.1074/jbc.M204068200. [DOI] [PubMed] [Google Scholar]
- 19.Babinski KJ, Ribeiro AA, Raetz CRH. The Escherichia coli gene encoding the UDP-2,3-diacylglucosamine pyrophosphatase of lipid A biosynthesis. J Biol Chem. 2002;277:25937–25946. doi: 10.1074/jbc.M204067200. [DOI] [PubMed] [Google Scholar]
- 20.Takayama K, Qureshi N, Mascagni P, Nashed MA, Anderson L, Raetz CRH. Fatty acyl derivatives of glucosamine 1-phosphate in Escherichia coli and their relation to lipid A: complete structure of a diacyl GlcN-1-P found in a phosphatidylglycerol-deficient mutant. J Biol Chem. 1983;258:7379–7385. [PubMed] [Google Scholar]
- 21.Ray BL, Painter G, Raetz CRH. The biosynthesis of gram-negative endotoxin: formation of lipid A disaccharides from monosaccharide precursors in extracts of Escherichia coli. J Biol Chem. 1984;259:4852–4859. [PubMed] [Google Scholar]
- 22.Radika K, Raetz CRH. Purification and properties of lipid A disaccharide synthase of Escherichia coli. J Biol Chem. 1988;263:14859–14867. [PubMed] [Google Scholar]
- 23.Lairson LL, Henrissat B, Davies GJ, Withers SG. Glycosyltransferases: structures, functions, and mechanisms. Annu Rev Biochem. 2008;77:521–555. doi: 10.1146/annurev.biochem.76.061005.092322. [DOI] [PubMed] [Google Scholar]
- 24.Wang RF, Kushner SR. Construction of versatile low-copy-number vectors for cloning, sequencing and gene expression in Escherichia coli. Gene. 1991;100:195–199. [PubMed] [Google Scholar]
- 25.Lucast LJ, Batey RT, Doudna JA. Large-scale purification of a stable form of recombinant tobacco etch virus protease. Biotechniques. 2001;30:544–550. doi: 10.2144/01303st06. [DOI] [PubMed] [Google Scholar]
- 26.Nishijima M, Bulawa CE, Raetz CRH. Two interacting mutations causing temperature-sensitive phosphatidylglycerol synthesis in Escherichia coli membranes. J Bacteriol. 1981;145:113–121. doi: 10.1128/jb.145.1.113-121.1981. [DOI] [PMC free article] [PubMed] [Google Scholar]
- 27.Phan J, Zdanov A, Evdokimov AG, Tropea JE, Peters HK, 3rd, Kapust RB, Li M, Wlodawer A, Waugh DS. Structural basis for the substrate specificity of tobacco etch virus protease. J Biol Chem. 2002;277:50564–50572. doi: 10.1074/jbc.M207224200. [DOI] [PubMed] [Google Scholar]
- 28.Smith PK, Krohn RI, Hermanson GT, Mallia AK, Gartner FH, Provenzano MD, Fujimoto EK, Goeke NM, Olson BJ, Klenk DC. Measurement of protein using bicinchoninic acid. Anal Biochem. 1985;150:76–85. doi: 10.1016/0003-2697(85)90442-7. [DOI] [PubMed] [Google Scholar]
- 29.Bartling CM, Raetz CRH. Steady-state kinetics and mechanism of LpxD, the N-acyltransferase of lipid A biosynthesis. Biochemistry. 2008;47:5290–5302. doi: 10.1021/bi800240r. [DOI] [PMC free article] [PubMed] [Google Scholar]
- 30.McClerren AL, Zhou P, Guan Z, Raetz CRH, Rudolph J. Kinetic analysis of the zinc-dependent deacetylase in the lipid A biosynthetic pathway. Biochemistry. 2005;44:1106–1113. doi: 10.1021/bi048001h. [DOI] [PubMed] [Google Scholar]
- 31.Carman GM, Deems RA, Dennis EA. Lipid signaling enzymes and surface dilution kinetics. J Biol Chem. 1995;270:18711–18714. doi: 10.1074/jbc.270.32.18711. [DOI] [PubMed] [Google Scholar]
- 32.Miller JR. Experiments in Molecular Genetics. Cold Spring Harbor Laboratory; Cold Spring Harbor, NY: 1972. [Google Scholar]
- 33.Bligh EG, Dyer JJ. A rapid method of total lipid extraction and purification. Can J Biochem Physiol. 1959;37:911–917. doi: 10.1139/o59-099. [DOI] [PubMed] [Google Scholar]
- 34.Nishijima M, Raetz CRH. Membrane lipid biogenesis in Escherichia coli: identification of genetic loci for phosphatidylglycerophosphate synthetase and construction of mutants lacking phosphatidylglycerol. J Biol Chem. 1979;254:7837–7844. [PubMed] [Google Scholar]
- 35.Guan Z, Li S, Smith DC, Jr, Shaw WA, Raetz CRH. Identification of N-acyl phosphatidylserine molecules in eukaryotic cells. Biochemistry. 2007;46:14500–14513. doi: 10.1021/bi701907g. [DOI] [PMC free article] [PubMed] [Google Scholar]
- 36.Cronan JE. Bacterial membrane lipids: where do we stand? Annu Rev Microbiol. 2003;57:203–224. doi: 10.1146/annurev.micro.57.030502.090851. [DOI] [PubMed] [Google Scholar]
- 37.Doerrler WT, Reedy MC, Raetz CRH. An Escherichia coli mutant defective in lipid export. J Biol Chem. 2001;276:11461–11464. doi: 10.1074/jbc.C100091200. [DOI] [PubMed] [Google Scholar]
- 38.Raetz CRH, Kantor GD, Nishijima M, Newman KF. Cardiolipin accumulation in the inner and outer membranes of Escherichia coli mutants defective in phosphatidylserine synthetase. J Bacteriol. 1979;139:544–551. doi: 10.1128/jb.139.2.544-551.1979. [DOI] [PMC free article] [PubMed] [Google Scholar]
- 39.Robertson JD, Schreil W, Reedy M. Halobacterium halobium. I. A thin-sectioning electron-microscopic study. J Ultrastruct Res. 1982;80:148–162. doi: 10.1016/s0022-5320(82)90014-4. [DOI] [PubMed] [Google Scholar]
- 40.Miroux B, Walker JE. Over-production of proteins in Escherichia coli: mutant hosts that allow synthesis of some membrane proteins and globular proteins at high levels. J Mol Biol. 1996;260:289–298. doi: 10.1006/jmbi.1996.0399. [DOI] [PubMed] [Google Scholar]
- 41.Raetz CRH. Molecular genetics of membrane phospholipid synthesis. Annu Rev Genet. 1986;20:253–295. doi: 10.1146/annurev.ge.20.120186.001345. [DOI] [PubMed] [Google Scholar]
- 42.van den Brink-van der Laan E, Boots JW, Spelbrink RE, Kool GM, Breukink E, Killian JA, de Kruijff B. Membrane interaction of the glycosyltransferase MurG: a special role for cardiolipin. J Bacteriol. 2003;185:3773–3779. doi: 10.1128/JB.185.13.3773-3779.2003. [DOI] [PMC free article] [PubMed] [Google Scholar]
- 43.Wilkison WO, Bell RM, Taylor KA, Costello MJ. Structural characterization of ordered arrays of sn-glycerol-3-phosphate acyltransferase from Escherichia coli. J Bacteriol. 1992;174:6608–6616. doi: 10.1128/jb.174.20.6608-6616.1992. [DOI] [PMC free article] [PubMed] [Google Scholar]
- 44.Hu Y, Chen L, Ha S, Gross B, Falcone B, Walker D, Mokhtarzadeh M, Walker S. Crystal structure of the MurG:UDP-GlcNAc complex reveals common structural principles of a superfamily of glycosyltransferases. Proc Natl Acad Sci U S A. 2003;100:845–849. doi: 10.1073/pnas.0235749100. [DOI] [PMC free article] [PubMed] [Google Scholar]
- 45.Lipka G, Demel RA, Hauser H. Phase behaviour of lipid X. Chem Phys Lipids. 1988;48:267–280. doi: 10.1016/0009-3084(88)90097-7. [DOI] [PubMed] [Google Scholar]
- 46.Guan L, Mirza O, Verner G, Iwata S, Kaback HR. Structural determination of wild-type lactose permease. Proc Natl Acad Sci U S A. 2007;104:15294–15298. doi: 10.1073/pnas.0707688104. [DOI] [PMC free article] [PubMed] [Google Scholar]
Associated Data
This section collects any data citations, data availability statements, or supplementary materials included in this article.