

Abstract
Purpose
Dysfunction of pharyngeal constrictors (PCs) after chemo-irradiation of head and neck (HN) cancer has been proposed as major cause of dysphagia. We conducted prospective MRI study to evaluate anatomical changes in the PCs after chemoirradiation, to gain insight of the mechanism of their dysfunction and their dose-effect relationships. The PCs were compared to the sternocleidomastoid muscles (SCMs), which receive high doses but do not relate to swallowing.
Patients and Methods
Twelve patients with stage III-IV HN cancer underwent MRI before and 3 months after the completing chemo-irradiation. T1- and T2-weighted signals and muscle thickness were evaluated for PCs (superior, middle, and inferior), and SCMs. Mean muscle doses were determined after registration with the planning CT.
Results
T1-weighted signals decreased in both PCs and SCMs receiving >50 Gy (p<0.03), but not in muscles receiving lower doses. T2-weighted signals in the PCs increased significantly as the dose increased (R2=0.34, p=0.01). The T2 signal changes in the PCs were significantly higher than the T2 changes in the SCMs (p<0.001). Increased thickness was noted in all PCs, with muscles receiving >50 Gy gaining significantly more thickness than PCs receiving lesser doses (p=0.02). In contrast, the SCM thickness decreased post-therapy (p=0.002).
Conclusions
These MRI-based findings, notably the differences between PCs and SCMs, suggest that underlying causes of PC dysfunction are inflammation and edema, likely consequential to acute mucositis affecting the submucosa - lying PCs. These results support reducing mean PC doses to ≤50 Gy, as well as reducing acute mucositis, to improve long-term dysphagia.
Keywords: Head and neck cancer, radiotherapy, dysphagia, swallowing, pharyngeal constrictors
Introduction
Intensified chemo-irradiation (RT) regimens for head and neck have led to improved tumor control rates at the expense of high rates of dysphagia and aspirations, which have emerged as major sequellae of treatment intensification [1]. Recent studies have suggested that these sequellae are, at least in part, due to damage and dysfunction of specific swallowing structures including the glottic and supraglottic larynx (GSL), and the pharyngeal constrictors (PC). These structures were found to change anatomically after chemo-RT, and their malfunction explained the post- therapy abnormalities observed in objective assessments of swallowing [2]. We and others have recently reported significant correlations between the radiation doses delivered to the PCs or GSL and clinical measures of swallowing dysfunction, including videoflouroscopy and observer-based, or patient-reported, dysphagia [3-9]. However, what is the nature of the anatomical damage of the swallowing structures, its pathophysiology, whether and how it differs from the effect of chemo-RT on other muscles in the head and neck, and whether there are dose-effect relationships for these anatomical changes, have not yet been explored. These are the subjects of the current study.
MRI is often used as an imaging tool for assessment of muscle pathology. It can demonstrate muscle inflammation, edema, myositis, fibrosis, and denervation atrophy, by discriminating between mesenchymal alterations of muscle fat and edema, and by defining less common processes such as calcification and hemorrhage [10-12]. An assessment of the MRI-based changes in the swallowing structures due to chemo-RT can help understand the pathophysiology of their malfunction, which may help devise effective measures to ameliorate it.
In this pilot prospective study we sought to determine whether there are unique MRI-detected changes occurring in the PCs from pre-therapy to 3 months after the completion of therapy, and whether these changes may correlate with the radiation doses delivered to these muscles. We also compared these changes to those observed in muscles which do not participate in the swallowing process, like the sternocleidomastoid (SCM) ipsilateral to the tumor, which typically receive high RT doses but do not usually demonstrate clinically apparent dysfunction after therapy.
Patients and Methods
This was a prospective study of MRI performed before chemo-RT and 3 months after the completion of therapy in 12 patients with locoregionally advanced HN squamous cell cancer. The study was approved by the Institutional Review Board of the University of Michigan and all patients signed an approved study-specific consent form.
The primary tumor sites included: tonsil (five patients), base of tongue (three), unknown primary (two), nasopharynx (one),and hypopharynx (one patient). Tumor stages included T4-three patients,T3-one, T2-five,T1-two, and unknown -two patients. N stages included N3-three patients, N2-eight, and N0-one. All patients were treated with concomitant chemotherapy: weekly carboplatin and taxotere -10 patients, and cisplatin-5FU combination -two patients. Ten patients were treated with intensity modulated RT (IMRT) and two with 3D RT. The total prescribed gross tumor volume (GTV) dose was 70 Gy in all cases. The clinical target volumes (CTVs) received 50-63 Gy at 1.6-1.8 Gy/fraction.
MR imaging was performed on a 3.0 Tesla Philips Achieva scanner (Netherlands) using a head-and-neck coil in supine position. MR imaging sequences included high-resolution axial fast spin-echo T2-weighted (T2W) images (TR/TE = 3000 -9700 ms/120 ms, ∼0.5×0.5×5.5 mm3), and T1-weighted (T1W) images (TR/TE = 560-700 ms/9-ms, ∼0.5×0.5×5.5 mm3) prior to gadolinium contrast.
Muscle contouring
The muscles were contoured on each MRI axial cuts. The whole PC, as well as the SCM ipsilateral to the primary tumor, were contoured on each T1 and T2 weighted axial MRI cuts. The PCs were then divided to superior (SPC), middle (MPC), and inferior (IPC). This division was performed according to a scheme following Gray's Anatomy [13], detailed in previous studies [2-3]. The cranial-most extent of the whole PC's was the caudal tips of the pterygoid plates, and the caudal-most extent was the inferior border of the cricoid cartilage. The SPC was defined from the caudal tips of the pterygoid plates through the upper edge of the hyoid bone, MPC was defined from the upper through the caudal-most edge of the hyoid, and the IPC was defined from below the hyoid through the caudal edge of the cricoid cartilage. Only the parts of the PCs which were clearly detected on MRI were outlined. In general, the lateral extents of the PCs were outlined to the approximate sites of the pterygomandibuilar rephe (SPC), the lateral edges of the hyoid (MPC), or the lateral edges of the thyroid cartilage (IPC), as previously detailed [3].
The SCM ipsilateral to the primary tumor was contoured in each patient from the mastoid process cranially through its caudal connection to the sternum and clavicle. For comparisons with the PCs, the SCM was divided to three parts corresponding in the cranio-caudal axis to the PCs: superior, middle, and inferior (SSCM, MSCM, ISCM).
The parts of the PCs and the SCMs which were grossly involved by tumor were excluded from the muscle volumes used for MRI analysis in order to obtain only muscle-specific MRI changes. Muscle thickness was measured in the MRI axial cut at the middle of the cranio-caudal axis of each muscle. Pre and post –treatment comparisons were performed among MRI cuts from the same anatomical locations.
The mean radiation dose for each muscle was calculated via co-registration of the treatment planning CT and dose distributions with the pre-treatment MRI. Registration was achieved using a mutual information translation algorithm as previously described [14]. After registration, the mean dose to each muscle was derived from the treatment plan dose distributions.
The T1W and T2W MRI signal intensities of the PC and SCM were normalized to the intensities in the regions of the brain that received very low doses (<10 Gy). Changes in signal intensities of each of the three PCs in each patient post RT compared to pre-RT for T1W and for T2W MRI were measured based on elongation of relaxation times of MRI in the muscular units.
Comparisons of the radiologic measures before vs. after therapy for the same patients were made by paired t tests. The correlations of the mean doses to each muscle with the changes in T1W or T2W signals, or thickness, were tested using Pearson correlation coefficients. Statistical significance was determined as p< 0.05, two-tailed.
Results
The average (±S.D.) mean dose to the whole PCs was 52±18 Gy and the average mean doses to the SPCs, MPCs, and IPCs were 59±13 Gy, 56±15 Gy, and 41±22 Gy, respectively. The average mean doses to all SCM muscles was 59+17 Gy, and the average mean doses to the SCM segments which corresponded anatomically to the PCs: SSCM, MSCM, and ISCM, were 60±13 Gy, 60±14Gy, and 57±22Gy, respectively. MRI-based changes were assessed in the SPCs and MPCs in all 12 patients, and in the IPCs of 11 patients, due to post-therapy MRI study in one patient which was not caudal enough to encompass the whole IPC. MRI changes in the SCMs could not be assessed in the ISCM of the patient whose scan was not caudal enough, as well as in the SSCM of one patient with lymph node metastasis which infiltrated a large part of the upper SCM.
The intensities of the T1W signal post-RT compared to pre-RT for the PCs and SCMs are detailed in Table 1. The changes in the post vs. pre–RT T1W intensities for all PCs did not reach statistical significance (p=0.06). Visual examination of the relative changes in T1W signal intensities from pre-RT to post–RT revealed that at dose levels <50 Gy, almost all PC muscles had changes confined to a narrow band of ± 0.2, while some muscles receiving > 50 Gy had a substantial decrease of T1W signal intensity (prolongation of T1 relaxation time) after therapy (Fig 1 A). The decrease in T1W intensity in PCs receiving > 50 Gy was significant (p=0.03) (Table 1) and was similar in each of the three constrictors (UPC, MPC, or IPC) receiving >50 Gy. No significant changes in the post- vs pre-RT T1W intensities were noted in muscles which had received < 50 Gy (p=0.5) (Table 1). Similar findings were noted in the T1W signal intensity differences from pre- to post-therapy in the SCMs, with changes in signal confined to ± 0.2 in muscles receiving <50 Gy, and markedly reduced intensities in some of the muscles receiving ≥ 50 Gy (Fig 1B). Similar to the PCs, there were no significant changes in post-RT T1W signal intensities compared to pre RT in the SCMs which had received < 50 Gy (p=0.5), compared with a significant decrease in intensity in the SCMs which had received >50 Gy (P=0.003) (Table 1).
Table 1. T1W Intensities in PC and SCM pre- and post-Therapy.
| Muscles | Average mean dose | T1W Intensity: Mean±SD | p | ||
|---|---|---|---|---|---|
| PC | Pre-therapy | Post-therapy | |||
| All | 52±18 | 0.87±0.15 | 0.80±0.19 | 0.06 | |
| Received mean dose <50Gy | 28±13 | 0.85±0.12 | 0.86±0.16 | >0.5 | |
| Received mean dose >50 Gy | 63±7 | 0.88±0.16 | 0.77±0.20 | 0.03 | |
| SCM | |||||
| All | 59+17 | 0.87±0.10 | 0.78±0.21 | 0.005 | |
| Received mean dose <50Gy | 28+15 | 0.76±0.13 | 0.75±0.16 | >0.5 | |
| Received mean dose >50Gy | 66+6 | 0.89±0.14 | 0.79±0.18 | 0.003 | |
Fig 1.

Differences in the T1-weighted signals from pre- to 3 months post-therapy vs. mean doses to the muscles. 1A: pharyngeal constrictors (PCs), 1B: sternocleidomastoid muscles (SCMs).
The T2W signal intensities before and after therapy in the PCs and SCMs are demonstrated in Fig 2 and detailed in Table 2. A significant increase in signal intensity throughout the dose range was noted for the PCs (p=0.001). The increase was linearly correlated with the dose (R2=0.34, p=0.01) (Fig 3A). In the SCMs, a modest increase in T2 signal intensity was noted for most muscles after therapy. This modest increase was not correlated with the mean muscle doses (Fig 3B). The increase of T2 signal intensity post-therapy in the PCs was on average more than double the increase in the T2 signal in the SCMs (p<0.001) (Table 2). The differences between the PCs and SCMs in the effects of therapy on the T2 signal intensities were even higher in muscles receiving high doses: The T2 signal in PCs receiving >50 Gy increased after therapy by an average of 200%, compared with an average increase of T2 signal of 50% in SCMs receiving >50 Gy (Table 2).
Fig 2.
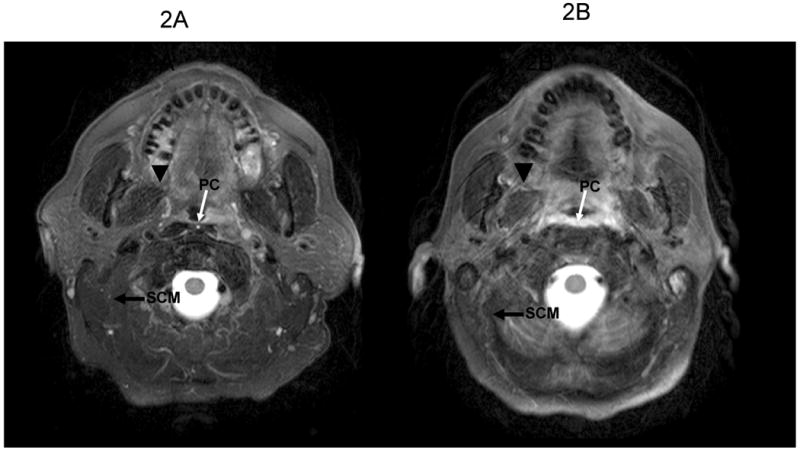
An MRI cut of a T2-weighted image. 1A: pre-RT. 1B: 3 months post-RT. Note the increase of the width and signal of the pharyngeal constrictor (PC) compared to the mild differences in T2 signal and slightly reduced widths of the ipsilateral sternocleidomastoid (SCM) and pterygoid (arrowhead) muscles, which received high doses.
Table 2. T2W Intensities in PCs and SCMs pre- and post-Therapy.
| Muscles | Average mean dose | T2W Intensity: Mean±SD | p | ||
|---|---|---|---|---|---|
| PCs | Pre-therapy | Post-therapy | |||
| All | 51±18 | 0.62±0.5 | 1.14±0.9 | 0.001 | |
| Received mean dose <50Gy | 27±12 | 0.42±0.07 | 0.60±0.18 | 0.01 | |
| Received mean dose >50 Gy | 62±7 | 0.71±0.57 | 1.38±1.00 | 0.001 | |
| SCM | |||||
| All | 60±16 | 0.37±0.30 | 0.58±0.48 | 0.001 | |
| Received mean dose <50Gy | 25±14 | 0.18±0.04 | 0.42±0.22 | 0.07 | |
| Received mean dose >50Gy | 66±6 | 0.40±0.31 | 0.61±0.51 | 0.004 | |
Fig 3.

Differences in the T2-weighted signals from pre- to 3 months post-therapy vs. mean doses to the muscles. 1A: pharyngeal constrictors (PCs), 1B: sternocleidomastoid muscles (SCMs).
Changes from pre- to post-therapy in PC thickness are demonstrated in Fig 2 and detailed in Table 3 and Fig 4A. There was a significant increase in thickness of almost all PCs (p=0.001). The increase in thickness was confined to ≤100% in muscles receiving <50 Gy, and increased even further in muscles receiving >50 Gy, where an increase of >100% was noted in the thickness of half the number of muscles (Fig 4A). The difference in the increase in thickness between PCs receiving < 50 Gy (average increase 66%) and PCs receiving >50 Gy (average increase 118%) was significant (p=0.02).
Table 3. Muscle thickness pre- and post-therapy.
| Muscles | Average thickness (mm): Mean±SD | p | ||
|---|---|---|---|---|
| PCs | Pre-therapy | Post-therapy | ||
| All | 2.9±0.9 | 5.4±1.5 | 0.001 | |
| Received Mean dose <50Gy | 3.3±1.0 | 5.3±1.7 | 0.001 | |
| Received Mean dose >50 Gy | 2.7±0.8 | 5.7±1.4 | 0.001 | |
| SCMs | ||||
| All | 11.4±3.5 | 10.5±3.7 | 0.002 | |
| Received mean dose <50Gy | 13.5±3.2 | 12.9±3.6 | 0.2 | |
| Received Mean dose >50Gy | 11.0±3.4 | 10.0±3.6 | 0.005 | |
Fig 4.

Percent changes in muscle thickness from pre- to 3 months post-therapy vs. mean doses to the muscles. 1A: pharyngeal constrictors (PCs), 1B: sternocleidomastoid muscles (SCMs).
The changes in the thickness of the SCMs from pre-therapy to post therapy are detailed in Table 3 and Fig 4b. In contrast to the PCs, which thickened after therapy, there was a significant reduction in the thickness of the SCMs (p=0.002). This decrease in thickness was dose dependent: All the muscles receiving <50 Gy had a relative change of ≤10% (p=0.2), while 39% of the muscles receiving >50 Gy had a >10% decrease in thickness, and the thickness reduction in all SCMs receiving >50 Gy was statistically significant (p=0.005). From pre-RT to 3 months post-RT, a mean patient weight loss of 13% (SD 5%) was noted. The correlation between weight loss and loss of thickness of the SCMs was not statistically significant (p=0.1), suggesting that the reduced thickness of the SCMs was due to therapy rather than to patients' weight loss.
The changes from pre- to post-therapy in T1W or T2W signal intensities, and in thickness, and their relations to the mean doses, were similar among the individual PCs (SPC, MPC, and IPC) and no qualitative differences were noted among these segments (data not shown).
At the time of the three month post-RT MRI, two patients were gastric-tube dependent, two patients needed liquid food supplements, and eight patients had no or mild dysphagia. The PCs in the two patients who were gastric tube dependent received mean doses >60 Gy (mean PC doses were 66 Gy and 71 Gy in these two patients). T1W signal intensities 3 months after RT in the PCs in these patients had a large extent of decrease compared with the pre-RT intensities (0.28 and 0.34), and the increase in T2 signal intensities were 0.57 and 0.96, both above the average group increase of 0.52. The increase in PC thickness in these two patients following therapy was 91% and 178%, both were above the group mean (86% increase in thickness).
Discussion
The results of this MRI-based study shed light on both the nature of the damage of the PCs after chemo- RT, and on its pathophysiology. We have demonstrated that the anatomical changes in the PCs include T1 and T2 elongation and increased thickness, and that most of these anatomical changes seem to have a threshold at 50 Gy, with muscles receiving lower doses having only minor radiological changes. While the SCMs demonstrated T1 prolongation which was similar to that observed in the PCs, their thickness was reduced after receiving >50 Gy, an opposite direction than the PCs, and their increased T2 signal after RT was modest in comparison to the PCs. What are the reasons for these differences, and what are their clinical implications?
Tissue edema causes hyperintensity on T2-weighted MRI and to a less extent hypointensity on T1-weighted ones, while T1-weighted sequences are mostly useful for depicting disrupted muscle architecture which is not related to edema, like dystrophies, fibrosis, and fatty degeneration [15]. These properties can be used to explain the different effects of therapy on the different muscles and their MRI sequences. Muscle irradiation causes two main pathologies: 1) inflammation and edema, and 2) fibrosis, cell or mitochondrial necrosis, and denervation [16-19]. Our study's results are consistent with the first main pathology, edema-like process, as the major change occurring in the in the PCs following therapy, compared with minor edema-like changes in the SMGs, in which the MRI changes were consistent with the latter pathologies. As the PCs lie beneath the mucosa, it is likely that their MRI-observed edema is secondary to acute mucositis. Acute mucositis is characterized by exudates of inflammatory cells and cytokines (20), which can easily infiltrate the underlying PCs and lead to the dose-dependent thickening of the PCs and increase in T2 signal intensity observed in this study. Thus, acute mucositis, which is typically transient and recovers within few weeks after therapy, seem to have caused longer-term edema and inflammatory changes in the sub-mucosal PCs.
Similar processes likely take place also in the glottic and supraglottic larynx (GSL), whose intrinsic muscles lie in close proximity to the mucosa. The GSL undergoes thickening after chemo-RT (2), and like the PCs, its RT doses have been correlated with dysphagia and aspiration [3, 7, 9]. The consequential effect of severe acute mucositis on late mucosal ulceration has been proposed by Peters et al [21]. More recently, this concept has been expanded to include “bystander effect” of late reactive phenomena occurring in response to injury in other tissue [22]. Our study supports this postulation, demonstrating a likely late, consequential effect of acute mucositis on the submucosal PCs. Supporting this postulation is also a recent study by Dornfeld et al, who have recently reported increased FDG-PET uptake in the larynx and oropharynx after chemo-RT, which correlated with dysphagia [23].
In contrast to the PCs, the SCMs, which do not lie near the mucosa, demonstrated MRI changes characteristic of the direct effects of chemo-RT: slight edema (manifested in modest increase of T2), fibrosis, and reduced thickness. Fig 2 demonstrates a striking difference in the post-therapy edema-related T2 signal in the PCs compared with the SCMs and other muscles like the pterygoids. Parts of these muscles had received high doses, however, they demonstrated only subtle changes in their T2 signal. These muscles were likely affected by RT in a mechanism in which inflammation was not the dominant process, and in which pure radiation injury has little or no inflammatory exudates (18). Cell necrosis and vascular and mitochondrial damage have been observed early after RT in rodent and dog muscles [16-17]. These effects explain the slight muscle parenchymal edema detected by prolonged T1 and modestly increased T2 sequences observed in our study, and the reduced muscle thickness and volume, which have been reported by others following muscle irradiation [24-26]. One of the processes which may explain some of these changes is muscle denervation, characterized by initial high T2 signal intensity and normal intensity on T1-weighted images in the acute phase, followed with muscle atrophy and fatty infiltration causing high signal on T1 and muscle volume loss (27). The changes in the PCs or SCMs three months after therapy did not match these characteristics, however, whether denervation plays some part in the effect of radiation on these muscles cannot be excluded.
The differences between the MRI-based changes in the PCs vs the SCMs suggest that the inflammatory processes associated with acute mucositis are major factors causing late anatomical changes and dysfunction of the submucosal PCs. These considerations highlight the need to both reduce PC doses as well as reduce the severity of acute mucositis, in order to improve chemo-RT related dysphagia. Reducing the severity of acute mucositis may be achieved by mucosal protectants and by radiation sensitizers targeting cancer in preference to the mucosa. Efforts to identify effective agents fulfilling these goals are currently being made by many groups.
Few previous CT-based studies evaluated the change in thickness of the PCs following RT or chemo-RT [2, 28]. Thickening and edema of the pharyngeal wall was reported in an MRI study of Nomayr et al, who found significant thickening in all patients 6-24 weeks after a dose of 70 Gy [11]. To the best of our knowledge, our study is the first which has examined detailed dose-response relationships for PC thickening and MRI signal changes.
Recent prospective [3-6, 9] and retrospective[7-8] studies of the relationships between the PCs and/or laryngeal doses and dysphagia used a variety of endpoints, including objective swallowing measures, observer rated dysphagia, or patient-reported questionnaires. These studies demonstrated a relatively narrow range of mean doses to these structures, between 45-60 Gy, beyond which significantly higher rates of dysphagia were observed. Our findings of significantly worsening MRI-based measures in PCs receiving mean doses >50 Gy provides a validation, using anatomical damage dose-response relationships, to the clinical studies of dysphagia. Thus, the dose-response relationships for RT on both the anatomical changes and the functional effects on the PCs seem to be similar. Some of the studies cited above reported different statistical significances for different PCs, some reporting that the doses to the SPCs were most significant [3, 5] and others reporting that the doses to the MPCs or IPCs may be more significant [7, 8]. In the current study we have not observed any qualitative differences between the dose-effect relationships of the SPCs, MPCs, or IPCs, suggesting that the dose-effect relationships for their structural changes after chemo-RT are similar, and that the different dosimetric effects found in the clinical studies of dysphagia are likely related to different functions of each PC in the swallowing process. It is also likely that different patient populations receiving different doses to the various PCs will demonstrate differences in the “importance” of the various PCs in dose-response studies of clinical dysphagia.
Our results suggest an association between severe dysphagia and MRI changes, as the two patients who were feeding-tube dependent at 3 months had larger changes in most MRI measures than the average changes in the whole patient group. Larger patient numbers and longer follow-up are required to validate the findings of this pilot study.
In conclusion, we have demonstrated thickening and hypointensity on T1-weighted images, and hyperintensity on T2 weighted images, in the PCs following chemo-RT of HN cancer, which were most prominent in muscles receiving a mean dose > 50 Gy. These findings contrasted with thinning of the SCMs receiving high doses, as well as significantly less changes in the T2-weighted signal in the SCMs. These differences support acute mucositis and resulting tissue inflammation and edema as the likely, consequential cause of the late dysfunction of the PCs, which lie close to the mucosa. Therefore, in addition to reducing the doses to the PCs whenever possible, reducing the severity of acute mucositis should be a major goal in the efforts to reduce longer-term dysphagia. Taking into account the small number of patients in this study, these results need to be confirmed by others.
Acknowledgments
Supported by NIH grant PO1 CA59827
Footnotes
Presented in part at the 50th Annual Meeting of ASTRO, Boston, MA, Sep 21-25 2008.
Conflict of interest: None
Publisher's Disclaimer: This is a PDF file of an unedited manuscript that has been accepted for publication. As a service to our customers we are providing this early version of the manuscript. The manuscript will undergo copyediting, typesetting, and review of the resulting proof before it is published in its final citable form. Please note that during the production process errors may be discovered which could affect the content, and all legal disclaimers that apply to the journal pertain.
References
- 1.Rosenthal D, Lewin JS, Eisbruch A. Prevention and treatment of dysphagia and aspiration after chemoradiation for head and neck cancer. J Clin Oncol. 2006;24(17):2636–43. doi: 10.1200/JCO.2006.06.0079. [DOI] [PubMed] [Google Scholar]
- 2.Eisbruch A, Schwartz M, Rasch C, et al. Dysphagia and aspiration after chemoradiotherapy for head-and-neck cancer: Which anatomic structures are affected and can they be spared by IMRT. Int J Radiat Oncol Biol Phys. 2004;60:1425–1439. doi: 10.1016/j.ijrobp.2004.05.050. [DOI] [PubMed] [Google Scholar]
- 3.Feng FY, Kim HM, Lyden TH, et al. Intensity-modulated radiotherapy of head and neck cancer aiming to reduce dysphagia: early dose-effect relationships for the swallowing structures. Int J Radiat Onco Biol Phys. 2007;68:1289–1298. doi: 10.1016/j.ijrobp.2007.02.049. [DOI] [PubMed] [Google Scholar]
- 4.Dornfeld K, Simmons JR, Karnell L, et al. Radiation doses to structures within and adjacent to the larynx are correlated with long-term diet- and speech-related quality of life. Int J Radiat Oncol Biol Phys. 2007;68:750–757. doi: 10.1016/j.ijrobp.2007.01.047. [DOI] [PubMed] [Google Scholar]
- 5.Levandag PC, Teguh DN, Voet P, et al. Dysphagia disorders in patients with cancer of the oropharynx are significantly affected by the radiation therapy dose to the superior and middle constrictor muscle: a dose–effect relationship. Radiother Oncol. 2007;85:64–73. doi: 10.1016/j.radonc.2007.07.009. [DOI] [PubMed] [Google Scholar]
- 6.Werbrouck J, De Ruyck K, Duprez F, et al. Acute normal tissue reactions in head aned neck cancer patients treated with IMRT: Influence of dose and association with genetic polymorphisms in DNA DSB repair genes. Int J Rad Onc Biol Phys. 2009;73:1187–1195. doi: 10.1016/j.ijrobp.2008.08.073. [DOI] [PubMed] [Google Scholar]
- 7.Caglar HB, Allen AM, Othus M, et al. Dose to the larynx predicts for swallowing complications following IMRT and chemotherapy. Int J Radiat Oncol Bio Phys. 2008;72:1110–8. doi: 10.1016/j.ijrobp.2008.02.048. [DOI] [PubMed] [Google Scholar]
- 8.Langendijk JA, Doornaert P, Rietveld DH, et al. A predictive model for swallowing dysfunction after curative radiotherapy in head and neck cancer. Radiother Oncol. 2009;90:189–90. doi: 10.1016/j.radonc.2008.12.017. [DOI] [PubMed] [Google Scholar]
- 9.Jensen K, Lambertsen K, Grau C. Late swallowing dysfunction and dysphagia after radiotherapy for pharynx cancer: frequency, intensity, and correlation with dose and volume parameters. Radiother Oncol. 2007;85:74–82. doi: 10.1016/j.radonc.2007.06.004. [DOI] [PubMed] [Google Scholar]
- 10.Reimers CD, Finkenstaedt M. Muscle imaging in inflammatory myopathies. Curr Opin Rheumatol. 1997;4:475. doi: 10.1097/00002281-199711000-00002. [DOI] [PubMed] [Google Scholar]
- 11.Nömayr A, Lell M, Sweeney R, Bautz W, Lukas P. MRI appearance of radiation-induced changes of normal neck tissues. Eur Radiol. 2001;11:1807–17. doi: 10.1007/s003300000728. [DOI] [PubMed] [Google Scholar]
- 12.Fleckenstein J, Chason D. Skeletal muscle. In: Edelman Robert R, Hesselink John R., editors. Clinical Magnetic Resonance Imaging. 3. Saunders W B CO; 2005. pp. 1057–1077. [Google Scholar]
- 13.Standring S. Gray's Anatomy: The Anatomical Basis of Medicine & Surgery. 39th. Churchill Livingstone; 2004. [Google Scholar]
- 14.Kessler ML. Image registration and data fusion in radiation therapy. Br J Radiol. 2006;79:S99–108. doi: 10.1259/bjr/70617164. [DOI] [PubMed] [Google Scholar]
- 15.Lamminen AE, Tanttu JI, Sepponen RE, et al. Magnetic resonance of diseased skeletal muscle: combined T1 measurement and chemical shift imaging. Br J radiol. 1990;63:591–9. doi: 10.1259/0007-1285-63-752-591. [DOI] [PubMed] [Google Scholar]
- 16.Hsu H, Chai CY, Lee MS. Radiation-Induced Muscle Damage in Rats after Fractionated High-Dose Irradiation Radiation Research. 1998;149:482–486. [PubMed] [Google Scholar]
- 17.Gillette EL, Mahler PA, et al. Late radiation injury to muscle and peripheral nerves. Int J Radiat Oncol Biol Phys. 1995;31:1309–1318. doi: 10.1016/0360-3016(94)00422-H. [DOI] [PubMed] [Google Scholar]
- 18.Fajardo LP. Radiation Pathology. 2nd. Oxford Press; 2001. [Google Scholar]
- 19.Khan MY. Radiation-induced changes in skeletal muscle: An electron microscopy study. J Neuropathol Exp Neurol. 1974;33:42–57. doi: 10.1097/00005072-197401000-00004. [DOI] [PubMed] [Google Scholar]
- 20.Sonis ST. The pathobiology of mucositis. Nat Rev Cancer. 2004;4:277–284. doi: 10.1038/nrc1318. [DOI] [PubMed] [Google Scholar]
- 21.Peters LJ, Ang KK, Thames HD. Accelerated fractionation in the radiation treatment of head and neck cancer. Acta Oncol. 1988;27:185–194. doi: 10.3109/02841868809090339. [DOI] [PubMed] [Google Scholar]
- 22.Denham JW, Hauer-Jensen M, Peters LJ. Is it time for a new formalism to categorize normal tissue radiation injury? Int J Rad Onc Biol Phys. 2001;50:1105–1106. doi: 10.1016/s0360-3016(01)01556-5. [DOI] [PubMed] [Google Scholar]
- 23.Dornfeld K, Hopkins S, Simmons J, et al. Post treatment FDG-PET uptake in the supraglottic and glottic larynx correlates with decreased quality of life after chemoradiotherapy. Int J Radiat Oncol Biol Phys. 2008;71:386–92. doi: 10.1016/j.ijrobp.2007.09.052. [DOI] [PMC free article] [PubMed] [Google Scholar]
- 24.Ariji Y, Fuwa N, Tachibana N. Denervation atrophy of the masticatory muscles in a patient with nasopharyngeal cancer: MR examinations before and after radiotherapy Dentomaxillofacial Radiology. 2002;31:204–208. doi: 10.1038/sj/dmfr/4600691. [DOI] [PubMed] [Google Scholar]
- 25.Shamley DR, Srinanaganathan R, Rosamund W, et al. Changes in shoulder muscle size and activity following treatment for breast cancer. Breast Cancer Res Treat. 2007;106:19–27. doi: 10.1007/s10549-006-9466-7. [DOI] [PubMed] [Google Scholar]
- 26.Nichol AM, Smith SL, Dyachova Y, et al. Quantification of masticatory muscle atrophy after high-dose radiotherapy. Int J Rad Onc Biol Phys. 2003;56:1170–1179. doi: 10.1016/s0360-3016(03)00118-4. [DOI] [PubMed] [Google Scholar]
- 27.Kamath S, Venkatanarasimha N, Walsh MA, Hughes PM. MRI appearance of muscle denervation. Skeletal Radiol. 2008;37:397–404. doi: 10.1007/s00256-007-0409-0. [DOI] [PubMed] [Google Scholar]
- 28.Mukherji SK, Mancusso A, Kotzur IM, et al. Radiographic appearance of the irradiated larynx. Part I. Expected changes. Radiology. 1994;193:149–154. doi: 10.1148/radiology.193.1.8090882. [DOI] [PubMed] [Google Scholar]