Abstract
Cuprous and cupric complexes with the new imidazolyl containing tripodal tetradentate ligands {LMIm: (1H-imidazol-4-yl)-N,N-bis((pyridin-2-yl)methyl)methanamine, LEIm: 2-(1H-imidazol-4-yl)-N,N-bis((pyridin-2-yl)methyl)ethanamine} have been investigated to probe differences in their chemistry, especially in copper(I)-dioxygen chemistry, compared to that already known for the pyridyl analogue TMPA, tris(2-pyridyl)methyl)amine. IR stretching frequencies obtained from carbon monoxide adducts of [(LMIm)CuI]+ (1a) and [(LEIm)CuI]+ (2a) show that the imidazolyl donor is stronger than its pyridyl analog. Electrochemical data suggest differences in the binding constant of CuII to LEIm compared to TMPA and LMIm, reflecting geometric changes. Oxygenation of [(LMIm)CuI]+ (1a) in 2-methyltetrahydrofuran (MeTHF) solvent at −128 °C leads to an intensely purple colored species with a UV-vis spectrum characteristic of an end-on bound peroxodicopper(II) complex [{(LMIm)CuII}2(μ-1,2-O22−)]2+ (1bP) {λmax = 528 nm}, very similar to the previously well characterized complex [{(TMPA)CuII}2(μ-1,2-O22−)]2+ {λmax = 520 nm (ε = 12,000 M−1cm−1), in MeTHF; resonance Raman (rR) spectroscopy: ν(O-O) = 832 (Δ(18O2) = −44) cm−1}. In the low-temperature oxygenation of 2a, benchtop (−128 °C) and stopped-flow (−90 °C) experiments reveal the formation of an initial superoxo-Cu(II) species [(LEIm)CuII(O2·−)]+ (2bS), λmax = 431 nm in THF). This converts to the low-temperature stable peroxo complex [{(LEIm)CuII}2(μ-1,2-O22−)]2+ (2bP) {rR spectroscopy: ν(O-O) = 822 (Δ(18O2) = −46) cm−1}. Complex 2bP possess distinctly reduced Cu-O and O-O stretching frequencies and a red-shifted UV-vis feature {to λmax = 535 nm (ε = 11,000 M−1cm−1)} compared to the TMPA analogue due to a distortion from trigonal bipyramidal (TBP) to a square pyramidal ligand field. This distortion is supported by the structural characterization of related ligand-copper(II) complexes: A stable tetramer cluster complex [(μ2-LEIm−)4(CuII)4]4+, obtained from thermal decomposition of 2bP (with formation of H2O2), also exhibits a distorted square pyramidal Cu(II) ion geometry as does the copper(II) complex [(LEIm)CuII(CH3CN)]2+ (2c), characterized by X-ray crystallography and solution EPR spectroscopy.
Synopsis
Copper complexes possessing related imidazolyl containing tripodal tetradentate ligands have been studied with respect to their LCu(I), LCu(I)-CO and LCu(I)/O2 chemistries. Oxygenation of the LCu(I) complexes leads to peroxo-dicopper(II) complexes [{(L)CuII}2(μ-1,2-O22−)]2+. As deduced from UV-vis and resonance Raman spectroscopies, these are very similar in structure to [{(TMPA)CuII}2(μ-1,2-O22−)]2+ {TMPA - tris(2-pyridylmethyl)amine}. The influence of the one imdazolyl donor is discussed with respect to peroxo complex UV-vis bathochromic shifts, ν(O-O) lowering and copper(II) coordination geometry.
Introduction
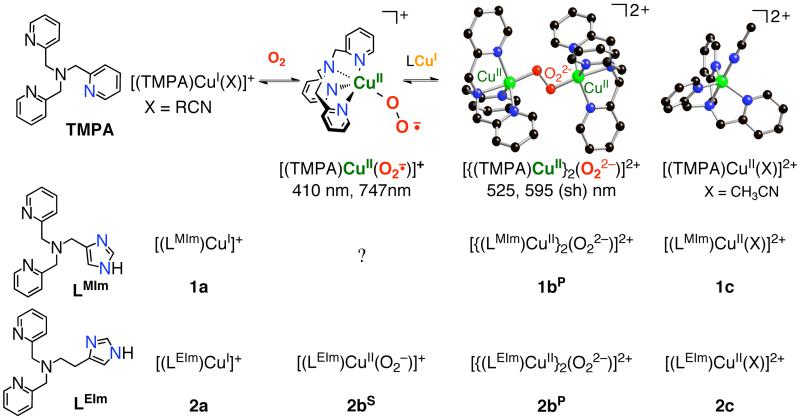
In this report, we present detailed studies of the copper(I)-dioxygen reactivity of new complexes containing tripodal tetradentate ligands LMIm and LEIm (Scheme 1), possessing one imidazolyl group. We compare and contrast the reactivity and physical properties of the resulting dioxygen adducts with those known with the previously well-studied close analogue ligand TMPA (tris(2-pyridylmethyl)amine).1-7 The study of copper-dioxygen adduct formation, structures, physical properties and subsequent reactivity is an area of active research, since the acquisition of fundamental insights into this subject is of considerable chemical and bioinorganic interest.1-3,8
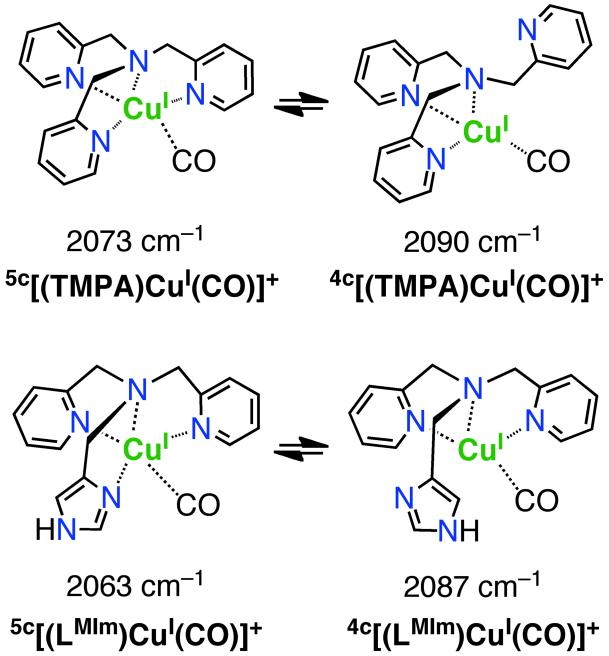
Scheme 1.
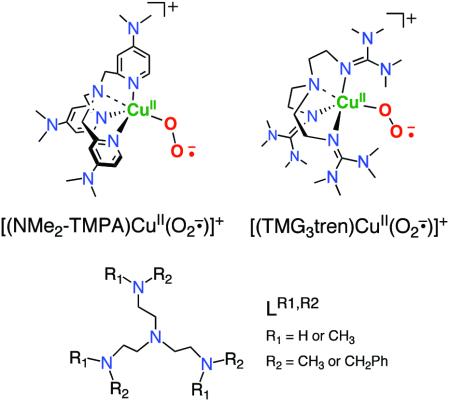
Detailed kinetic-mechanistic and structural studies show that the μ-1,2-end-on peroxo dicopper(II) complex [{(TMPA)CuII}2(O22−)]2+ (Scheme 1) forms via a reversible reaction between an initially formed CuII-superoxo intermediate (λmax = 410 nm, also formed reversibly) with a second TMPA-cuprous complex (Scheme 1).7,9,10 The intensely purple colored [{(TMPA)CuII}2(O22−)]2+ shows absorption features [λmax nm (ε cm−1M−1)] at 440 (4,000), 525 (11,500), and 590 (7,600) in EtCN at −80 °C, which have been assigned as ligand(peroxide)-to-metal charge-transfer (LMCT) bands.6 The formation of an end-on bound dioxygen adduct (as a peroxide species) was confirmed structurally (Scheme 1), with each copper(II) ion in a trigonal bipyramidal coordination environment with Cu...Cu = 4.359 Å and O-O = 1.432 Å, the latter value typical for peroxides.4 The peroxo-dicopper(II) formulation was further confirmed by resonance Raman (rR) spectroscopy, ν(O-O) = 832 (Δ(18O2) = −44) cm−1.6 In the context of this discussion of the superoxo-copper(II) or peroxodicopper(II) complexes with TMPA as a ligand, there have been notable relevant recent advances: (i) The copper(I) carbonyl complex of a TMPA analogue with Me2N substituents at the 4-pyridyl position reacts to form a stable −80 °C solution complex [(Me2N-TMPA)CuII(O2·−)]+ species, spectroscopically proven to possess an end-on superoxide binding (diagram);11 (ii) Strikingly, Schindler and coworkers12 crystallized and structurally characterized a related complex [(TMG3tren)CuII(O2·−)]+ (diagram). (iii) With all alkylamino containing N4 tripodal tetradentate ligands (LR1,R2 in diagram), Suzuki and coworkers13 spectroscopically detailed related superoxo-CuII complexes and crystallographically described a μ-1,2-peroxodicopper(II) complex analogue of [{(TMPA)CuII}2(O22−)]2+.
We and others have extensively employed pyridyl donors as part of tridentate or tetradentate chelating ligands for copper(I), for their synthetic ease and behavior towards promoting copper(I)/dioxygen reactivity of considerable interest.1-3,8,14 Here, our choice of ligands LMIm and LEIm{LMIm; (1H-imidazol-4-yl)-N,N-bis((pyridin-2-yl)methyl)methanamine, LEIm; 2-(1H-imidazol-4-yl)-N,N-bis((pyridin-2-yl)methyl)ethanamine (Scheme 1)} derives from interest in studying an imidazolyl moiety as copper ion ligand which more closely resembles protein histidine ligand groups (as linked in the 4(5)-position). In fact, imidazolyl containing ligands have been studied in copper coordination chemistry.15-24 A few examples exist where LCuI/O2 studies were carried out,25-29 but they have generally not afforded new insights with respect to characterization of copper-dioxygen adducts.
In the present study employing LMIm and LEIm, we have synthesized new copper(I) complexes (1a and 2a in Scheme 1), spectroscopically characterized peroxo-dicopper(II) complexes (1bP and 2bP in Scheme 1) and have detected and partially characterized a superoxo-copper(II) complex with LEIm (2bS in Scheme 1). Stable copper(II) complexes (1c and 2c in Scheme 1) have also been synthesized and characterized to probe the geometric effect of the new ligands on the copper(II) centers. Insights obtained from these structures aid the interpretation of spectroscopic variations observed for the peroxo-dicopper(II) species, as detailed below.
Experimental Section
General Considerations and Instrumentation
All reagents and solvents used for this work were commercial products and are of reagent quality unless otherwise stated. Acetonitrile (CH3CN), dichloromethane (CH2Cl2), diethylether (Et2O), methanol (CH3OH) and tetrahydrofuran (THF) were purified and dried by passing through a double alumina column solvent purification system by Innovative Technologies, Inc. Anhydrous 2-methyltetrahydrofuran (MeTHF; packaged under nitrogen in Sure/Seal™ bottles, 99+%) was purchased from Sigma-Aldrich, Inc. Deoxygenation of these solvents was achieved by bubbling Ar for 30 min and/or carrying out three freeze/pump/thaw cycles. Air-sensitive compounds were handled under an Ar atmosphere using standard Schlenk techniques or within a MBraun Labmaster 130 inert-atmosphere (N2 atmosphere; < 1 ppm O2, < 1 ppm H2O) glove-box. Molecular oxygen (Airgas Inc., Radnor, PA) was dried by passing it through a laboratory gas drying unit (W. A. Hammond Drierite Co., Xenia, Ohio) and introduced to reaction solutions by bubbling through an 18-gauge, 24-inch-long stainless steel syringe needle. [CuI(CH3CN)4]ClO4 and [CuI(CH3CN)4]B(C6F5)4 were prepared by literature procedures.30,31 KB(C6F5)4 or LiB(C6F5)4 were purchased from BOULDER SCIENTIFIC Company.
Warning: While we have experienced no problems in working with perchlorate compounds, they are potentially explosive, and care must be taken not to work with large quantities.
1H-NMR and 13C-NMR spectra were measured on a Varian 400 MHz or Bruker 400 MHz spectrometer and chemical shifts are reported in ppm (δ) downfield from an internal TMS (Me4Si) reference and the residual solvent proton peak. Infrared Spectra were recorded on a Mattson Instruments 4030 Galaxy Series FT-IR spectrometer. Measuring the solution IR spectra of carbonyl adducts (as a solution in THF) were recorded using standard solution IR cells. Air sensitive cuprous THF solutions were prepared in a glove box (N2 filled, MBraun) and then removed using 20 ml vials sealed with a 14/20 rubber septum. Carbon monoxide gas (Airgas Inc., Radnor, PA) was introduced to the corresponding solution via bubbling for 20–30 s through an 18-gauge, 24-inch-long stainless steel syringe needle. The resulting solution was transferred to a solution IR cell by the gas-tight syringe under the CO atmosphere. Elemental Analyses were performed by Desert Analytics, Tucson, AZ for air-sensitive samples or by Quantitative Technologies Inc. (QTI), Whitehouse, NJ for others. Mass Spectrometry was conducted at the mass spectrometry facility either at the Johns Hopkins University or at the Ohio State University. Chemical Ionization (CI) and fast atomic bombardment (FAB) mass spectra were acquired at the Johns Hopkins University facility using a VG70S double focusing magnetic sector mass spectrometer (VG Analytical, Manchester, UK, now Micromass/Wasters) equipped with a Xe gas FAB gun (8 kV @ 1.2 mA) and an off-axis electron multiplier and an MSS data system (MasCom, Bremen, Germany). The resolution of the instrument was set at 10,000 (100 ppm peak width). Samples were mixed with m-nitrobenzyl-alcohol matrix deposited on the target of a direct insertion probe for introduction into the source. Nominal mass scan spectra were acquired with a mass scan range of 10–950 amu using a magnet scan rate of 25 sec/dec. For accurate mass measurements, a narrower mass scan range was employed, with the matrix containing 10% PEG mass calibrant. ESI mass spectra (Johns Hopkins University facility) were acquired using a Finnigan LCQDeca ion-trap mass spectrometer equipped with an electrospray ionization source (Thermo Finnigan, San Jose, CA). Samples were dissolved in CH3OH or CH3CN and introduced into the instrument at a rate of λl/min using a syringe pump via a silica capillary line. The heated capillary temperature was 250 °C and the spray voltage was 5kV. High resolution electrospray ionization (ESI) mass spectrometry analyses were performed at the Ohio State University (MS) facility with a 3-Tesla Finnigan FTMS-2000 Fourier Transform mass spectrometer. Samples were sprayed from a commercial Analytical electrospray ionization source, and then focused into the FTMS cell using a home-built set of ion optics. Electrical conductivity measurements32,33 for the Cu(I) complexes [(TMPA)CuI(CH3CN)]+, [(LMIm)CuI]+ (1a) and [(LEIm)CuI]+ (2a) were carried out in dimethylformamide (DMF) solvent using an Accumet AR20 pH/Conductivity meter (Fisher Scientific) with Accumet Immersion-type four-cell glass conductivity probe (cell constant κ = 1.0 cm−1). Air sensitive cuprous DMF solutions (1 mM, 20 ml) were prepared in a glove box (N2 filled, MBraun) and then removed using 5 drum vials sealed with a cap and electrical tape. The data were collected from measurements with continuous strong (over the top) Ar flow. Cyclic voltammetry measurements were undertaken in CH3CN and DMF using a BAS 100B electrochemical analyzer with a glassy carbon working electrode and a platinum wire auxiliary electrode. Potentials were recorded versus a Ag/AgNO3 electrode. The voltammograms are plotted versus the Fe(cp)2+/0 potential which was measured as an external standard. Scans were run at 50–200 mV/s under an argon atmosphere using ca. 0.1M [Bu4N][PF6] as the supporting electrolyte. X-ray Crystallography was performed at the X-ray diffraction facility either at Johns Hopkins University or the University of Delaware (by the Prof. Arnold Rheingold group). A suitable green crystal of [(LMIm)CuII(CH3CN)]2+ (1c) was mounted with epoxy cement to the tip of a glass fiber. Intensity data were collected at 150(2) K with a Bruker SMART APEX CCD diffractometer with graphite-monochromated [Mo Ka radiation (λ = 0.71073 Å)]. An absorption correction was applied using the SADABS program (Sheldrick, G. M. SADABS (2.01), Bruker/Siemens Area Detector Absorption Correction Program, Bruker AXS, Madison, WI, 1998). The structure was solved using direct methods, and refined using the Bruker SHELXTL (v6.1) software package (Sheldrick, G.M. 2000). Suitable blue single crystals of [(μ2-LEIm−)4(CuII]4+ cluster, and [(LEIm)CuII(CH3CN)(−OClO3)]+ (2c·OClO3) were mounted in Paratone-N oil on the end of a glass fiber and transferred to the N2 cold stream (110K) of an Oxford Diffraction Xcalibur3 system equipped with Enhance optics [Mo Ka radiation (λ = 0.71073 Å)] and a CCD detector. The frames were integrated and a face indexed absorption correction and an inter-frame scaling correction were also applied with the Oxford Diffraction CrysAlisRED software package (CrysAlis CCD, Oxford Diffraction Ltd.,Version 1.171.27p5 beta). The structures were solved using direct methods and refined using the Bruker SHELXTL (v6.1) software package (Sheldrick, G.M. 2000). Low Temperature UV-vis Spectra were obtained with either a Cary 50 Bio spectrophotometer equipped with a fiber optic coupler (Varian) and a fiber optic dip probe (Hellma: 661.302-QX-UV-2mm-for-low-temperature) or a Hewlett-Packard model 8453 diode array spectrophotometer equipped with a custom made quartz-windowed vacuum dewar filled with methanol (−80 °C). A low temperature unit (Neslab ULT-95 low temperature circulator) is attached to the HP spectrophotometer via copper tubing. The methanol temperature within the dewar was monitored using a thermocouple probe (Omega Model 651). For the low temperature measurements with a Cary 50 Bio spectrophotometer, a hexane/N2(l) bath (−94 °C) or a pentane/N2(l) bath (−128 °C) was used and the steady temperature was monitored with the type T thermocouple thermometer (Model 650, Omega engineering, CT). Air sensitive solutions were prepared in a glove box (N2 filled, MBraun) and carried out in custom made Schlenk tubes designed for the dip probe (Chemglass: JHU-0407-271MS) or Schlenk cuvettes. The cuvette assembly consisted of a two-window quartz cuvette (2 mm path) connected, via a 12 cm glass tube, to a 14/20 female ground glass joint. In order to calculate absorptivities at low temperature in MeTHF, a solvent contraction factor was calculated from the volume changes directly measured at different temperatures (10 ml at RT vs. 8.53 ml at −128 °C).
Stopped-Flow Experiments
Rapid kinetics were followed using a Hi-Tech Scientific SF-40 variable-temperature stopped-flow unit (2-mm or 1 cm path length cell, 2.5 mL syringe) with Teflon-lined stainless steel plumbing, combined with a TIDAS-MMS-VIS 500–3 diode array spectrometer (J&M, 256 diodes, 300–1100 nm, 0.8 ms minimum sampling time) using fibre bundle light guides connected to a CLH-20 halogen lamp (ZEISS, 20W/12V). The two glass coils, containing Cu(I) and dioxygen solutions, respectively, and the mixing chamber were immersed in an ethanol bath. This bath was placed in a Dewar, which was filled with liquid nitrogen for low-temperature measurements. The ethanol bath was cooled by liquid nitrogen evaporation, and its temperature was measured by using a Pt resistance thermocouple and maintained to 0.1 K by using a temperature-controlled thyristor power unit (both Hi-Tech). The concentrations of (LEIm)Cu(I) solution used were 0.2 mM. The dioxygen concentration used was 4.0 mM. Data acquisition (up to 256 complete spectra; up to 4 different time bases) was performed by using the Kinspec program (J & M).
Resonance Raman experiments
Resonance Raman (rR) spectra were obtained using a Princeton Instruments ST-135 back-illuminated CCD detector on a Spex 1877 CP triple monochromator with 1200, 1800, and 2400 grooves/mm holographic spectrograph gratings. Excitation was provided by a Coherent I90C-K Kr+ ion laser. The spectral resolution was < 2 cm−1. Sample concentrations were approximately 3–4 mM with respect to Cu (1.5–2 mM with respect to dimer). The samples were cooled to 77 K in a quartz liquid nitrogen finger Dewar (Wilmad). Isotopic substitution was achieved by oxygenation with 18O2. X-Band Electron Paramagnetic Resonance (EPR) Spectra were recorded on a Bruker EMX CW-EPR spectrometer controlled with a Bruker ER 041 XG microwave bridge operating at X-band (~ 9 GHz). The low-temperature experiments were carried out via either a continuous-flow He(l) cryostat and ITC503 temperature controller made by Oxford Instruments, Inc., or N2(l) finger dewar.
Synthesis of Ligands
LMIm
Bis(2-pyridylmethyl)amine (2.64 g, 13.2 mmol) and glacial acetic acid (2 ml) were added to 1H-imidazole-4-carbaldehyde (1.3 g, 13.3 mmol) methanol solution (100 ml). Sodium cyanoborohydride (1.3 g, 20.7 mmol) was slowly added to the yellow methanol solution with vigorous stirring. Reaction mixture was stirred at room temperature for 24 hr under Ar. After acidified with concentrated hydrochloric acid solvent was removed using a rotary evaporator, the resulting residue was dissolved in dichloromethane and washed with a saturated sodium carbonate solution. The organic layer was separated, dried over anhydrous MgSO4, then filtered and concentrated under vacuum. The oil obtained (0.72 g, 2.45 mmol, 61%) was purified by column chromatography (Al2O3, ethylacetate: methanol (100 : 4), Rf = 0.3). 1H NMR (CDCl3): δ 11.6 (s, 1H), 8.42 (d, J = 4 Hz, 2H), 7.6 (m, 3H), 7.40 (d, J = 7.6 Hz, 2H), 7.05 (m, 2H), 6.89 (s, 1H), 3.74 (s, 4H), 3.64 (s, 2H). 13C NMR (CDCl3): δ 159.0, 148.7, 136.6, 135.1, 123.4, 122.0, 59.2, 48.5. FAB mass spectrum: m/z 280.2 (M + 1)+.
[4(5)-(2-phthalimidoethyl)]imidazole (a)
Histamine (1.6 g, 14.5 mmol) and phthalic anhydride (2.17 g, 14.7 mmol) were dissolved in ethanol (100 ml). After glacial acetic acid (20 ml) was introduced, the reaction mixture was refluxed for 4 hrs. The resulting mixture was cooled and solvent and acetic acid were removed using a rotary evaporator. Upon addition of ethanol (30 ml) to the resulting residue with vigorous stirring, a white precipitate formed. The white powder (3.3 g, 13.7 mmol, 95%) was collected by filtration, washed with cold ethanol and dried under vacuum. 1H NMR (CDCl3): δ 13.4 (s, 1H), 8.4 (m, 4H), 8.19 (s, 1H), 7.46 (s, 1H), 4.42 (t, J = 7.4 Hz, 2H), 3.47 (t, J = 7.4 Hz, 2H). 13C NMR (CDCl3): δ 168.7 (CO), 135.9 (NCN), 135.3 (Im), 134.8 (Ar), 132.6 (Ar), 123.9 (Im), 117.4 (Ph), 26.6 (CH2), 22.1 (CH2).
[4(5)-(2-phthalimidoethyl)](triphenlymethyl)imidazole (b)
Compound a (3.47 g, 14.4 mmol) and triphenylmethylchloride (4.92 g, 17.6 mmol) were dissolved in DMF (15 ml), triethylamine (2.5 ml) was introduced and the reaction mixture was stirred overnight at RT. After DMF was removed with a rotary evaporator, the resulting residue was dissolved in dichloromethane and washed with cold ethylacetate. The product oil (6.16 g, 12.7 mmol, 88%) was dried under vacuum, its purity was confirmed by TLC (Silica gel, ethylacetate:hexane (1 : 1), Rf = 0.2) and identity by NMR spectroscopy. 1H NMR (CDCl3): δ 7.77 (dd, J = 5.8, 3.2 Hz, 2H), 7.70 (dd, J = 5.6, 2.8 Hz, 2H), 7.25 (m, 10H), 7.05 (m, 6H), 6.52 (s, 1H), 3.88 (t, J = 7 Hz, 2H), 2.86 (t, J = 7.2 Hz, 2H).
Triphenylmethylhistamine (c)
Compound b (8.22 g, 17.0 mmol) and hydrazine (2.3 ml, 73 mmol) were dissolved in ethanol (100 ml) and the reaction mixture stirred overnight at RT under Ar. After the resulting residue was filtered, the solvent was removed by rotary evaporation whereupon the organic mixture was dissolved in dichloromethane and washed with 1 N sodium hydroxide. After separation, the product oil (3.74 g, 10.6 mmol, 62%) was dried over anhydrous MgSO4, filtered and concentrated under vacuum. 1H NMR (CDCl3): δ 7.3 (m, 10H), 7.1 (m, 6H), 6.58 (s, 1H), 2.96 (t, J = 6.4 Hz, 2H), 2.66 (t, J = 6.4 Hz, 2H).
Triphenylmethyl-LEIm (d)
Compound c (3.74 g, 10.6 mmol) and picolyl chloride hydrochloride (5.61 g, 34.2 mmol; previously washed with 1 N sodium hydroxide) were dissolved in dichloromethane (100 ml). After introducing triethylamine (3 ml), the reaction mixture was refluxed under Ar for 3 days. After cooling to room temperature, more (~ 20 ml) of CH2Cl2 was added and the solution was washed three times with brine. The organic layer was separated, dried over anhydrous MgSO4, then filtered and concentrated under vacuum. The product oil was obtained (5.03 g, 9.4 mmol, 88.8%) after purification by column chromatography (Al2O3, ethylacetate: methanol (100 : 2), Rf = 0.5). 1H NMR (CDCl3): δ 8.36 (dm, J = 4 Hz, 2H), 7.42 (t, J = 7.6 Hz, 2H), 7.34 (d, J = 7.6 Hz, 2H), 7.2 (m, 10H), 7.0 (m, 8H), 6.48 (s, 1H), 3.76 (s, 4H), 2.82 (t, 2H), 2.77 (t, 2H). 13C NMR (CDCl3): δ 160.2 (Py), 149.0 (Py), 142.7 (Im), 139.9 (Py), 138.3 (Im), 136.4 (Im), 129.9 (Ph), 128.1 (Ph), 128.0 (Ph), 122.8 (Ph), 121.9 (Py), 118.3 (Py), 75.2 (C), 60.6 (NCH2), 54.6 (CH2), 26.8 (CH2). FAB mass spectrum: m/z 558.3 (M + Na)+.
LEIm
Compound d (2.14 g, 4.0 mmol) was dissolved in ethanol (100 ml). After glacial acetic acid (5 % in ethanol) was introduced, the reaction mixture was refluxed for 1 hr. After ethanol was removed using a rotary evaporator, the resulting residue was dissolved in dichloromethane and washed with a saturated sodium carbonate solution. The organic layer was separated, dried over anhydrous MgSO4, then filtered and concentrated under vacuum. The oil obtained (0.72 g, 2.45 mmol, 61%) was purified by column chromatography (Al2O3, ethylacetate: methanol (100 : 4), Rf = 0.3). 1H NMR (CDCl3): δ 13 (s, 1H), 8.44 (dm, J = 4.8 Hz, 2H), 7.56 (s, 1H), 7.45 (dt, J = 7.8, 1.7 Hz, 2H), 7.0 (m, 4H), 6.66 (s, 1H), 3.76 (s, 4H), 2.77 (m, 4H). 13C NMR (CDCl3): δ 159.4, 149.0, 136.8, 134.8, 123.4, 122.4, 60.0, 54.1, 23.4. FAB mass spectrum: m/z 294.3 (M + 1)+, 316.4 (M + Na)+.
Synthesis of Cu(I) Complexes and Their Reactivity toward O2
[(LMIm)CuI]ClO4
LMIm (0.10 g, 0.37 mmol) and [CuI(CH3CN)4]ClO4 (0.12 g, 0.35 mmol) were dissolved in O2-free CH3CN (15 ml) in a 50 ml Schlenk flask and stirred for 1 hr under Ar at RT. The resulting yellow solution was filtered and transferred by cannula (with filter paper) to a 100 ml Schlenk flask. The complex was precipitated as a yellow powder upon addition of O2-free diethylether. The supernatant was decanted and the resulting yellow powder was washed two times with O2-free diethylether and dried under vacuum to give 0.13 g (0.29 mmol, 83%) of yellow powder product. 1H NMR (nitromethane-d3): δ 10.2 (s, 1H), 8.2 (s, 2H), 7.70 (s, 2H), 7.42 (s, 1H), 7.37 (s, 2H), 7.05 (s, 2H), 6.94 (s, 1H), 4.3 (m, 4H), 3.95 (d, J = 14.8 Hz, 2). ESI mass spectrum: m/z 342.31 (LCuI)+.34
[(LMIm)CuI]B(C6F5)4
In a 50 ml Schlenk flask, LMIm (0.29 g, 1.0 mmol) and [CuI(CH3CN)4]B(C6F5)4 (0.81 g, 0.93 mmol) were dissolved in O2-free THF (15 ml) and stirred for 1 hr under Ar at RT. The resulting yellow solution was filtered and transferred by cannula (with filter paper) to a 100 ml Schlenk flask. The complex precipitated as a yellow powder upon addition of O2-free heptane into the reaction mixture. The supernatant was decanted, and the resulting yellow powder (0.85 g, 0.80 mmol, 86%) was washed two times with O2-free pentane and dried under vacuum. 1H NMR (DMSO-d6): δ 12.5 (s, br, 1H), 7.5 (m, 10H), 4.05 (s, br, 6H), 3.59 (THF), 1.75 (THF), 1.2 (pentane), 0.8 (pentane).34
[(LEIm)CuI]B(C6F5)4
LEIm (0.40 g, 1.36 mmol) and [CuI(CH3CN)4]B(C6F5)4 (1.23 g, 1.4 mmol) were dissolved and stirred for 1 hr in O2-free THF (15 ml) under Ar at RT. The resulting yellow solution was filtered and transferred to a 100 ml Schlenk flask by cannula (with filter paper). The complex precipitated as a yellow powder upon addition of O2-free heptane into the reaction mixture. The supernatant was decanted, and the resulting yellow powder (1.28 g, 1.2 mmol, 88%) was washed two times with O2-free heptane and dried under vacuum. 1H NMR (DMSO-d6): δ 12.43 (s, br, 1H), 8.76 (s, 2H), 8.13 (s, 1H), 7.85 (s, 2H), 7.45 (m, 4H), 7.04 (s, 1H), 4.05 (s, br, 4H), 2.75 (s, br, 4H), 1.2 (heptane), 0.8 (heptane). Anal. Calcd. for C41H19BCuF20N5(1/3C7H16): C, 48.67; H, 2.29; N, 6.55. Found: C, 48.49; H, 2.16; N, 6.40. FAB mass spectrum: m/z 356.3 (LCuI)+.
Tetramer [(LEIm−)4(CuII)4](B(C6F5)4)4 Synthesis
The B(C6F5)4 salt of [(LEIm)CuI]+ (2a) (180 mg, 0.17 mmol) was stirred for 1 hr in THF (5 ml) under air at RT. The resulting green solution was layered with diethylether and pentane. After 1–2 days a green crystalline material was isolated. After washing this two times with pentane and vacuum drying, the yield of green crystalline product was 137 mg (0.033 mmol, 78%). UV-vis (MeCN; λmax, nm; ε, M−1cm−1): 700, 450. Anal. Calcd. for C166H76B4Cl4Cu4F80N20: C, 46.26; H, 1.78; N, 6.50. Found: C, 46.15; H, 1.58; N, 6.11. X-ray quality green crystals were obtained from the synthesis.
Detection of Hydrogen Peroxide by Ti(IV)O(SO4)
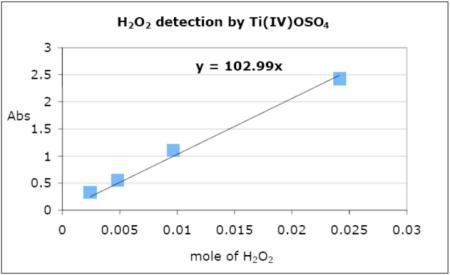
Hydrogen peroxide produced from the reaction of the peroxo [{(LEIm)CuII}2(O22−)]2+ (2bP) with [H(OEt2)2][B(C6F5)4] was determined spectrophotometrically with titanium(IV) oxysulfate.35,36 The B(C6F5)4 salt of [(LEIm)CuI]+ (2a) (70 mg, 0.066 mmol) was dissolved in O2-free THF (5 ml) in the dry-box. After bubbling O2 gas at −94 °C, the yellow solution turned to a deep blue color corresponding to an end-on peroxo species. After [H(OEt2)2][B(C6F5)4] (67 mg, 0.081 mmol) was introduced to the resulting blue solution, distilled water (10 ml) and CH2Cl2 (20 ml) were added. To the separated aqueous layer a Ti(IV)O(SO4) solution (0.1 ml; titanium(IV) oxysulfate, 15 % in sulfuric acid) was introduced. The concentration of the hydrogen peroxide was spectroscopically measured from the absorption at 408 nm (0.96), and the yield was 28 %. The calibration curve was derived from the absorption measurements of a 2.416 mM H2O2 (29.58%, VWR) stock solution. Upon addition of 0.1 ml of a Ti(IV)O(SO4) solution to 10 ml of the aqueous solution with varying concentrations of hydrogen peroxide (from stock solution: 1, 2, 4, and 10 ml; 0.00242, 0.00483, 0.00966, and 0.0242 mmol respectively), the absorption at 408 nm was measured (0.332, 0.553, 1.11, and 2.42 respectively).
* Calibration curve of the mole of hydrogen peroxide in aqueous solution with Ti(IV)O(SO4).
[H(OEt2)2][B(C6F5)4] Synthesis
[H(OEt2)2][B(C6F5)4] was prepared by the literature procedure.37 Potassium tetrakis(pentafluorophenyl)borate (2.3 g, 3.2 mmol) was dissolved in diethylether (20 ml). Hydrochloric acid in diethylether (6 ml) was introduced under Ar at −77 °C. The reaction mixture was slowly warmed and stirred at RT for 2 hrs. After filtration with dried Celite 545, the solvent was evaporated leaving ~ 6–7 ml solution. The resulting mixture was put in the freezer for 1 hr. After decanting the supernatant the colorless crystals obtained were dried under vacuum, giving 1.44 g product (54%).
Synthesis and Characterization of Cu(II) Complexes
[(LMIm)CuII(CH3CN)]2+ (1c)
LMIm (0.45 g, 1.6 mmol) and CuII(ClO4)2·6H2O (0.59 g, 1.6 mmol) were dissolved in CH3CN (15 ml) and stirred for 1 hr at room temperature. The resulting blue solution was filtered and transferred to a 100 ml Schlenk flask with a cannula (with filter paper). The solution was layered with diethylether and allowed to stand for 1 hr. After the resulting supernatant was decanted, the resulting powder was washed two times with diethylether and dried under vacuum to give 0.88 g product (1.48 mmol, 95%). UV-vis (CH3CN; λmax, nm; ε, M−1cm−1): 880, 200; 660 (shoulder), 55. Anal. Calcd. for C16H17Cl2CuN5O8·5/2H2O: C, 32.75; H, 3.78; N, 11.93. Found: C, 32.55; H, 3.23; N, 11.71. ESI mass spectrum: m/z 342.29 (LCu)+. An EPR spectrum of 1c indicates a typical trigonal bipyramidal copper environment: X-band spectrometer (ν = 9.487 GHz) in DMF/Toluene (1:1) at 4 K; gll = 1.99, All = 70 gauss; g⊥ = 2.21, A⊥ = 99 gauss (See Figure 7). X-ray quality green crystals were obtained from acetonitrile layered with diethylether.
Figure 7.
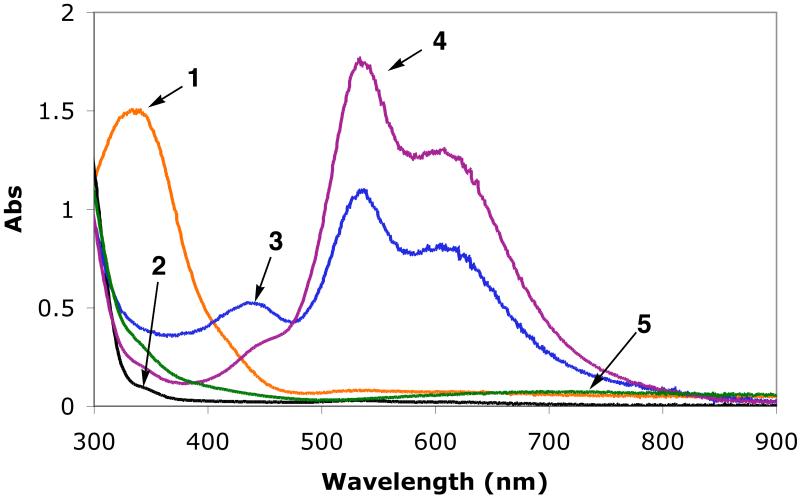
Low-temperature UV-vis spectra in MeTHF at −128 °C. Spectrum 1: 2a with absorption at 337 nm (4,100 M−1cm−1). Spectrum 2: [(LEIm)CuI(CO)]+ without excess CO. Spectrum 3: partial formation of superoxo species [(LEIm)CuII(O2·−)]+ (2bS) with absorption 440 nm, and the peroxo complex 2bP. Spectrum 4:2bP with absorption 445 nm (2,500 M−1cm−1), 535 nm (11,000 M−1cm−1), and 610 nm (8,100 M−1cm−1). Spectrum 5: Thermal decomposition product.
[(LEIm)CuII(CH3CN)]2+ (2c)
LEIm (0.50 g, 1.7 mmol) and CuII(ClO4)2·6H2O (0.63 g, 1.7 mmol) were dissolved and stirred for 1 hr in CH3CN (5 ml) at room temperature. The resulting blue solution was filtered and transferred to a 100 ml Schlenk flask by cannula (with filter paper). The solution was layered with diethyl ether. After the supernatant was decanted, the resulting powder was washed two times with diethyl ether and dried under vacuum to give 0.79 g product (1.34 mmol, 81%). UV-vis (MeCN; λmax, nm; ε, M−1cm−1): ~ 300 (shoulder), 2400; 660, 130; ~840, 110. Anal. Calcd. for C17H23Cl2CuN5O10: C, 34.50; H, 3.92; N, 11.83. Found: C, 34.88; H, 3.48; N, 11.32. ESI mass spectrum: m/z 356.35 (LCu)+. An EPR spectrum of 2c indicates a typical tetragonal copper environment: X-band spectrometer (ν = 9.488 GHz) in DMF/Toluene (1:1) at 4 K; gll = 2.26, All = 161 gauss; g⊥ = 2.06 (See Figure 7). X-ray quality green crystals were obtained from acetonitrile layered with diethylether.
Results and Discussion
Synthesis of Ligands and Copper(I) Complexes
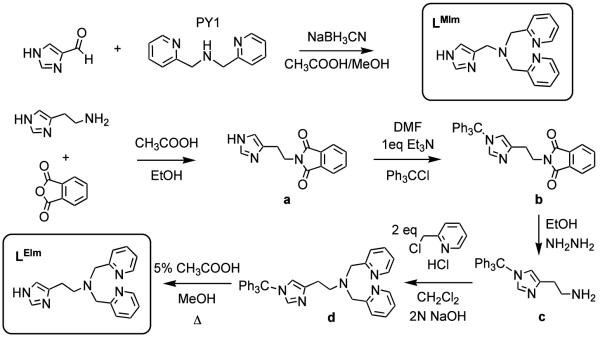
The imidazolyl containing tetradentate ligands were synthesized by standard methods. LMIm was prepared by the reductive coupling reaction of PY1 (dipicolylamine) and 1H-imidazole-4-carbaldehyde with sodium cyanoborohydride under acidic conditions, Scheme 2.38 The LEIm synthesis was more involved, but it was successfully prepared according to Scheme 2.
Scheme 2.
The copper(I) complexes were synthesized by the addition of 1 equiv of the appropriate tripodal ligand to [CuI(CH3CN)4]Y (Y= ClO4−, B(C6F5)4−)30,31 in CH3CN or THF under argon. They are both yellow air-sensitive solids. Nujol mull IR spectra reveal absorptions ascribed to the ligand N-H moiety (Experimental Section). We were not able to crystallize either [(LMIm)CuI]+ (1a) and [(LEIm)CuI]+ (2a). For ligand-copper(I) complexes with nitrogen containing tri- or tetradentate ligands, a dimeric structure may be possible; there are examples known in the solid state or in solution,9,29,39 where one N-donor of a given chelate within [{(L)CuI}2]2+ binds to the “other” copper(I) moiety. Normally in more polar or high-dielectric solvents, the dimer “breaks up” to give mononuclear complexes, e.g., [(L)CuI]+ or [(L)CuI(solvent)]+.9 Solution conductivity measurements can distinguish between a [(L)CuI]+ or dimer [{(L)CuI}2]2+ formulation,9,40 and we carried out such measurements in dimethylformamide (DMF) solvent. In fact, 1:1 electrolyte behavior is observed for both 1a and 2a, consistent with mononuclear formulations.32,33 The molar conductivity values for [(TMPA)CuI(CH3CN)]+, [(LMIm)CuI]+ (1a) and [(LEIm)CuI]+ (2a) are 47, 49 and 45 ohm−1 cm2 mole−1, respectively. Such experiments were not carried out in 2-methyltetrahydrofuran (MeTHF) or THF, which were used for the dioxygen reactivity studies described below, since these are not good solvents for conductivity measurements.32 Thus, binuclear structures for 1a or 2a in these solvents cannot entirely be ruled out.
CO Binding and Electrochemistry of [(LMIm)CuI]+ (1a) and [(LEIm)CuI]+ (2a)
In order to obtain insights into the solution state structures of copper(I) complexes, as well as to obtain information concerning the relative amount of electron donation to the copper(I) ion as a function of ligand set (i.e., LMIm vs. LEIm vs. TMPA), carbon monoxide binding to [(LMIm)CuI]+ (1a) and [(LEIm)CuI]+ (2a) was examined. The two C-O stretching frequencies at 2090 and 2073 cm−1 observed for [(TMPA)CuI(CO)]+ have previously been attributed to a dynamic equilibrium involving overall 4- or 5-coordinate complexes, the former structure possessing an uncoordinated pyridyl arm.5,41,42 The lower value is ascribed to the pentacoordinate species where ligation of all four N-donors provides more electron density to the Cu(I) ion, resulting in greater back-donation to the CO π* orbital (thus weakening the CO bond and lowering ν(C-O)). An almost identical behavior is exhibited by [(LMIm)CuI]+ (1a), with CO vibrational frequencies at 2087 and 2063 cm−1, Table 1 and Scheme 3. The five-coordinate isomer of [(LMIm)CuI(CO)]+, designated 5c(1a-CO), has a lower ν(C-O) value (10 cm−1) than the corresponding isomer for [(TMPA)CuI(CO)]+ (2063 vs. 2073 cm−1, Table 1), indicating that the imidazolyl group in LMIm (and LEIm, see below) when coordinated to copper(I) is a better donor than is a pyridyl moiety in these tripodal ligands. With these observations, we conclude the putative four-coordinate isomer of LMIm, 4c[(LMIm)CuI(CO)]+ 4c(1a-CO) (Scheme 3) does not have its imidazolyl group copper ion bound, since the ν(C-O) value is nearly the same as that for the four-coordinate TMPA copper-carbonyl complex (2087 vs. 2090 cm−1, Table 1). On the other hand, for the LEIm complex, only one isomer is observed based on the observation of a single IR absorption (Table 1); the band is 8 cm−1 lowered from the 2090 cm−1 value for [(TMPA)CuI(CO)]+. Thus, to account for some lowering of ν(C-O), [(LEIm)CuI(CO)]+ (2a-CO) could be a four-coordinate species where LEIm acts as a tridentate ligand but with the imidazolyl rather than pyridyl group binding. However, we cannot rule out a five-coordinate formulation with all N-donors ligating, but where a geometric/coordination effect leads to less back-donation to copper(I) in 5c[(LEIm)CuI(CO)]+ then observed for [(TMPA)CuI(CO)]+.
Table 1.
Carbonyl stretching frequencies for copper(I) carbonyl complexes in THF and cyclic voltammetry data for cuprous complexes in DMF
| Compound | CO (cm−1) | E1/2 |
|---|---|---|
| [(TMPA)CuI(CH3CN)]+ | 2090, 2073 | −610 |
| [(LMIm)CuI]+ (1a) | 2087, 2063 | −620 |
| [(LEIm)CuI]+ (2a) | 2082 | −570 |
| (mV) vs. Fe(Cp)2+/0 | ||
Scheme 3.
The electrochemical behavior of [(TMPA)CuI(CH3CN)]+, [(LMIm)CuI]+ (1a) and [(LEIm)CuI]+ (2a) was measured by cyclic voltammetry in DMF under Ar; the E1/2 values obtained (vs. Fe(Cp)2+/0) are listed in Table 1. We find that the E1/2 value for 1a is 10 mV more negative than for the TMPA complex (Table 1), suggesting an affect of better donation from the imidazolyl donor. However, 2a possesses an E1/2 value which is 50 mV more positive than 1a, indicating [(LMIm)CuI]+ (1a) is a stronger reductant than 2a. Redox potentials are affected by factors other than only ligand donation, such as coordination geometry.43,44 The relatively high redox potential of [(LEIm)CuI]+ (2a) compared to the TMPA complex and [(LMIm)CuI]+ (1a) likely reflects geometric changes upon oxidation leading to a (relatively) decreased binding constant between Cu(II) and LEIm. Such affects are further clarified by studies on the Cu(II) complexes of LMIm and LEIm, 1c and 2c, described below.
Preparation and Characterization of Mononuclear LCu(II) Complexes
In order to better understand the nature of the copper(II) ion coordination in the ligand environments of LMIm and LEIm, we synthesized copper(II) complexes by addition of one equiv of the appropriate tetradentate ligand to CuII(ClO4)2·6H2O in CH3CN or CH3OH (see Experimental Section) at room temperature. In all cases, diffusion of diethylether allows for the formation of crystalline materials that could be characterized by X-ray crystallography.
X-ray Structure of Cu(II) Complexes with LMIm and LEIm
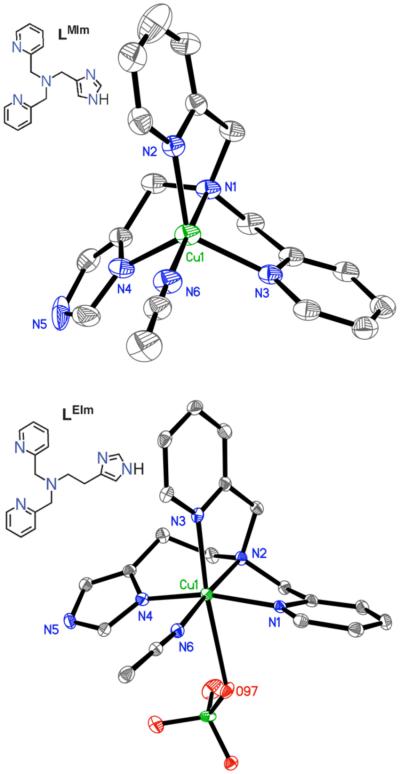
The X-ray structure of [(LMIm)CuII(CH3CN)]2+ (1c) as perchlorate salt reveals the coordination geometry to be a slightly distorted trigonal bipyramid (τ = 0.86, Figure 1), similar but not identical to a previously reported structure of a very closely related ligand-copper(II) complex differing from LMIm only in that the imidazolyl group is N-methylated; this has τ = 0.96.38 For a perfect trigonal bipyramidal (TBP) geometry, τ = 1 while for a square pyramidal geometry, τ = 0.45 The structure of 1c is also similar to TMPA or analogue cupric complexes with a different fifth ligand such as CH3CN, H2O or Cl− (τ = 1 ~ 0.96),46,47 or O22− as in [{(TMPA)CuII}2(O22−)]2+ (τ = 0.86).5 However, the X-ray structure of [(LEIm)CuII(CH3CN)(−OClO3)]+ (2c·OClO3) (Figure 1) indicates a distortion occurs, with a square pyramidal arrangement of the five N-donors from LEIm plus CH3CN; the copper ion is displaced 0.13 Å out of the least-squares plane defined by N1,N2,N4,N6, toward the axial N3pyridyl ligand and τ = 0.19 considering only these ligands. There is also a weakly coordinating perchlorate O-atom occupying the other axial position, Figure 1. Thus, one more methylene group (LEIm vs. LMIm) considerably changes the local copper(II) coordination geometry.
Figure 1.
ORTEP diagram view of the cationic portions of [(LMIm)CuII(CH3CN)]2+ (1c; τ = 0.861, top; 30% probability ellipsoids) and [(LEIm)CuII(CH3CN)(−OClO3)]+ (2c·OClO3; bottom; 30% probability ellipsoids). The hydrogen atoms and non-coordinating perchlorate anions are omitted for clarity.
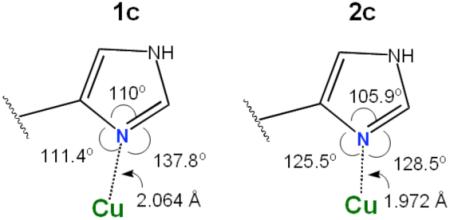
In fact, this result is not unexpected, and is already known from studies of a variety of pyridylalkylamine containing five-coordinate cupric complexes with varying chelate ring size.46,48-50 Thus the additional methylene group on 2c results in a distortion from TBP to a square pyramidal geometry. As a result of this square pyramidal distortion, the Nimidazole distance in 2c is shorter than in the TBP 1c (1.972 vs. 2.064 Å) suggesting a stronger Cu(II)-imidazole bond in 2c than in the TBP 1c. Further, the axial Cu(1)-Npyridine distance (2.183 Å) is much longer than the other Cu-N distances in 2c. In both 1c and 2c, the Cu(II) ion lies in the plane of the imidazole ring, as shown by the fact that the sum of the angles around the coordinating Nimidazole atom is equal to 360°. In the essentially square pyramidal (without ClO4−, Figure 1) [(LEIm)CuII(CH3CN)]2+ (2c) molecule, the Cu-N-carbon angles are close to each other, (see diagram) and the Cu(II) acceptor orbital has good overlap with the Nimidazole lone-pair orbital, leading to a stronger bond. Other selected bond angles and distances are listed in Table 2.
Table 2.
Selected bond distances and angles for 1c and 2c·OClO3
| [(LMIm)CuII(CH3CN)]2+ (1c) | [(LEIm)CuII(CH3CN)(−OClO3)]+ (2c·OClO3) |
||
|---|---|---|---|
| Cu-N | Bond distance (Å) | Cu-N | Bond distance (Å) |
| Cu(1)-N(1) | 2.037(3) | Cu(1)-N(1) | 2.005(3) |
| Cu(1)-N(2) | 2.035(3) | Cu(1)-N(2) | 2.090 (3) |
| Cu(1)-N(3) | 2.039(3) | Cu(1)-N(3) | 2.183(3) |
| Cu(1)-N(4) | 2.064(4) | Cu(1)-N(4) | 1.972(3) |
| Cu(1)-N(6) | 1.969(3) | Cu(1)-N(6) | 2.014(3) |
| Cu(1)-O(97) | 2.770(9) | ||
| N-Cu-N | Bond angle (°) | N-Cu-N | Bond angle (°) |
|---|---|---|---|
| N(6)-Cu(1)-N(2) | 96.19(13) | N(4)-Cu(1)-N(1) | 161.92(11) |
| N(6)-Cu(1)-N(1) | 177.60(16) | N(4)-Cu(1)-N(6) | 91.52(10) |
| N(2)-Cu(1)-N(1) | 82.16(12) | N(1)-Cu(1)-N(6) | 93.51(11) |
| N(6)-Cu(1)-N(3) | 96.69(13) | N(4)-Cu(1)-N(2) | 94.98(11) |
| N(2)-Cu(1)-N(3) | 125.94(13) | N(1)-Cu(1)-N(2) | 80.63(10) |
| N(1)-Cu(1)-N(3) | 82.93(13) | N(6)-Cu(1)-N(2) | 173.39(10) |
| N(6)-Cu(1)-N(4) | 99.87(14) | N(4)-Cu(1)-N(3) | 97.07(10) |
| N(2)-Cu(1)-N(4) | 116.08(13) | N(1)-Cu(1)-N(3) | 99.57(10) |
| N(1)-Cu(1)-N(4) | 82.44(13) | N(6)-Cu(1)-N(3) | 96.70(10) |
| N(3)-Cu(1)-N(4) | 112.92(14) | N(2)-Cu(1)-N(3) | 81.38(10) |
Solution Behavior of 1c and 2c; Electron Paramagnetic Resonance Spectroscopy
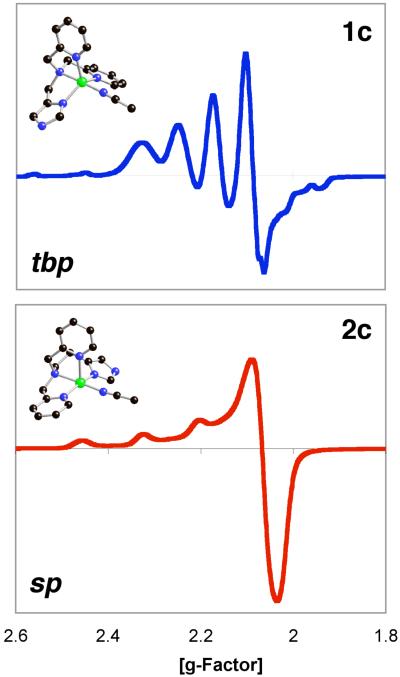
In fact, the solid state structures and difference in coordination geometries described above for of [(LMIm)CuII(CH3CN)]2+ (1c) and [(LEIm)CuII(CH3CN)]2+ (2c) are maintained in solution {Note, the perchlorate ion is unlikely to be coordinating in solution}. EPR spectroscopic data (Figure 2) provide compelling support. [(LMIm)CuII(CH3CN)]2+ (1c) exhibits a “reverse” axial EPR spectrum (gll = 1.99, All = 70 gauss; g⊥ = 2.21, A⊥ = 99 gauss), which is indicative of a system with a dz2 ground state {g⊥ > gll ~ 2 and A⊥ = 60 ~ 100 * 10−4 cm−1}46,49,51,52 and thus TBP geometry. On the other hand, the EPR spectrum of [(LEIm)CuII(CH3CN)]2+ (2c) (gll = 2.26, All = 161 gauss; g⊥ = 2.06) shows a typical square based pyramidal (tetragonal) copper(II) environment, which is a system with a dx2-y2 ground state revealing a regular axial (tetragonal) EPR signature {gll > 2.1 > g⊥ > 2.0 and All = 158 ~ 200 * 10−4 cm−1}.46,48,53
Figure 2.
EPR spectra of [(LMIm)CuII(CH3CN)]2+ (1c) (top) and [(LEIm)CuII(CH3CN)]2+ (2c) (bottom); X-band spectrometer, ν = 9.49 GHz, in DMF/Toluene (1:1) at 4 K. 1c: gll = 1.99, All = 70 gauss; g⊥ = 2.21, A⊥ = 99 gauss. 2c: gll = 2.26, All = 161 gauss; g⊥ = 2.06. See text for discussion.
Low-Temperature Formation of Copper-Dioxygen Adducts. End-on Peroxo Dicopper(II) Complex Formation with [(LMIm)CuI]+ (1a) and [(LEIm)CuI]+ (2a)
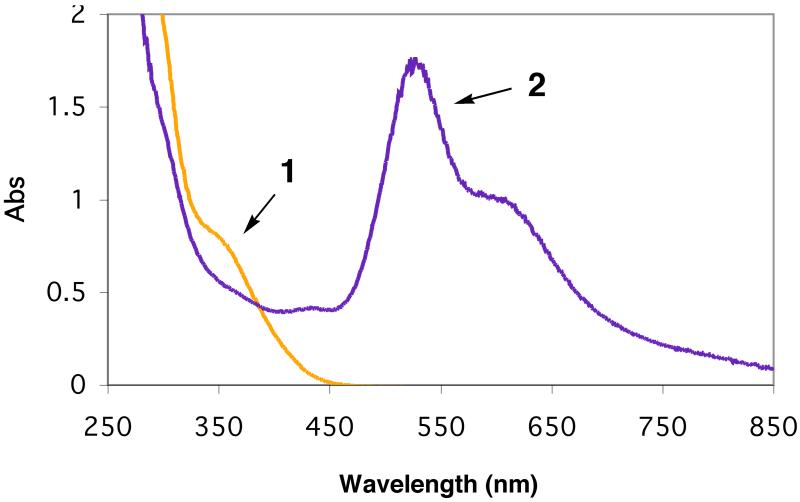
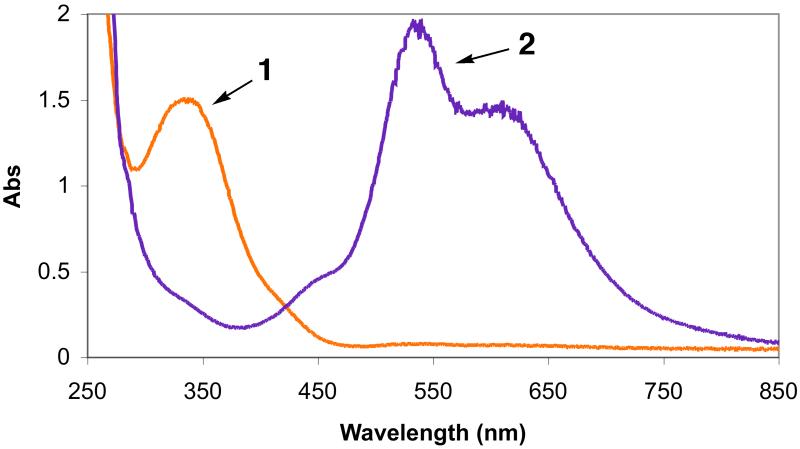
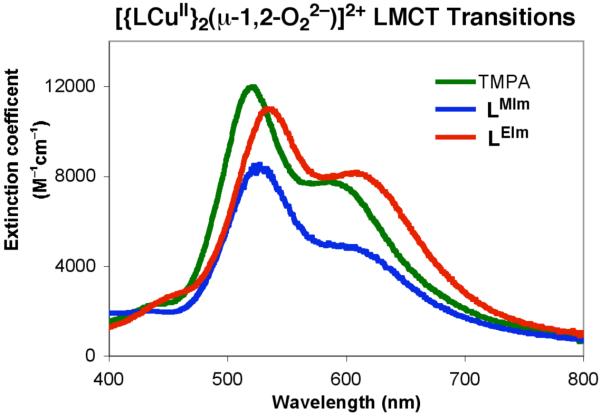
In the last few years we have found that going to relatively non-polar solvents such as THF, MeTHF or even Et2O and toluene leads to new ligand-Cu(I)/O2 chemistry and insights. For these purposes, copper(I) complexes as B(C6F5)4− salts are employed. When yellow MeTHF solutions of [(LMIm)CuI]+ (1a) (λmax = 350 nm (sh); ε ~ 1,500 M−1cm−1) or [(LEIm)CuI]+ (2a) (λmax = 337 nm; ε ~ 4,100 M−1cm−1) are oxygenated at −128 °C, intensely purple-colored solutions form, each having the characteristic spectrum of an end-on μ-1,2-peroxo-dicopper(II) complex (Scheme 4), with three prominent LMCT bands, with most intense coming at 525–540 nm accompanied by a lower energy transition or shoulder at 600–610 nm, see Figures 3 and 4 and Table 3. The position of the absorptions for [{(LMIm)CuII}2(O22−)]2+ (1bP) and [{(LEIm)CuII}2(O22−)]2+ (2bP) compare closely to that known for the ‘parent’ compound [{(TMPA)CuII}2(O22−)]2+.2,4-6 The absorptivity of the three LMCT absorptions for 2bP match very well to those for [{(TMPA)CuII}2(O22−)]2+, however those for 1bP are about one-third lower in intensity (Figure 5 and Table 3). We thus conclude that at −128 °C, the peroxo-dicopper(II) dioxygen adduct 2bP is essentially fully formed, while the reaction of 1a with O2 does not go to completion. Consistent with this is the finding that the 1a/O2 reaction is not even observed at −80 °C in THF; the binding under these conditions is too weak, probably for entropic reasons (by comparison to the O2 reactions with 2a or [(TMPA)CuI(CH3CN)]+). The oxygenation of 2a occurs very rapidly, even at −128 °C.54 See Table 3, which summarizes all the spectroscopic data for the complexes with LMIm and LEIm in comparison with other copper-dioxygen complexes with tripodal tetradentate ligands.
Scheme 4.
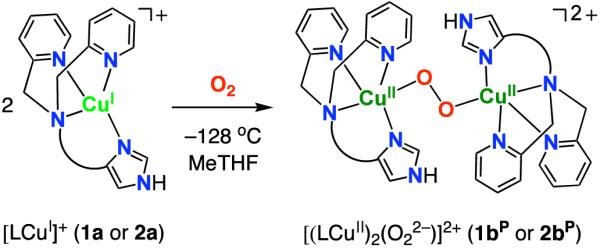
Figure 3.
Low-temperature UV-vis spectra of the oxygenation of [(LMIm)CuI]+ (1a). Spectrum 1: 1a with absorption at 350 nm (1,500 M−1cm−1). Spectrum 2: [{(LMIm)CuII}2(O22−)]2+ (1bP) with absorption at 435 nm (1,700 M−1cm−1), 528 nm (6,800 M−1cm−1), and 605 nm (4,000 M−1cm−1) in MeTHF at −128 °C.
Figure 4.
Low-temperature UV-vis spectra of the oxygenation of [(LEIm)CuI]+ (2a). Spectrum 1: 2a with absorption at 337 nm (4,100 M−1cm−1). Spectrum 2: [{(LEIm)CuII}2(O22−)]2+ (2bP) with absorption 445 nm (2,500 M−1cm−1), 534 nm (11,000 M−1cm−1), and 619 nm (8,100 M−1cm−1) in MeTHF at −128 °C.
Table 3.
End-on Peroxo Species with PY1 Based Tetradentate Ligands
| LMCT; nm (M−1cm−1) | Solvent, Temp | ν(O-O); Δ(18O2); cm−1 |
|||
|---|---|---|---|---|---|
| TMPA6 | 440 (1,700) | 525 (11,300) | 615 (5,800) | EtCN, −80 °C | 832; −44a |
| TMPA55 | 430 (2,100) | 520 (12,000) | 590 (8,000) | MeTHF, −128 °C | - |
| LMIm | 435 (1,700) | 528 (6,800) | 605 (4,000) | MeTHF, −128 °C | - |
| LEIm | 445 (2,500) | 535 (11,000) | 610 (8,100) | MeTHF, −128 °C | 822; −46b |
| D1 56 | 450 (1,100) | 540 (11,100) | 600 (8,700) | EtCN, −90 °C | - |
| TMPAE56 | 445 (2,000) | 532 (9,380) | 590 (7,000) | EtCN, −80 °C | - |
| Me2-uns-penp57 | - | 528 (−) | EtCN, −90 °C | - | |
| uns-penp58 | - | 535 (−) | Acetone, −90 °C | - | |
| BPIA29 | 440 (2,000) | 535 (11,500) | 600 (7,600) | EtCN, −80 °C | - |
| BPQA59 | - | 535 (8,600) | 600 (~6,000) | EtCN, −80 °C | - |
| PMEA60 | - | 536 (~5,000) | EtCN, −90 °C | - | |
| Me1-TPA61 | 440 (−) | 537 (~5,000) | 610 (−) | Acetone, −70 °C | - |
| Others2,13 | ~ 500 | ~ 600 | - | 812–847 | |
in CH2Cl2
in THF
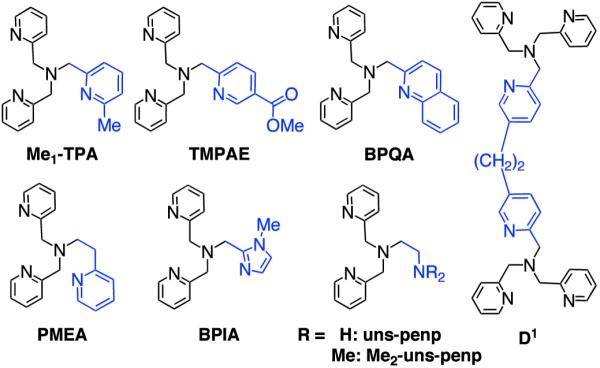
Figure 5.
UV-Visible spectra of μ-1,2-peroxo intermediates from LCuI complexes (L = TMPA, LMIm, and LEIm) reacting with dioxygen at reduced temperature. The ε value scale for the LMIm peroxo complex spectrum shown here is not to scale (εapparent values are much lower, see text), but shown here in order to easily compare λmax values.
Absorption spectra of 1bP and 2bP
While the absorption spectrum of [{(LMIm)CuII}2(O22−)]2+ (1bP) shows similar charge transfer energies compared to [{(TMPA)CuII}2(μ-1,2-O22−)]2+, the absorption spectrum of [{(LEIm)CuII}2(O22−)]2+ (2bP) reveals a significant red shift (15 nm) in the dominant O22− (π*σ) → Cu(dσ) charge transfer, Table 3 and Figure 5. The relevant absorption for [{(TMPA)CuII}2(μ-1,2-O22−)]2+ as measured in the present work in MeTHF at −128 °C is λmax = 520,55 while for 2bP λmax = 535 nm (Figures 4 and 5). As suggested by the X-structure of [(LEIm)CuII(CH3CN)]2+ (2c), the Cu(II) ion in peroxo complex 2bP is expected to be square-pyramidally distorted, due to the geometry of the LEIm ligand. Thus, the half-occupied Cu dx2-y2 orbital of 2bP would be at higher energy than the acceptor dz2 orbital of the TBP [{(TMPA)CuII}2(μ-1,2-O22−)]2+, based on ligand field differences which, by itself, would blue shift the O22−(π*σ) → Cu(dσ) charge transfer. Instead, a red shift of the charge transfer is observed for 2bP compared to [{(TMPA)CuII}2(μ-1,2-O22−)]2+, which reflects the increased electron density in the donor peroxo π*σ, considerably raising the energy of this donor orbital, resulting in a red shift the O22−(π*σ) → Cu(dσ) charge transfer.
Resonance Raman Spectroscopy
The resonance Raman spectrum of [{(LEIm)CuII}2(O22−)]2+ (2bP) in THF with λex=568 nm shows dominant features at 827 cm−1, 811 cm−1, and 539 cm−1, which shift to 776 cm−1 and 513 cm−1 upon 18O2 substitution (Figure 6). The 827 cm−1 and 811 cm−1 features are at energies consistent with those of peroxo ν(O-O) stretches.1,2,13 Upon 18O2 substitution, a single ν(O-O) is observed at 776 cm−1 at higher intensity than either the 827 cm−1 or 811 cm−1 feature. As such, the 827 cm−1 and 811 cm−1 features are assigned as the result of a Fermi resonance of ν(O-O) with a local non-enhanced mode of the same symmetry. The pre-interaction ν(O-O) is estimated to be at 822 cm−1.56 The feature at 539 cm−1 (Δ(18O2) = −26) is assigned as a symmetric ν(Cu-O) stretch based on energy and 18O2-isotopic shift. These observed vibrations formulate 2bP as an end-on bound μ-1,2 peroxo dicopper(II) complex.6 The antisymmetric ν(Cu-O) is observed as a weak, broad feature at 484 cm−1 (Δ(18O2) = −26)). Additional isotope-insensitive features are observed at 417 cm−1, 337 cm−1, and 279 cm−1 and are assigned as Cu-Npyridine, internal TMPA ring mode, and Cu-Nimidizole stretches respectively.
Figure 6.
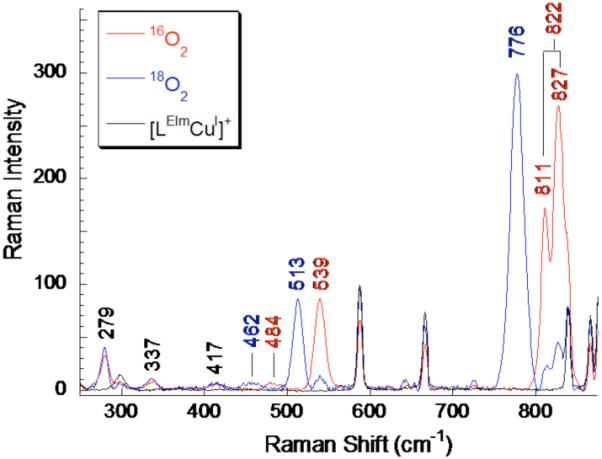
rR spectra of [{(LEIm)CuII}2(O22−)]2+ (2bP) in THF at 77 K (red spectrum denotes 16O2, blue spectrum denotes 18O2, and the black spectrum is pre-oxygenation). λex = 568 nm.
The O-O stretching frequency of 2bP is lower (by 10 cm−1) than observed for [{(TMPA)CuII}2(O22−)]2+ (832 cm−1), indicating that 2bP has a weaker O-O bond. The symmetric Cu-O stretch is also lower than for [{(TMPA)CuII}2(O22−)]2+ (by 23 cm−1), reflecting a weaker Cu-O bond 2bP.6 Complex 2bP is likely distorted from TBP to a more square-pyramidal geometry (as was observed for 2c, vide supra), resulting in better overlap between the ligand N’s and Cu’s dx2-y2 orbital. The high intensity of the Cu-Nimidazole vibration in the rR spectrum (279 cm−1, Figure 6) is consistent with an orientation of the lobes of the Cu dx2-y2 orbital along the Cu-Nimidazole bond. The peroxo πσ* to Cu charge transfer into dx2-y2 would result in elongation of the Cu-Nimidazole bond and thus its rR enhancement. The square pyramidal environment of each Cu eliminates the inversion center of the dimer, allowing for enhancement of the antisymmetric Cu-O stretch in the rR (484 cm−1 (Δ(18O2) = −26), Figure 6). Better orientation of the Nimidazole ligand lone pair along the lobe of Cu’s dx2-y2 orbital would facilitate its donation thus reducing donation from the peroxo to the Cu, weakening the Cu-O bond. This decreased peroxo πσ* donation also results in more electron density in the antibonding peroxo πσ* orbital and thus a weaker O-O bond.57
Detection of a Superoxo Copper(II) Complex with the LEIm Ligand-Complex
We have been able to detect the initial O2-adduct arising from dioxygen reactivity in the [(LEIm)CuI]+ (2a) chemistry. This was accomplished in one manner by first bubbling a −128 °C solution of 2a in MeTHF with carbon monoxide, which gives the colorless CO-adduct [(LEIm)CuI(CO)]+ (vide supra); the MLCT band at 337 nm (Spectra 1 and 2 in Figure 7) disappears. After eliminating excess CO by vacuum-purging, oxygenation of this solution leads to formation of O2-adducts, a mixture of the peroxodicopper(II) species 2bP and a new absorption near 440 nm is assigned as the superoxo complex [(LEIm)CuII(O2·−)]+ (2bS). We have previously used this ‘trick’ of oxygenation of a solution of the carbonyl complex in order to stabilize [(Me2N-TMPA)CuII(O2·−)]+.11 Additional O2-bubbling leads to full formation of peroxo adduct, spectrum 4 in Figure 7.
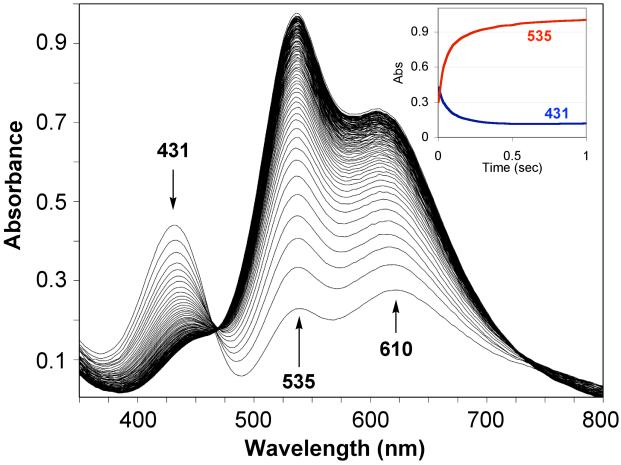
A more direct detection of [(LEIm)CuII(O2·−)]+ (2bS) was possible using a stopped-flow kinetics instrument with diode array full spectrum monitoring. As has been previously extensively studied for oxygenation of [(TMPA)CuI(CH3CN)]+ and study of the transient superoxo complex [(TMPA)CuII(O2·−)]+,7,9 millisecond mixing of [(LEIm)CuI]+ (2a) and dioxygen in THF at −90 °C readily reveals the formation of 2bS, with strong absorption at 431 nm.58 The spectroscopic behavior observed in this experiment (Figure 8) reveals that 2bS forms within the instrument mixing time (1–2 ms), as the 431 nm absorption is already decreasing in the first few spectra observed. Thus, from the absorptivity observed here, we conclude that ε > 2,600 M−1cm−1 at 431 nm for 2bS. At this time, a full stopped-flow kinetic analysis has not been carried out the 2a/O2 reaction chemistry; this will be the subject of future study on a series of copper(I) complexes with tripodal tetradentate ligands varying in donor atoms. Closely related to this will be studies of copper(I)-carbonyl complexes 1a-CO and 2a-CO in “flash-and-trap” experiments,10 to deduce the kinetics of formation of superoxo-adducts.
Figure 8.
Time-dependent UV-visible spectra for the oxygenation of [(LEIm)CuI]+ (2a) in THF at −90 °C as measured using a stopped-flow kinetics instrument. The Inset shows the time dependence of the disappearance of the superoxo complex [(LEIm)CuII(O2·−)]+ (2bS) (431 nm) and the corresponding formation of the peroxo complex [{(LEIm)CuII}2(O22−)]2+ (2bP) monitored at 535 nm. See text for further explanation and discussion.
Tetramer Cluster Formation
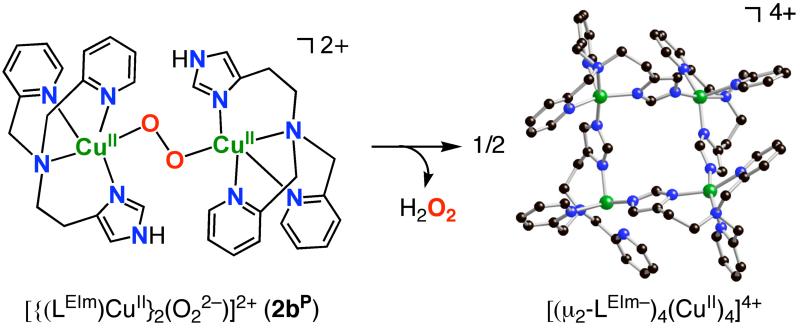
The thermal decomposition product of [{(LEIm)CuII}2(O22−)]2+ (2bP), following warming −80 °C solutions in THF, is a green crystalline material obtained in high yield. X-ray structural analysis identified it as a tetranuclear [(μ2-LEIm−)4(CuII)4]4+ cluster, Figure 9. It is constructed from four cupric ions and four anionic (i.e., with deprotonated imidazolyl) LEIm− ligands. Each copper center has a distorted square pyramidal geometry with an average τ = 0.41 (τ = 0.0 for a perfect square pyramid (SP), vide supra). Supporting the arguments made above, this is another example of a copper complex in the LEIm framework which prefers a (distorted) SP rather than a TBP coordination geometry. The average Cu...Cu distance in the cluster is 5.877 Å. Other selected Cu-N bonds are listed in Table 4. The presence of the anionic imidazolate group here suggested to us the probability that hydrogen peroxide was generated during decomposition of 2bP, Scheme 5, with the imidazolyl N-H given up to form H2O2. We tried to test for this possibility, using the titanium(IV) oxysulfate reagent to interrogate the warmed up solution of 2bP; this should give an optical change at 408 nm when it reacts with H2O2 (see Experimental Section).35,36 However, no H2O2 was detected, perhaps due to metal complex mediated disproportionation chemistry, or oxidation of solvent (which we did not probe). Hydrogen peroxide was produced in 28 % yield when [H(OEt2)2][B(C6F5)4] was added to the peroxo species 2bP at −94 °C, warming and workup. Such a result (but in better yield) occurs when [{(TMPA)CuII}2(O22−)]2+ is protonated with mineral acids or even phenols.59 In fact, the thermal decomposition of [{(LMIm)CuII}2(O22−)]2+ (1bP) similarly leads to the analogue tetramer cluster complex.55
Figure 9.
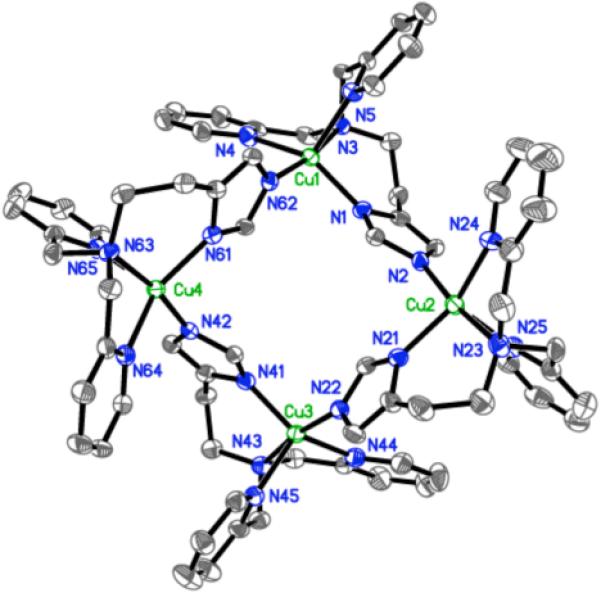
ORTEP view (50% probability ellipsoids) of a tetramer [(μ2-LEIm−)4(CuII)4]4+] cluster (average τ = ~ 0.41). The hydrogen atoms and perchlorate anions are omitted for clarity.
Table 4.
Selected bond distances of a tetramer [(μ2-LEIm−)4(CuII)4]4+ cluster
| Cu-N | Bond distance (Å) | Cu-N | Bond distance (Å) |
|---|---|---|---|
| Cu(1)-N(62) | 1.967(3) | Cu(3)-N(41) | 1.969(4) |
| Cu(1)-N(1) | 1.984(4) | Cu(3)-N(22) | 1.973(4) |
| Cu(1)-N(4) | 2.046(4) | Cu(3)-N(44) | 2.027(4) |
| Cu(1)-N(3) | 2.090(3) | Cu(3)-N(43) | 2.098(4) |
| Cu(1)-N(5) | 2.197(4) | Cu(3)-N(45) | 2.185(4) |
| Cu(2)-N(2) | 1.957(4) | Cu(4)-N(42) | 1.963(3) |
| Cu(2)-N(21) | 1.967(4) | Cu(4)-N(61) | 1.978(4) |
| Cu(2)-N(24) | 2.046(4) | Cu(4)-N(64) | 2.039(4) |
| Cu(2)-N(23) | 2.095(4) | Cu(4)-N(63) | 2.089(3) |
| Cu(2)-N(25) | 2.222(4) | Cu(4)-N(65) | 2.187(4) |
Scheme 5.
Summary and Conclusions
In this report we have described the copper(I), copper(II) and copper(I)-dioxygen chemistry with new tetradentate ligands possessing one imidazolyl donor (LMIm and LEIm). The study is directed toward comparisons with our prior detailed investigations with TMPA-Cu chemistry. LMIm containing Cu(I)-CO, mononuclear Cu(II) and the peroxo complex [{(LMIm)CuII}2(μ-1,2-O22−)]2+ (1bP) all show structural and/or physical properties very similar to their TMPA-Cu analogs. However, LEIm containing Cu(I)-CO, Cu(II) complexes (i.e., 2c) and peroxo complex [{(LEIm)CuII}2(μ-1,2-O22−)]2+ (2bP) are different; 2bP possesses significantly weakened Cu-O and O-O bonds as compared to [{(TMPA)CuII}2(O22−)]2+. The relative decreases in bond strength are due to a square pyramidal distortion of 2bP which results in increased overlap (thus donation) of the ligand N’s with the Cu(II) dx2-y2 orbital resulting in less donation from peroxo to Cu (decreased Cu-O bond strength) and increased electron density in the peroxo π*σ orbital (decreased O-O bond strength).
Future studies will address the electronic structures of copper complexes with these varied (in donor atom and tetradentate chelate architecture) tripodal tetradentate ligands, both from an experimental and theoretical perspective. Also, it will be of interest to compare complexes 1a and 2a in their kinetics and thermodynamics of copper(I)/O2 reactivity giving superoxo-Cu(II) and peroxo-dicopper(II) complexes. Reactions of peroxo complexes employing tetradentate ligands with varied donor groups (i.e., S or O donors) will also be tested for their oxidative reactivity towards exogenous substrates.
Supplementary Material
Acknowledgment
KDK and EIS are grateful to the National Institutes of Health (GM 28962 (KDK), DK 31450 (EIS)) for support of this research. DHL is grateful to Chonbuk National University for support.
Footnotes
Supporting Information: Crystallographic information files (CIF) for [(LMIm)CuII(CH3CN)]2+ (1c), [(μ2-LEIm−)4(CuII)4]4+ cluster, and [(LEIm)CuII(CH3CN)(−OClO3)]+ (2c·OClO3). This material is available free of charge via the Internet at http://pubs.acs.org.
References
- (1).Hatcher LQ, Karlin KD. J. Biol. Inorg. Chem. 2004;9:669–683. doi: 10.1007/s00775-004-0578-4. [DOI] [PubMed] [Google Scholar]
- (2).Mirica LM, Ottenwaelder X, Stack TDP. Chem. Rev. 2004;104:1013–1045. doi: 10.1021/cr020632z. [DOI] [PubMed] [Google Scholar]
- (3).Lewis EA, Tolman WB. Chem. Rev. 2004;104:1047–1076. doi: 10.1021/cr020633r. [DOI] [PubMed] [Google Scholar]
- (4).Jacobson RR, Tyeklár Z, Karlin KD, Liu S, Zubieta J. J. Am. Chem. Soc. 1988;110:3690–3692. [Google Scholar]
- (5).Tyeklár Z, Jacobson RR, Wei N, Murthy NN, Zubieta J, Karlin KD. J. Am. Chem. Soc. 1993;115:2677–2689. [Google Scholar]
- (6).Baldwin MJ, Ross PK, Pate JE, Tyeklár Z, Karlin KD, Solomon EI. J. Am. Chem. Soc. 1991;113:8671–8679. [Google Scholar]
- (7).Karlin KD, Kaderli S, Zuberbühler AD. Acc. Chem. Res. 1997;30:139–147. [Google Scholar]
- (8).Itoh S. Curr. Opin. Chem. Biol. 2006;10:115–122. doi: 10.1016/j.cbpa.2006.02.012. [DOI] [PubMed] [Google Scholar]
- (9).Zhang CX, Kaderli S, Costas M, Kim E.-i., Neuhold Y-M, Karlin KD, Zuberbühler AD. Inorg. Chem. 2003;42:1807–1824. doi: 10.1021/ic0205684. [DOI] [PubMed] [Google Scholar]
- (10).Fry HC, Scaltrito DV, Karlin KD, Meyer GJ. J. Am Chem. Soc. 2003;125:11866–11871. doi: 10.1021/ja034911v. [DOI] [PubMed] [Google Scholar]
- (11).Maiti D, Fry HC, Woertink JS, Vance MA, Solomon EI, Karlin KD. J. Am. Chem. Soc. 2007;129:264–265. doi: 10.1021/ja067411l. [DOI] [PubMed] [Google Scholar]
- (12).Würtele C, Gaoutchenova E, Harms K, Holthausen MC, Sundermeyer J, Schindler S. Angew. Chem. Int. Ed. 2006;45:3867–3869. doi: 10.1002/anie.200600351. [DOI] [PubMed] [Google Scholar]
- (13).Komiyama K, Furutachi H, Nagatomo S, Hashimoto A, Hayashi H, Fujinami S, Suzuki M, Kitagawa T. Bull. Chem. Soc. Jap. 2004;77:59–72. [Google Scholar]
- (14).Hatcher LQ, Karlin KD. Adv. Inorg. Chem. 2006;58:131–184. [Google Scholar]
- (15).Battaini G, Monzani E, Perotti A, Para C, Casella L, Santagostini L, Gullotti M, Dillinger R, Nather C, Tuczek F. J. Am. Chem. Soc. 2003;125:4185–4198. doi: 10.1021/ja0280776. [DOI] [PubMed] [Google Scholar]
- (16).Itoh K, Hayashi H, Furutachi H, Matsumoto T, Nagatomo S, Tosha T, Terada S, Fujinami S, Suzuki M, Kitagawa T. J. Am. Chem. Soc. 2005;127:5212–5223. doi: 10.1021/ja047437h. [DOI] [PubMed] [Google Scholar]
- (17).Cheruzel LE, Cecil MR, Edison SE, Mashuta MS, Baldwin MJ, Buchanan RM. Inorg. Chem. 2006;45:3191–3202. doi: 10.1021/ic051280s. [DOI] [PubMed] [Google Scholar]
- (18).Cheruzel LE, Mashuta MS, Buchanan RM. Chem. Comm. 2005:2223–2225. doi: 10.1039/b419040h. [DOI] [PubMed] [Google Scholar]
- (19).Beretta M, Bouwman E, Casella L, Douziech B, Driessen WL, Gutierrez-Soto L, Monzani E, Reedijk J. Inorg. Chim. Acta. 2000;310:41–50. [Google Scholar]
- (20).Santagostini L, Gullotti M, Pagliarin R, Bianchi E, Casella L, Monzani E. Tetrahedron: Asymmetry. 1999;10:281–295. [Google Scholar]
- (21).Nie HL, Aubin SMJ, Mashuta MS, Porter RA, Richardson JF, Hendrickson DN, Buchanan RM. Inorg. Chem. 1996;35:3325–3334. doi: 10.1021/ic9511985. [DOI] [PubMed] [Google Scholar]
- (22).Chen S, Richardson JF, Buchanan RM. Inorg. Chem. 1994;33:2376–2382. [Google Scholar]
- (23).Sorrell TN, Vankai VA, Garrity ML. Inorg. Chem. 1991;30:207–210. [Google Scholar]
- (24).Casella L, Gullotti M, Pallanza G, Ligoni L. J. Am. Chem. Soc. 1988;110:4221–4227. [Google Scholar]
- (25).Zhou L, Powell D, Nicholas KM. Inorg. Chem. 2006;45:3840–3842. doi: 10.1021/ic052121b. [DOI] [PubMed] [Google Scholar]
- (26).Battaini G, Casella L, Gullotti M, Monzani E, Nardin G, Perotti A, Randaccio L, Santagostini L, Heinemann FW, Schindler S. Eur. J. Inorg. Chem. 2003:1197–1205. [Google Scholar]
- (27).Sorrell TN, Allen WE, White PS. Inorg. Chem. 1995;34:952–960. [Google Scholar]
- (28).Lynch WE, Kurtz DM, Jr., Wang S, Scott RA. J. Am. Chem. Soc. 1994;116:11030–11038. [Google Scholar]
- (29).Wei N, Murthy NN, Tyeklár Z, Karlin KD. Inorg. Chem. 1994;33:1177–1183. [Google Scholar]
- (30).Liang H-C, Kim E, Incarvito CD, Rheingold AL, Karlin KD. Inorg, Chem. 2002;41:2209–2212. doi: 10.1021/ic010816g. [DOI] [PubMed] [Google Scholar]
- (31).Liang H-C, Karlin KD, Dyson R, Kaderli S, Jung B, Zuberbühler AD. Inorg. Chem. 2000;39:5884–5894. doi: 10.1021/ic0007916. [DOI] [PubMed] [Google Scholar]
- (32).Geary WJ. Coord. Chem. Rev. 1971;7:81–122. [Google Scholar]
- (33).Sorrell TN, Borovik AS. J. Am. Chem. Soc. 1987;109:4255–4260. [Google Scholar]
- (34).Due to the copper(I)-LMIm complex extreme air sensitivity, even after many tries we were not able to obtain proper C, H and N elemental analyses. The expected 1H-NMR spectra of these complexes and other clean behavior attests to their high purity in terms of the chemistry described in this paper.
- (35).Chaudhuri P, Hess M, Mueller J, Hildenbrand K, Bill E, Weyhermueller T, Wieghardt K. J. Am. Chem. Soc. 1999;121:9599–9610. [Google Scholar]
- (36).Eisenberg GM. Industrial and Engineering Chemistry-Analytical Edition. 1943;15:327–328. [Google Scholar]
- (37).Jutzi P, Muller C, Stammler A, Stammler HG. Organometallics. 2000;19:1442–1444. [Google Scholar]
- (38).Ohtsu H, Shimazaki Y, Odani A, Yamauchi O, Mori W, Itoh S, Fukuzumi S. J. Am. Chem. Soc. 2000;122:5733–5741. [Google Scholar]
- (39).Carrier SM, Ruggiero CE, Houser RP, Tolman WB. Inorg. Chem. 1993;32:4889–4899. [Google Scholar]
- (40).Himes RA, Park GY, Barry AN, Blackburn NJ, Karlin KD. J. Am Chem. Soc. 2007;129:5352–5353. doi: 10.1021/ja0708013. [DOI] [PubMed] [Google Scholar]
- (41).Kretzer RM, Ghiladi RA, Lebeau EL, Liang H-C, Karlin KD. Inorg. Chem. 2003;42:3016–3025. doi: 10.1021/ic020521i. [DOI] [PubMed] [Google Scholar]
- (42).Fry HC, Lucas HR, Narducci Sarjeant AA, Karlin KD, Meyer GJ. Inorg. Chem. 2008;47:241–256. doi: 10.1021/ic701903h. [DOI] [PubMed] [Google Scholar]
- (43).Ambundo EA, Deydier M-V, Grall AJ, Aguera-Vega N, Dressel LT, Cooper TH, Heeg MJ, Ochrymowycz LA, Rorabacher DB. Inorg. Chem. 1999;38:4233–4242. [Google Scholar]
- (44).Rorabacher DB. Chem. Rev. 2004;104:651–697. doi: 10.1021/cr020630e. [DOI] [PubMed] [Google Scholar]
- (45).Addison AW, Rao TN, Reedijk J, van Rijn J, Verschoor GC. J. Chem. Soc. Dalton Trans. 1984:1349–1356. [Google Scholar]
- (46).Lucchese B, Humphreys KJ, Lee D-H, Incarvito CD, Sommer RD, Rheingold AL, Karlin KD. Inorg. Chem. 2004;43:5987–5998. doi: 10.1021/ic0497477. [DOI] [PubMed] [Google Scholar]
- (47).Lim BS, Holm RH. Inorg. Chem. 1998;37:4898–4908. doi: 10.1021/ic9801793. [DOI] [PubMed] [Google Scholar]
- (48).Wei N, Murthy NN, Karlin KD. Inorg. Chem. 1994;33:6093–6100. [Google Scholar]
- (49).Karlin KD, Hayes JC, Shi J, Hutchinson JP, Zubieta J. Inorg. Chem. 1982;21:4106–4108. [Google Scholar]
- (50).Schatz M, Becker M, Thaler F, Hampel F, Schindler S, Jacobson RR, Tyeklár Z, Murthy NN, Ghosh P, Chen Q, Zubieta J, Karlin KD. Inorg. Chem. 2001;40:2312–2322. doi: 10.1021/ic000924n. [DOI] [PubMed] [Google Scholar]
- (51).Barbucci R, Bencini A, Gatteschi D. Inorg. Chem. 1977;16:2117. [Google Scholar]
- (52).Jiang F, Karlin KD, Peisach J. Inorg. Chem. 1993;32:2576–2582. [Google Scholar]
- (53).Wei N, Murthy NN, Chen Q, Zubieta J, Karlin KD. Inorg. Chem. 1994;33:1953–1965. [Google Scholar]
- (54).Both 1bP and 2bP are stable at −128 °C for more than hour and qualitatively have generally similar stability compared to [{(TMPA)CuII}2(O22−)]2+, based on observable thermal decomposition times as measured by absorbance loss.
- (55).unpublished observations
- (56).Skulan AJ, Hanson MA, Hsu H.-f., Que L, Jr., Solomon EI. J. Am. Chem. Soc. 2003;125:7344–7356. doi: 10.1021/ja021137n. [DOI] [PubMed] [Google Scholar]
- (57).A resonance Raman study on [{(LMIm)CuII}2(O22−)]2+ (1bP) was not carried out in the context of this report, but will be described in a separate publication.
- (58).Species 2bS has an absorption near 440 nm in MeTHF solvent. We surmise that this difference compared to in THF solvent may be attributed to a solvent dependence: For [(TMPA)CuII(O2·−)]+, the related absorption occurs at 410 nm in EtCN, but 425 nm in THF, see reference 10. Further studies are needed to understand these observations.
- (59).Paul PP, Tyeklár Z, Jacobson RR, Karlin KD. J. Am. Chem. Soc. 1991;113:5322–5332. [Google Scholar]
Associated Data
This section collects any data citations, data availability statements, or supplementary materials included in this article.


