Abstract
This review describes our current understanding of the “traffic lights” that regulate sulfur flow through the methionine bionetwork in liver, which supplies two major homeostatic systems governing cellular methylation and antioxidant potential. Theoretical concepts derived from mathematical modeling of this metabolic nexus provide insights into the properties of this system, some of which seem to be paradoxical at first glance. Cellular needs supported by this network are met by use of parallel metabolic tracks that are differentially controlled by intermediates in the pathway. A major task, i.e. providing cellular methylases with the methylating substrate, S-adenosylmethionine, is met by flux through the methionine adenosyltransferase I isoform. On the other hand, a second important function, i.e., stabilization of the blood methionine concentration in the face of high dietary intake of this amino acid, is achieved by switching to an alternative isoform, methionine adenosyltransferase III, and to glycine N-methyl transferase, which together bypass the first two reactions in the methionine cycle. This regulatory strategy leads to two metabolic modes that differ in metabolite concentrations and metabolic rates almost by an order of magnitude. Switching between these modes occurs in a narrow trigger zone of methionine concentration. Complementary experimental and theoretical analyses of hepatic methionine metabolism have been richly informative and have the potential to illuminate its response to oxidative challenge, to methionine restriction and lifespan extension studies and to diseases resulting from deficiencies at specific loci in this pathway.
The availability of vast amounts of kinetic information on metabolic enzymes has necessitated the application of mathematical modeling approaches for elucidating the principles of regulation and interaction in these systems. Methionine metabolism is an excellent example of this. Methionine is an essential amino acid that is needed for the synthesis of S-adenosylmethionine (AdoMet)1, the major biological methylating agent. Methionine is also the source of cysteine, the limiting reagent for the synthesis of glutathione (GSH), the cell’s principle antioxidant. Hence, two major homeostatic systems, i.e., cellular methylation and redox buffering, are interconnected via and coordinately regulated by methionine metabolism. Furthermore, methionine metabolism is intimately linked to folate metabolism and this network includes more than twenty enzymes. It is not surprising therefore, that aberrations in methionine metabolism are associated with many pathologies, including cancer, anemia, neurodegenerative diseases and development abnormalities [1–5]. Some regulatory features of hepatic methionine metabolism seem at first glance to be paradoxical and in this review we discuss insights into a novel strategy for allosteric regulation that have emerged from mathematical modeling studies.
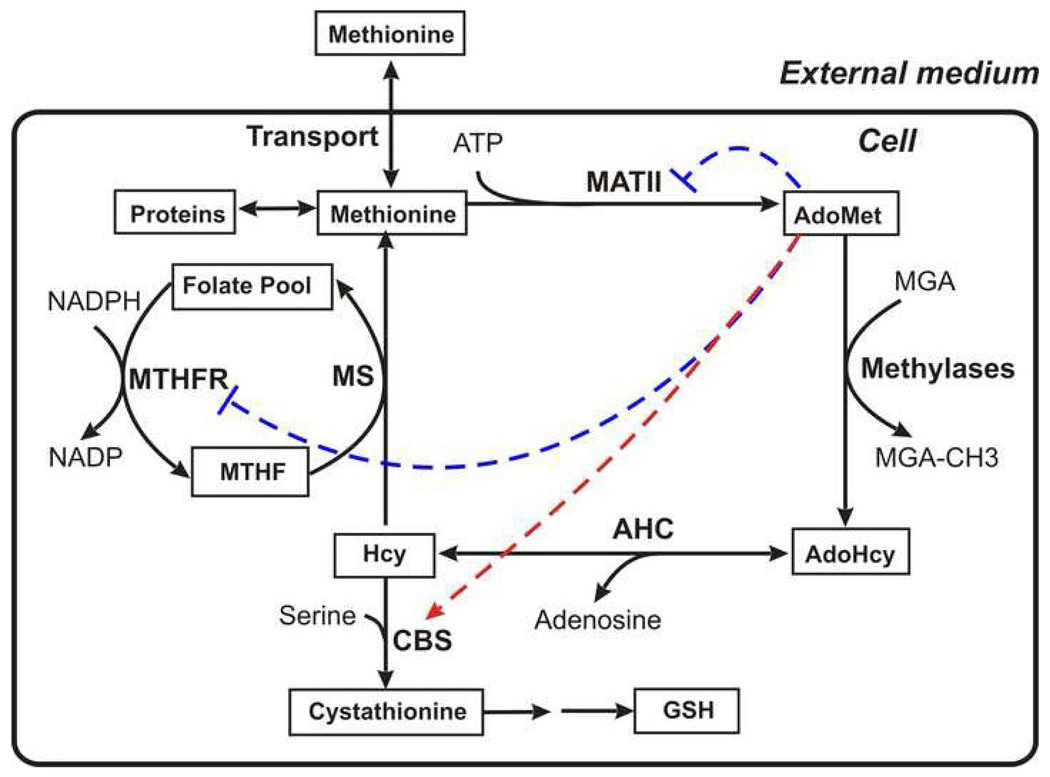
After digestion of food proteins, methionine enters gastrointestinal tissues where up to 20% of it can be metabolized [6]. The blood transports methionine to other tissues and cells. Fig.1A shows the organization of methionine metabolism in most mammalian tissues. Methionine enters the cell via Na+-dependent transporters A and ASC, and Na+-independent transporters [7, 8]. In the cell, methionine is consumed for protein synthesis or enters the metabolic cycle. In the first stage of the cycle, methionine is activated as a methyl donor by S-adenosylmethionine synthetase (MAT) forming S-adenosylmethionine (AdoMet). Numerous methylases comprise the user group for AdoMet and catalyze transmethylation reactions that generate S-adenosylhomocysteine (AdoHcy). The latter is cleaved to adenosine and homocysteine (Hcy) in a reaction catalyzed by S-adenosylhomocysteinase (AHC). Homocysteine can be remethylated to methionine using the methyl group of 5-methyltetrahydrofolate (MTHF) in a reaction catalyzed by methionine synthase (MS).
Fig. 1.
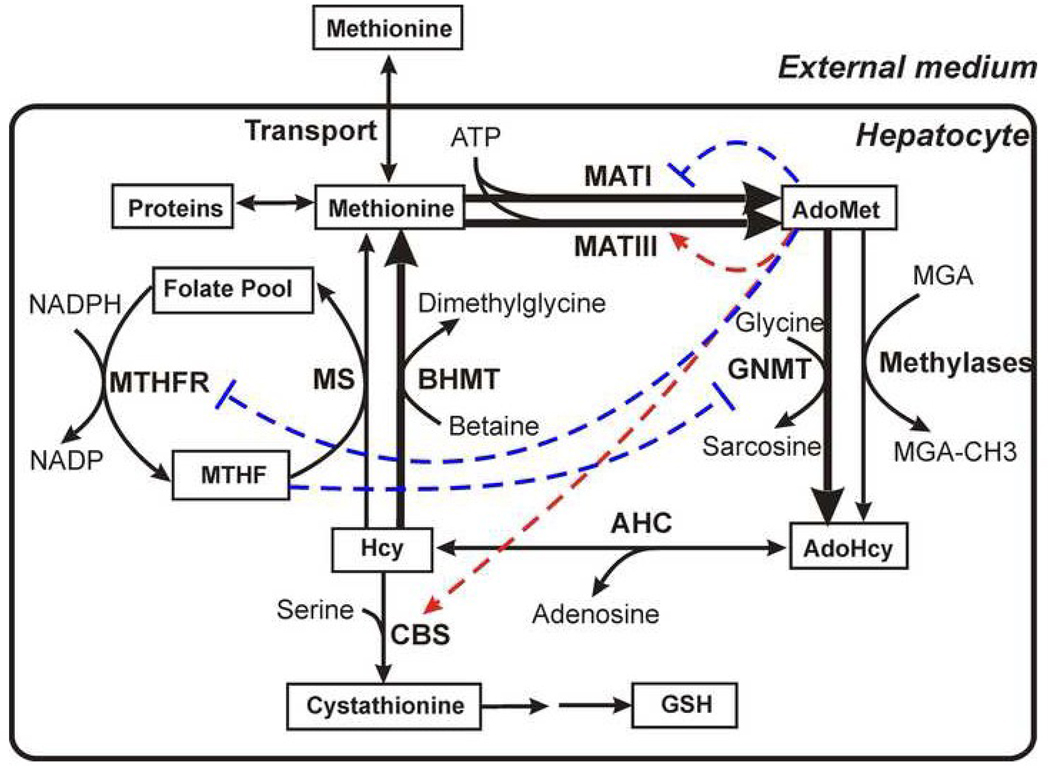
General scheme depicting methionine metabolism (A) in most extrahepetic tissues and (B) in hepatocytes. The solid arrows depict enzymatic reactions and the thick lines denote hepatocyte-specific enzymes. The dashed red arrows and the dashed blue lines indicate respectively allosteric activation and inhibition of enzymes by metabolites. The abbreviations used in this figure are described1. The figure is based on Fig. 1 from [36].
Homocysteine is also metabolized via the transsulfuration pathway to generate cysteine, which is consumed for synthesis of proteins, glutathione, and coenzyme A. Also, there are two routes for cysteine degradation in mammals. It can be oxidized to taurine, an osmolyte [9] or converted to pyruvate and sulfate [10]. The transsulfuration pathway exists in most tissues except muscle (including heart) and the endothelium. It begins with an irreversible condensation reaction of homocysteine and serine, catalyzed by cystathionine-β-synthase (CBS). Defects in CBS are the single most common cause of homocystinuria, an autosomal recessive disorder, which is accompanied by severely elevated levels of plasma homocysteine [11]. Elevated plasma homocysteine levels are correlated with multiple pathological conditions, such as cardiovascular diseases, neurodegenerative diseases and neural tube defects [12–15].
In adult liver cells, the organization of methionine metabolism is more complex (Fig. 1B) and critical points of distinction are enumerated below:
(1) Instead of MATII, expressed in extrahepatic tissues, adult liver expresses the MAT isoenzyme, which exists in one of two isoforms: MATI and MATIII, and are present simultaneously [16]. The MAT1A gene encodes both MATI and III however; MATIII is dimeric whereas MATI is tetrameric. The kinetic properties of the resulting enzymes are significantly different. In contrast, MAT2A encodes a single isoform, MATII. MATI and MATII are inhibited by the product, AdoMet, while MATIII is activated by AdoMet. The redundancy in the AdoMet synthesis reactions begs the question as to the logic of the existence of multiple routes for catalysis of the same overall reaction. It also raises the question as to how the ratio between MATI and MATIII is regulated in hepatocytes.
(2) Glycine-N-methyltransferase (GNMT) is an abundant protein that represents 1–3% of soluble protein in liver [17, 18]. As opposed to other methylases, GNMT performs a seemingly wasteful task, i.e. methylating glycine to generate the product, sarcosine, that has no apparent utility and is cleared from the cell, raising the obvious question as to what role this enzyme serves. The sigmoidal dependence of GNMT kinetics on AdoMet differ from the hyperbolic kinetics of other methylases [18]. Interestingly, a positive correlation between the level of GNMT expression and sarcosine concentration was recently discovered in a metabolomics study on metastatic prostate cancer, suggesting that sarcosine may be a potentially useful biomarker for this disease [19].
(3) Betaine homocysteine S-methyltransferase (BHMT) works in parallel with MS providing an alternative route for remethylation of homocysteine to form methionine and betaine. This enzyme links the oxidative catabolism of choline to methionine metabolism.
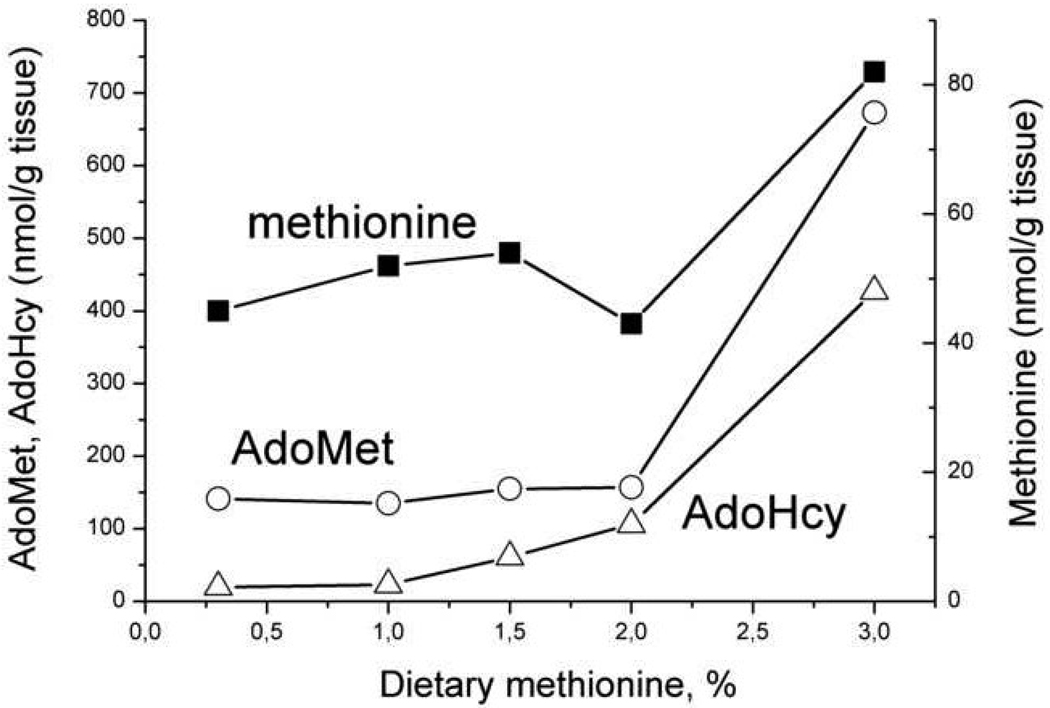
An interesting feature of liver methionine metabolism was uncovered by Finkelstein and Martin [20] in a study on rats maintained on diets differing in their methionine content. They observed that liver methionine concentration was stabilized even with a 10-fold increase in dietary methionine from 0.3 to 3% (Fig. 2), In contrast, AdoMet and AdoHcy concentrations increased gradually up to 2% of dietary methionine, and then increased sharply(~4-fold) when dietary methionine increased from 2% to 3% (Fig. 2). This study suggested the existence of a trigger point or threshold methionine concentration in the stabilization mechanism of liver methionine metabolism.
Fig. 2.
The dependence of the methionine, AdoMet and AdoHcy concentrations in rat liver on methionine content in a diet. The figure was generated using the average data presented in [20].
The novel features of methionine metabolism discussed above together with the multitude of regulatory interactions within and with other metabolic systems make it challenging to understand the operating principles in and regulation of this pathway. The first theoretical study of methionine metabolism was published in 2000 [21] and illustrated the value of a systems analysis approach for revealing unusual regulatory strategies used by this system.
Mathematical modeling of the methionine cycle
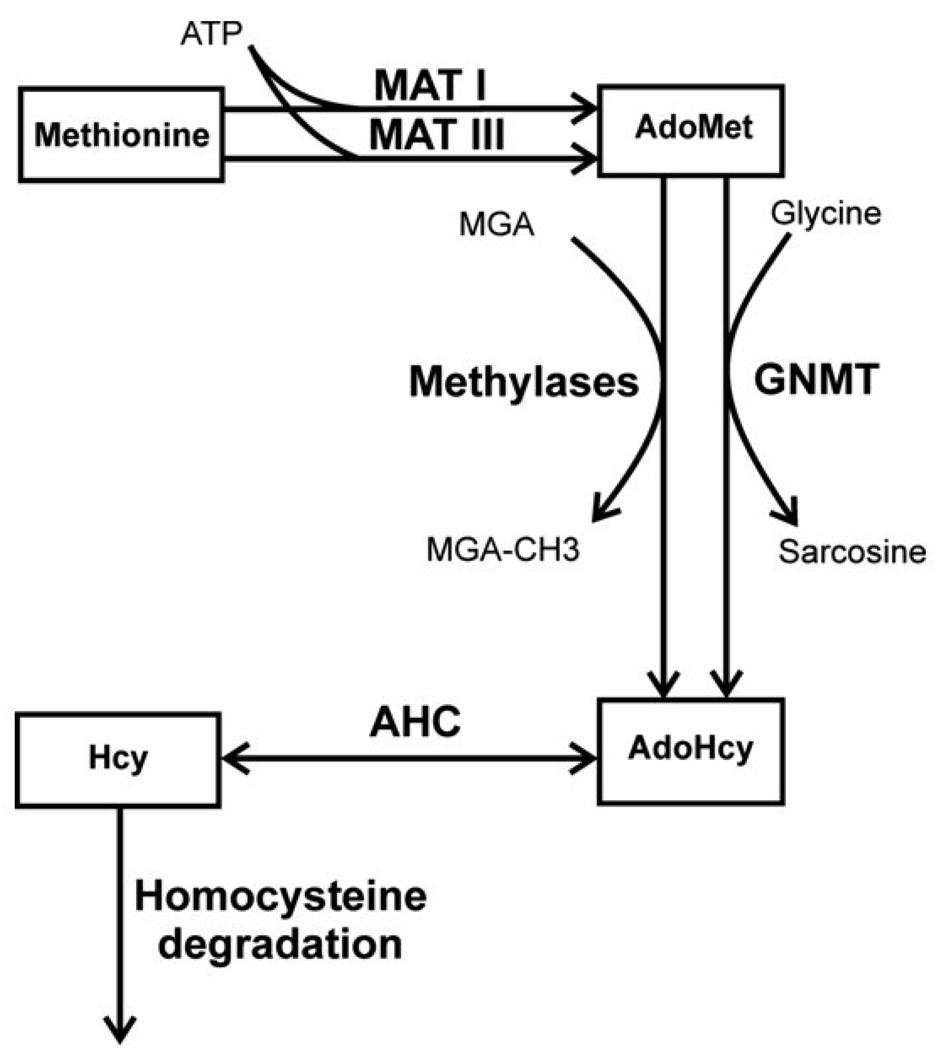
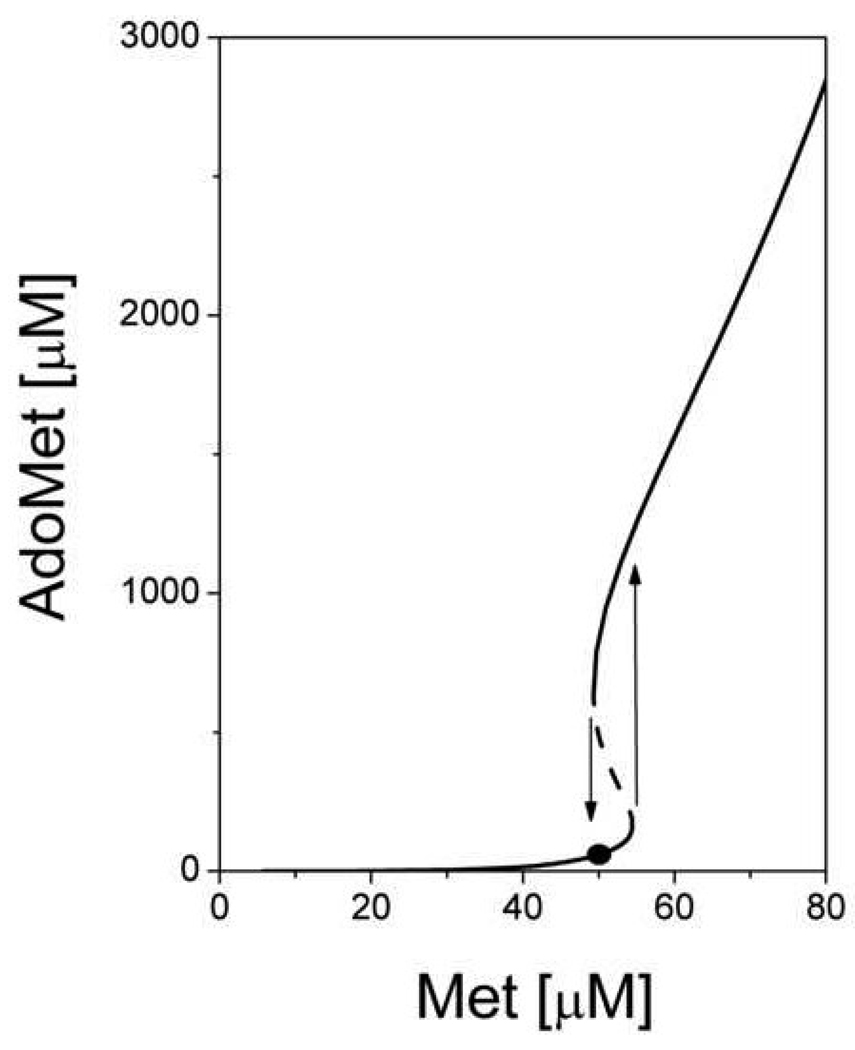
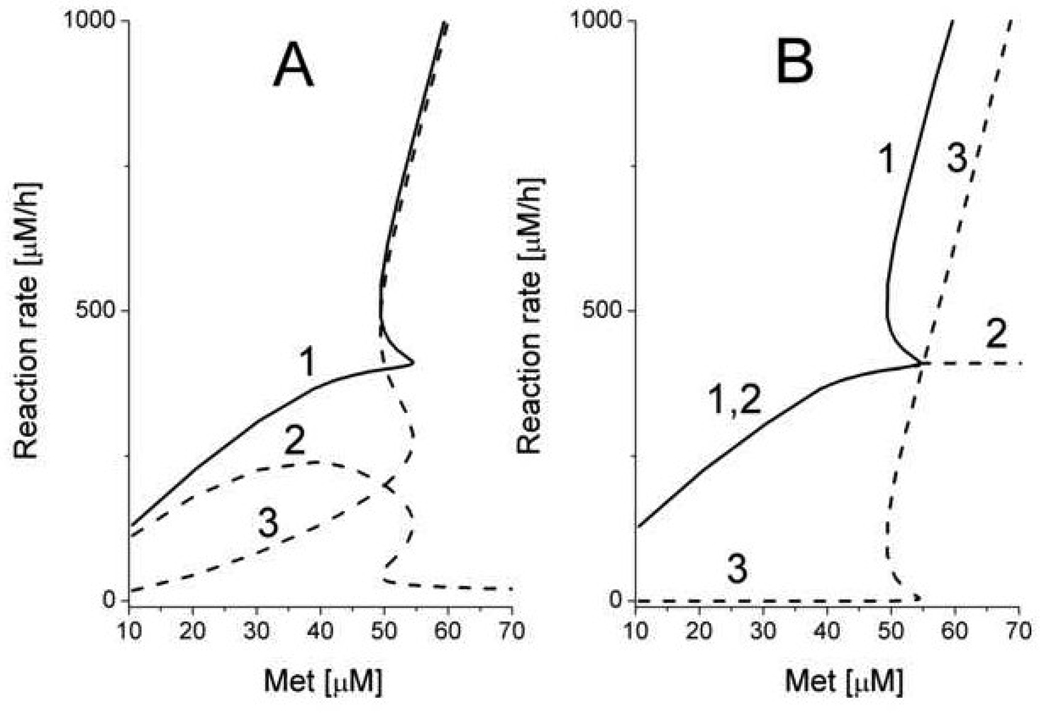
As a first step towards a theoretical understanding of the roles of MATI/III and GNMT in methionine metabolism, a minimal mathematical model describing hepatocyte methionine metabolism was developed [21]. This model included detailed descriptions of only the first three reactions in the methionine cycle connecting methionine to homocysteine (Fig.3). Methionine metabolism in the whole animal was not taken into account, and methionine concentration was considered as an input parameter. Transmethylation and transsulfuration reactions were represented as a single reaction for homocysteine disposal. This simple model featured pronounced bistability. Above a threshold methionine concentration of 54 µM it predicted a sharp jump in the stationary metabolite concentrations and metabolic rates. Thus, AdoMet concentrations increased more than 10-fold (Fig. 4) and simultaneously, a switch in metabolic flux occurred. At methionine concentrations below the threshold value, methionine metabolism operates in the “low” mode in which metabolite concentrations are low, and metabolic flux is determined by the demand on AdoMet by functional methylases (Fig. 5). In this mode, an increase in the functional methylases rate leads to a decrease in AdoMet concentration, which in turn leads to activation of MATI and to an increase in the total metabolic flux in the system in accordance with methylation demand. Conversely, metabolic flux decreases when the activity of methylases decrease. The flux through MATIII is small while the flux through GNMT is negligible. When methionine concentration is high, the system switches to a “high” mode. In this state, AdoMet concentrations are high and inhibit MATI while concomitantly activating MATIII. The rate of AdoMet production increases and exceeds methylation demand, which could lead to loss of the stationary state in metabolism. However, this situation is averted because at high AdoMet concentrations, the metabolic flux is routed through GNMT, which is significantly activated under such conditions. So in the “high” state, methionine metabolism has high metabolic flux that does not disturb functional methylases. Switching between the “low” and “high” states occurs in a narrow range of methionine concentrations (50–60 µM). This is the region of hysteresis, i.e. metabolism can be in the “low” or in “high” state depending on the system’s history.
Fig. 3.
The reduced (simplified) scheme of methionine metabolism in liver cells used for construction of the model of Martinov et al., 2000 [21]. The abbreviations used in this figure are described1. This figure is reproduced from [21] (Fig. 2) with permission obtained from the publisher and the authors.
Fig. 4.
Steady-state concentration of AdoMet as a function of methionine concentration obtained using the model of Martinov et al., 2000 [21]. The dashed line indicates unstable steady states. Arrows indicate jumps in the AdoMet concentration at threshold methionine concentrations. The solid circle indicates the physiological steady state in the “low” mode. This figure is reproduced from [21] (Fig. 6) with permission obtained from the publisher and the authors.
Fig. 5.
The dependence of steady-state rates of AdoMet production and AdoMet consumption on methionine concentration obtained from the model of Martinov et al., 2000 [21]. (A) The dependence of AdoMet production rate (1) and the rates of MATI (2) and MATIII (3) on methionine concentration. (B) The dependence of AdoMet consumption rate (1), and the rates of total methylases (2), and GNMT (3) on methionine concentration. This figure is reproduced from [21] (Fig. 7) with permission obtained from the publisher and the authors.
This bistability predicted by the mathematical model allows rationalization of two paradoxical aspects of liver methionine metabolism. First the simultaneous presence of the MAT isoforms, MATI and MATIII is explained by their usage in different metabolic modes, and second, the role of GNMT in the high mode is clarified. The conclusions from the computational work is in good agreement with experimental studies reported by Finkelstein’s group [20]. However, such a simple model has its limitations. First, it is unable to describe the distribution of metabolic flux in methionine metabolism between transmethylation and transsulfuration because the corresponding enzymes (MS, BHMT, and CBS) are not directly included in the model. Second, due to a simplified description of MATIII and GNMT kinetics, the model operates only within a narrow range of methionine concentrations i.e. 0–90 µM. At higher concentrations, the model loses its stationary state. Also, the switching time between “low” and “high” states is unrealistically long (10–20 h). Finally, the question of how regulation of methionine metabolism in hepatocytes influences methionine homeostasis in the whole organism cannot be evaluated using this model.
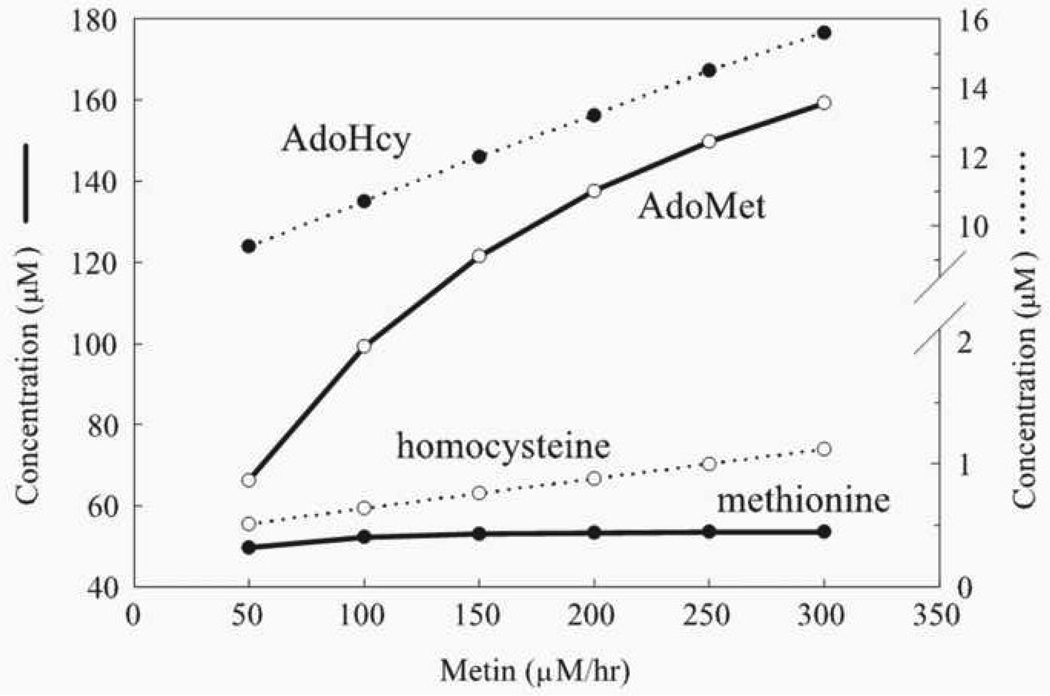
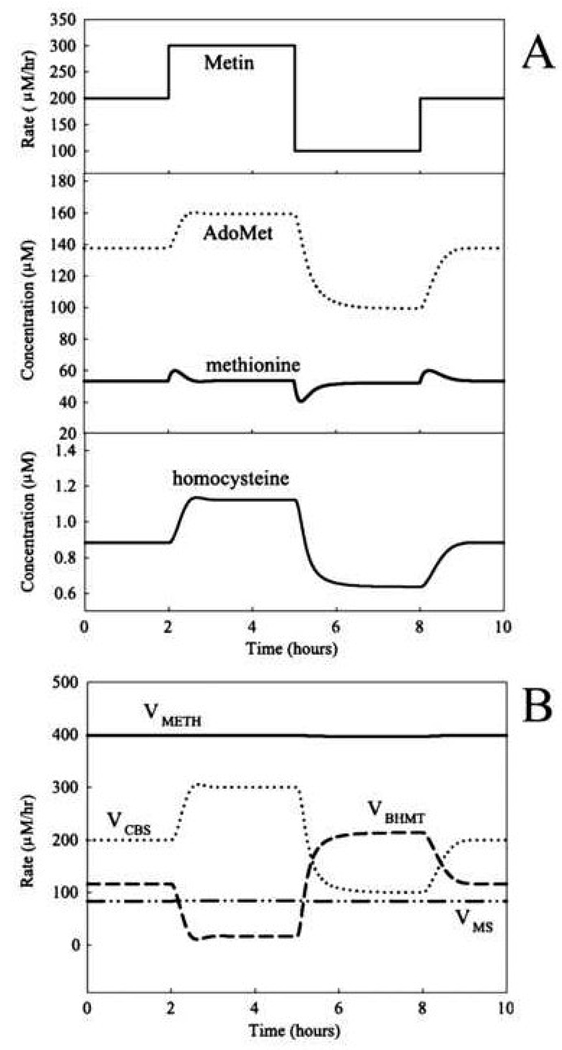
Reed and coworkers [22] extended the simplified model described above [21] by including a more detailed description of the transmethylation and transsulfuration reactions and using methionine influx rather than methionine concentration, as a model input parameter. Importantly, they found that the steady-state methionine concentration in hepatocytes is stabilized over a 6-fold increase in the rate of methionine influx (Fig. 6). This stabilization is predicted to result from a sharp increase in the rate of methionine consumption when methionine concentration increases, consistent with a switching of methionine metabolism from the “low” to “high” state, with the associated changes in metabolite levels and metabolic flux routes. This mechanism also can provide a dynamic stabilization of methionine levels at fluctuating methionine influx that mimics daily nutritional cycles. Only negligible variations in methionine concentration were obtained over 3-fold variations in methionine influx (Fig. 7). This is consistent with experimental data regarding stabilization of blood methionine levels [23].
Fig. 6.
The effect of methionine input (Metin) on the steady-state levels of four metabolites in the methionine cycle in the model of Reed et al., 2004 [22]. This figure is reproduced from [22] (Fig. 3) with permission obtained from the publisher and the authors.
Fig. 7.
The effects of dynamic changes in methionine input (Metin) on (A) metabolites and (B) the rates of methylation and the reactions that use homocysteine as a substrate in the model of Reed et al., 2004 [22]. This figure is reproduced from [22] (Fig. 4) with permission obtained from the publisher and the authors.
A limitation of this model is the simplistic linear approximation for allosteric effects (i.e. allosteric activation of CBS and inhibition of BHMT by AdoMet). This results in a rather narrow range of AdoMet concentration i.e., 20–180 µM, where the model has biological relevance since reversal of physiologically irreversible enzymes occurs outside this range (for CBS below 20 µM AdoMet and for BHMT above 180 µM AdoMet). It also possesses all the limitations of the earlier model that are associated with the simplified description of MATIII and GNMT kinetics.
To account for the role of allosteric regulation at other points in the metabolic cycle (i.e. inhibition of methylenetetrahydrofolate reductase (MTHFR) by AdoMet and of GNMT by MTHF) this model was significantly altered [24]. An important improvement was the inclusion of the MTHFR reaction and of a new variable, i.e. concentration of MTHF. However, the activities of MATI/III and GNMT were described as being 10-fold lower than the experimentally observed values and sigmoidal kinetics for GNMT were excluded. The rationale for modification of the MAT and GNMT kinetic parameters in the model was not explained, and their consequences on the regulation of methionine metabolism was not reported. Thus, it is unclear if bistability and two metabolic modes were still predicted by the model. Nevertheless, the model predicted that a decrease in AdoMet concentrations below physiological levels leads to inhibition of transsulfuration (via loss of allosteric activation of CBS) and activation of transmethylation (via reduced inhibition of BHMT and MTHFR). The consequence of this redistribution of metabolic fluxes is that methionine conservation is favored, thus supporting the normal functioning of methylases even at a very low methionine input. Subsequently, the model was extended by the addition of the cytosolic [25] and mitochondrial folate [26] metabolism and later still, of glutathione metabolism [27]. These models were used for simulation of different experimental and pathological situations [25–28] but regulation of methionine metabolism itself was not actually analyzed. The history of the developments in this model has been reviewed [29].
The most complicated model includes glutathione metabolism and describes more than 40 enzymatic reactions [27] and has been used for simulating the cellular response to oxidative stress. While the model does not permit quantitative comparison with experimental data it predicts an increase in GSH levels and activation of GSH synthesis under oxidative stress conditions that is consistent with experimental data [30–33]. The model incorporates redox sensitivity as activation of CBS and inhibition of MS and BHMT by hydrogen peroxide and inhibition of MATI/III by oxidized glutathione. However, because of the opposing effects of oxidative stress on CBS and MATI/III rates (activation and inhibition respectively) described in the model, it is not clear, a priori, if cysteine, and consequently, GSH production from methionine is activated or inhibited under oxidative stress conditions. The influence of oxidative stress on the rates of the corresponding enzymatic reactions as well as the rates of metabolic fluxes in methionine metabolism was not reported. Thus, the role of methionine metabolism in the oxidative stress response was not assessed despite the quantitative importance of methionine metabolism in many cell types to glutathione homeostasis and to antioxidant capacity [32, 34, 35]. Specifically, the transsulfuration pathway can be activated several fold under oxidative stress conditions resulting in a significant increase in glutathione synthesis [32, 33, 35].
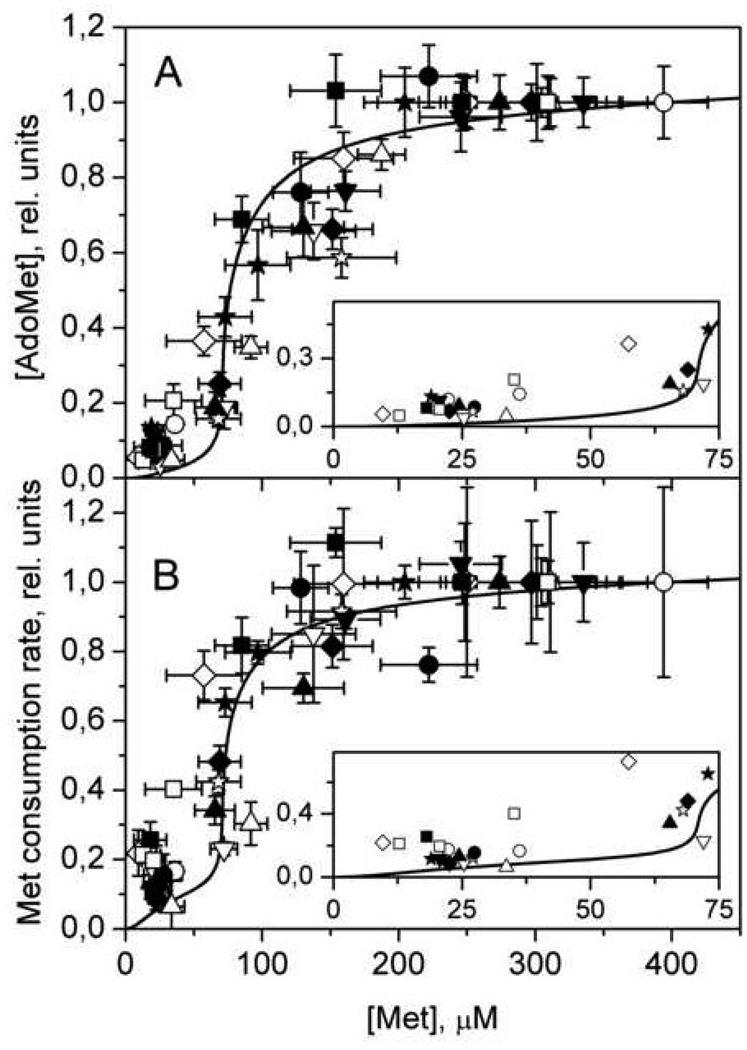
An important complement to mathematical modeling of metabolic systems is experimental verification of key model predictions. The novel tenet to emerge from our models of methionine metabolism was the sharp switching in metabolic mode in response to a monotonic increase in methionine concentration. Experimental evidence for this trigger behavior was recently furnished by studies on freshly isolated hepatocytes [36]. This study revealed that AdoMet and AdoHcy concentrations and methionine consumption rate increase sharply, ~10-fold in a narrow concentration range of 50–100 µM methionine (Fig.8).
Fig. 8.
The dependence of steady-state values of (A) AdoMet concentration and (B) the rate of methionine consumption on methionine concentration in murine hepatocytes. Symbols indicate experimental data obtained from 12 independent experiments, with each symbol representing a single experiment. Solid lines show the results of mathematical modeling. In each experiment, values for [AdoMet] and methionine consumption rate were normalized to values obtained at initial methionine concentration of 400 µM. The theoretical curves were normalized to values obtained at 400 µM methionine. The insets in both (A) and (B) show the experimental (symbols) and simulated (line) data in greater detail at low methionine concentrations. Error bars were removed in insets for clarity. This figure is reproduced from [36] (Fig. 3) with permission obtained from the publisher and the authors .
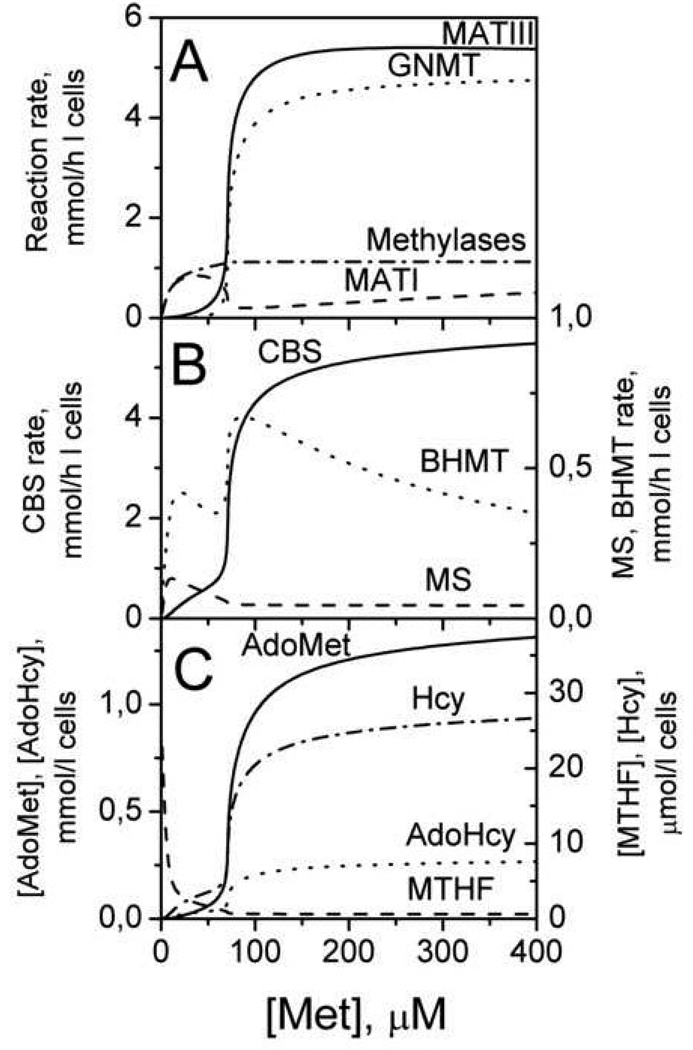
The recent iteration of the simplified mathematical model of methionine metabolism [21] includes a description of transmethylation and transsulfuration reactions and of folate metabolism to account for the regulation of MS. This detailed model [36] affords a quantitative description of a key feature of methionine regulation, that was experimentally verified and first predicted by the simple model [21], i.e. the methionine-responsive switching between the “low” and “high” modes. Furthermore, the model predicts that the switch from the “low” to “high” state in methionine metabolism is accompanied by a switch in the metabolic flux from transmethylation to transsulfuration (Fig. 9) and is elicited by the allosteric effector, AdoMet. In the “high” state, AdoMet activates CBS and inhibits MTHFR (and consequently, MS). A second important feature in metabolic flux switching is the difference in the KM for Hcy for transmethylation (~1–10 µM) versus the transsulfuration (~1 mM) enzymes. In the “high” state, the concentration of homocysteine exceeds the value of KMHcy for MS (Fig. 9C). Under these conditions, substrate-dependent acceleration of CBS by homocysteine is greater than that for MS and BHMT. The net effect of the “high” state on CBS is that it is allostericaly activated ~1.5-fold (by AdoMet) and accelerated by its substrate, homocysteine (~7-fold). Thus, when methionine concentration is high, metabolic flux favors disposal of excess methionine, converting it to cysteine and eventually to other sulfur compounds, such as, taurine and sulfate. When methionine concentration is low, the rate of the CBS reaction decreases, MTHFR and MS are activated, and the metabolic flux favors transmethylation and the methionine cycle, thus supporting the function of methylases. This model is the first to quantitatively describe the hepatic methionine network and its regulation.
Fig. 9.
The simulated methionine concentration dependence of steady-state reaction rates (A, B) and metabolite concentrations (C) in the liver methionine cycle. The enzyme and metabolite abbreviations denote the curves corresponding to their behavior. This figure is reproduced from [36] (Fig. 5) with permission obtained from the publisher and the authors.
In a recent simulation study, liver methionine metabolism was used to test the robustness of the model to a broad range of parameter values for making quantitative predictions about metabolite concentrations and flux [37]. This approach shows promise for correlated parameter identification for metabolic modeling in general but did not furnish new insights into the regulation of methionine metabolism.
Applications of the mathematical model to disease
The mathematical model of methionine metabolism has been used to predict the consequences of deficiencies in the methionine cycle enzymes or in their cofactors [22]. Decreases in MATI and MATIII activities in the model by 50% leads to an increase in methionine concentration by 70%, whereas the concentrations of other metabolites are not predicted to change, which is in qualitative agreement with the experimental data [38, 39 ]. A quantitative analysis of the consequences of deficiencies in the methionine pathway will require expansion of the mathematic model to include the description of extrahepatic methionine metabolism.
The mathematical model has also been used to analyze changes in the methionine cycle in malignant liver cells. Expression of MATII instead of MATI/III and repression of GNMT are considered to be specific features of hepatomas [40–44]. The model predicts that replacement of MATI/MATIII with MATII and repression of GNMT would lead to loss of the switch feature in methionine metabolism [24, 45]. Hence, transformed liver cells only operate in the “low” mode in which the dependence of metabolite concentrations and flux in the methionine cycle on the concentration of methionine is weak, and exhibits a hyperbolic dependence with KMMet of ~10 µM. This prediction was experimentally verified by measuring the metabolic response of the human hepatoma cell line, HepG2, to varying methionine concentrations [45].
The mathematical model has been useful for understanding the pathological consequences of seemingly innocuous regulatory domain mutations in CBS, which are nevertheless associated with hyperhomocysteinemia [45]. These mutations are characterized by normal to high CBS specific activities but are insensitive to allosteric regulation by AdoMet in contrast to wild-type CBS, which is activated 2- to 4-fold in response to AdoMet [46, 47]. Qualitatively, the model accounts for this behavior predicting a 1.5- to 3.0-fold increase in homocysteine concentration due to the complete loss of AdoMet-dependent regulation of CBS.
Future Perspectives
While mathematical modeling has provided important insights into how the methionine bionetwork fulfils the twin demands of maintaining methylation capacity and homeostasis over a range of dietary methionine concentrations, it has not been applied to the problem of how cysteine production is activated in response to oxidative stress. Methionine metabolism is intimately connected to glutathione-based redox homesotasis, and a significant fraction of glutathione can be produced from methionine via conversion of methionine to cysteine in the transsulfuration pathway. Inhibition of the transsulfuration pathway causes significant (up to 50%) decrease in glutathione concentration in cultured cells, including hepatocytes, HepG2 hepatoma cells, astrocytes, neurons, and immune cells [32, 35, 48, 49], as well as in different organs in vivo [50–52]. Activation of glutathione synthesis from methionine was observed in cultured HepG2 cells and in astrocytes [32, 35] under oxidative stress conditions. Additionally, individual enzymes in this network, e.g., MAT, MS, and CBS are reported to be redox sensitive [53–55]. Activation of cysteine (and consequently GSH) synthesis under oxidative stress conditions requires a substantial increase in metabolic flux through the methionine cycle, possibly involving switching into the “high” metabolic state. However the regulatory mechanism that renders the network sensitive to the cellular redox state remains to be described.
Another interesting problem that awaits analysis is the mechanism of stabilization of blood methionine levels. The existing models can account for stabilization of methionine levels at periodic variations of methionine input [22, 27, 36] that simulates food consumption and is consistent with experimental data [23]. However, to maintain normal methionine levels between dietary intake, the models need a small permanent methionine input. Without this, methionine levels in the model rapidly drops to zero. However, in vivo the blood methionine concentration is maintained even during prolonged starvation [56–58]. Hence, understanding the mechanism of blood methionine stabilization in the absence of methionine input is critical for understanding methionine homeostasis at the organismal level.
The utility of the mathematical model for understanding the metabolic consequences of specific enzyme deficiencies inherited as inborn errors of metabolism or mimicked in transgenic animals, has been underexploited. With the animal models, experimental verification of the system’s behavior should be possible with studies on hepatocytes. Similarly the potential modulation of this pathway by common polymorphic variants with disease correlations (e.g. in MTHFR [59] and in methionine synthase reductase [60]), is an open area that deserves attention. Finally, animal models for lifespan extension due to methionine restriction have been described [61–63]. The adaptive responses in liver and extrahepatic methionine metabolism under these conditions might lead to important insights into key metabolic nodes associated with aging.
Footnotes
Publisher's Disclaimer: This is a PDF file of an unedited manuscript that has been accepted for publication. As a service to our customers we are providing this early version of the manuscript. The manuscript will undergo copyediting, typesetting, and review of the resulting proof before it is published in its final citable form. Please note that during the production process errors may be discovered which could affect the content, and all legal disclaimers that apply to the journal pertain.
This work was supported in part by a grant from the National Institutes of Health (HL58984 to R.B.)
Abbreviations Used
AdoMet: S-adenosylmethionine,
AdoHcy: S-adenosylhomocysteine,
AHC: adenosylhomocysteinase,
BHMT: betaine homocysteine S-methyltransferase,
CBS: cystathionine β-synthase,
GSH: glutathione,
GNMT: glycine-N-methyltransferase,
Hcy: homocysteine,
MATI/II, III: methionine adenosyltransferase I/II,III,
MGA: methyl group acceptor
MS: methionine synthase,
MTHF: 5-methyltetrahydrofolate,
MTHFR: methylenetetrahydrofolate reductase.
References
- 1.Finkelstein JD. Inborn errors of sulfur-containing amino acid metabolism. J.Nutr. 2006;136:1750S–1754S. doi: 10.1093/jn/136.6.1750S. [DOI] [PubMed] [Google Scholar]
- 2.Beaudin AE, Stover PJ. Folate-mediated one-carbon metabolism and neural tube defects: balancing genome synthesis and gene expression. Defects Res C Embryo Today. 2007;81:183–203. doi: 10.1002/bdrc.20100. [DOI] [PubMed] [Google Scholar]
- 3.Mato JM, Martinez-Chantar ML, Lu SC. Methionine metabolism and liver disease. Annu Rev Nutr. 2008;28:273–293. doi: 10.1146/annurev.nutr.28.061807.155438. [DOI] [PubMed] [Google Scholar]
- 4.Tchantchou F, Shea TB. Folate deprivation, the methionine cycle, and Alzheimer's disease. Vitam Horm. 2008;79:83–97. doi: 10.1016/S0083-6729(08)00403-2. [DOI] [PubMed] [Google Scholar]
- 5.Yamada Y, Ichihara S, Nishida T. Molecular genetics of myocardial infarction. Genomic Med. 2008;2:7–22. doi: 10.1007/s11568-008-9025-x. [DOI] [PMC free article] [PubMed] [Google Scholar]
- 6.Riedijk MA, Stoll B, Chacko S, Schierbeek H, Sunehag AL, van Goudoever JB, Burrin DG. Methionine transmethylation and transsulfuration in the piglet gastrointestinal tract. Proc Natl Acad Sci U S A. 2007;104:3408–3413. doi: 10.1073/pnas.0607965104. [DOI] [PMC free article] [PubMed] [Google Scholar]
- 7.Kilberg MS, Handlogten ME, Christensen HN. Characteristics of system ASC for transport of neutral amino acids in the isolated rat hepatocyte. J.Biol.Chem. 1981;256:3304–3312. [PubMed] [Google Scholar]
- 8.Kilberg MS. Amino acid transport in isolated rat hepatocytes. J Membr Biol. 1982;69:1–12. doi: 10.1007/BF01871236. [DOI] [PubMed] [Google Scholar]
- 9.Schaffer S, Takahashi K, Azuma J. Role of osmoregulation in the actions of taurine. Amino Acids. 2000;19:527–546. doi: 10.1007/s007260070004. [DOI] [PubMed] [Google Scholar]
- 10.Stipanuk MH. Sulfur amino acid metabolism: pathways for production and removal of homocysteine and cysteine. Annu.Rev.Nutr. 2004;24:539–577. doi: 10.1146/annurev.nutr.24.012003.132418. [DOI] [PubMed] [Google Scholar]
- 11.Mudd HS, Levy HL, Skovby F. The Metabolic and Molecular Basis of Inherited Diseases. New York: McGraw-Hill; 1995. [Google Scholar]
- 12.Refsum H, Ueland PM, Nygard O, Vollset SE. Homocysteine and cardiovascular disease. Annu.Rev.Med. 1998;49:31–62. doi: 10.1146/annurev.med.49.1.31. [DOI] [PubMed] [Google Scholar]
- 13.Clarke R, Smith AD, Jobst KA, Refsum H, Sutton L, Ueland PM. Folate, vitamin B12, and serum total homocysteine levels in confirmed Alzheimer disease. Arch Neurol. 1998;55:1449–1455. doi: 10.1001/archneur.55.11.1449. [DOI] [PubMed] [Google Scholar]
- 14.Mills JL, McPartlin JM, Kirke PN, Lee YJ, Conley MR, Weir DG, Scott JM. Homocysteine metabolism in pregnancies complicated by neural-tube defects. Lancet. 1995;345:149–151. doi: 10.1016/s0140-6736(95)90165-5. [DOI] [PubMed] [Google Scholar]
- 15.Martignoni E, Tassorelli C, Nappi G, Zangaglia R, Pacchetti C, Blandini F. Homocysteine and Parkinson's disease: a dangerous liaison? J Neurol Sci. 2007;257:31–37. doi: 10.1016/j.jns.2007.01.028. [DOI] [PubMed] [Google Scholar]
- 16.Gil B, Casado M, Pajares MA, Bosca L, Mato JM, Martin-Sanz P, Alvarez L. Differential expression pattern of S-adenosylmethionine synthetase isoenzymes during rat liver development. Hepatology. 1996;24:876–881. doi: 10.1002/hep.510240420. [DOI] [PubMed] [Google Scholar]
- 17.Heady JE, Kerr SJ. Purification and characterization of glycine N-methyltransferase. J.Biol.Chem. 1973;248:69–72. [PubMed] [Google Scholar]
- 18.Ogawa H, Fujioka M. Purification and properties of glycine N-methyltransferase from rat liver. J.Biol.Chem. 1982;257:3447–3452. [PubMed] [Google Scholar]
- 19.Sreekumar A, Poisson LM, Rajendiran TM, Khan AP, Cao Q, Yu J, Laxman B, Mehra R, Lonigro RJ, Li Y, Nyati MK, Ahsan A, Kalyana-Sundaram S, Han B, Cao X, Byun J, Omenn GS, Ghosh D, Pennathur S, Alexander DC, Berger A, Shuster JR, Wei JT, Varambally S, Beecher C, Chinnaiyan AM. Metabolomic profiles delineate potential role for sarcosine in prostate cancer progression. Nature. 2009;457:910–914. doi: 10.1038/nature07762. [DOI] [PMC free article] [PubMed] [Google Scholar] [Research Misconduct Found]
- 20.Finkelstein JD, Martin JJ. Methionine metabolism in mammals. Adaptation to methionine excess. J.Biol.Chem. 1986;261:1582–1587. [PubMed] [Google Scholar]
- 21.Martinov MV, Vitvitsky VM, Mosharov EV, Banerjee R, Ataullakhanov FI. A substrate switch: a new mode of regulation in the methionine metabolic pathway. J.Theor.Biol. 2000;204:521–532. doi: 10.1006/jtbi.2000.2035. [DOI] [PubMed] [Google Scholar]
- 22.Reed MC, Nijhout HF, Sparks R, Ulrich CM. A mathematical model of the methionine cycle. J.Theor.Biol. 2004;226:33–43. doi: 10.1016/j.jtbi.2003.08.001. [DOI] [PubMed] [Google Scholar]
- 23.Forslund AH, Hambraeus L, van BH, Holmback U, El-Khoury AE, Hjorth G, Olsson R, Stridsberg M, Wide L, Akerfeldt T, Regan M, Young VR. Inverse relationship between protein intake and plasma free amino acids in healthy men at physical exercise. Am.J.Physiol Endocrinol.Metab. 2000;278:E857–E867. doi: 10.1152/ajpendo.2000.278.5.E857. [DOI] [PubMed] [Google Scholar]
- 24.Nijhout HF, Reed MC, Anderson DF, Mattingly JC, James SJ, Ulrich CM. Long-range allosteric interactions between the folate and methionine cycles stabilize DNA methylation reaction rate. Epigenetics. 2006;1:81–87. doi: 10.4161/epi.1.2.2677. [DOI] [PubMed] [Google Scholar]
- 25.Reed MC, Nijhout HF, Neuhouser ML, Gregory JF, 3rd, Shane B, James SJ, Boynton A, Ulrich CM. A mathematical model gives insights into nutritional and genetic aspects of folate-mediated one-carbon metabolism. J Nutr. 2006;136:2653–2661. doi: 10.1093/jn/136.10.2653. [DOI] [PubMed] [Google Scholar]
- 26.Nijhout HF, Reed MC, Lam SL, Shane B, Gregory JF, 3rd, Ulrich CM. In silico experimentation with a model of hepatic mitochondrial folate metabolism. Theor Biol Med Model. 2006;3:40. doi: 10.1186/1742-4682-3-40. [DOI] [PMC free article] [PubMed] [Google Scholar]
- 27.Reed MC, Thomas RL, Pavisic J, James SJ, Ulrich CM, Nijhout HF. A mathematical model of glutathione metabolism. Theor Biol Med Model. 2008;5:8. doi: 10.1186/1742-4682-5-8. [DOI] [PMC free article] [PubMed] [Google Scholar]
- 28.Nijhout HF, Gregory JF, Fitzpatrick C, Cho E, Lamers KY, Ulrich CM, Reed MC. A mathematical model gives insights into the effects of vitamin B-6 deficiency on 1-carbon and glutathione metabolism. J Nutr. 2009;139:784–791. doi: 10.3945/jn.109.104265. [DOI] [PMC free article] [PubMed] [Google Scholar]
- 29.Nijhout HF, Reed MC, Ulrich CM. Mathematical models of folate-mediated one-carbon metabolism. Vitam Horm. 2008;79:45–82. doi: 10.1016/S0083-6729(08)00402-0. [DOI] [PubMed] [Google Scholar]
- 30.Rahman I, Bel A, Mulier B, Lawson MF, Harrison DJ, Macnee W, Smith CA. Transcriptional regulation of gamma-glutamylcysteine synthetase-heavy subunit by oxidants in human alveolar epithelial cells. Biochem Biophys Res Commun. 1996;229:832–837. doi: 10.1006/bbrc.1996.1888. [DOI] [PubMed] [Google Scholar]
- 31.Choi J, Liu RM, Forman HJ. Adaptation to oxidative stress: quinone-mediated protection of signaling in rat lung epithelial L2 cells. Biochem Pharmacol. 1997;53:987–993. doi: 10.1016/s0006-2952(96)00867-2. [DOI] [PubMed] [Google Scholar]
- 32.Vitvitsky V, Thomas M, Ghorpade A, Gendelman HE, Banerjee R. A functional transsulfuration pathway in brain links to glutathione homeostasis. J.Biol.Chem. 2006 doi: 10.1074/jbc.M602799200. [DOI] [PubMed] [Google Scholar]
- 33.Vitvitsky V, Mosharov E, Tritt M, Ataullakhanov F, Banerjee R. Redox regulation of homocysteine-dependent glutathione synthesis. Redox.Rep. 2003;8:57–63. doi: 10.1179/135100003125001260. [DOI] [PubMed] [Google Scholar]
- 34.Vitvitsky V, Dayal S, Stabler S, Zhou Y, Wang H, Lentz SR, Banerjee R. Perturbations in homocysteine-linked redox homeostasis in a murine model for hyperhomocysteinemia. Am.J.Physiol Regul.Integr.Comp Physiol. 2004;287:R39–R46. doi: 10.1152/ajpregu.00036.2004. [DOI] [PubMed] [Google Scholar]
- 35.Mosharov E, Cranford MR, Banerjee R. The quantitatively important relationship between homocysteine metabolism and glutathione synthesis by the transsulfuration pathway and its regulation by redox changes. Biochemistry. 2000;39:13005–13011. doi: 10.1021/bi001088w. [DOI] [PubMed] [Google Scholar]
- 36.Korendyaseva TK, Kuvatov DN, Volkov VA, Martinov MV, Vitvitsky VM, Banerjee R, Ataullakhanov FI. An allosteric mechanism for switching between parallel tracks in mammalian sulfur metabolism. PLoS Comput Biol. 2008;4:e1000076. doi: 10.1371/journal.pcbi.1000076. [DOI] [PMC free article] [PubMed] [Google Scholar]
- 37.Piazza M, Feng XJ, Rabinowitz JD, Rabitz H. Diverse metabolic model parameters generate similar methionine cycle dynamics. J Theor Biol. 2008;251:628–639. doi: 10.1016/j.jtbi.2007.12.009. [DOI] [PMC free article] [PubMed] [Google Scholar]
- 38.Chamberlin ME, Ubagai T, Mudd SH, Thomas J, Pao VY, Nguyen TK, Levy HL, Greene C, Freehauf C, Chou JY. Methionine adenosyltransferase I/III deficiency: novel mutations and clinical variations. Am J Hum Genet. 2000;66:347–355. doi: 10.1086/302752. [DOI] [PMC free article] [PubMed] [Google Scholar]
- 39.Kim SZ, Santamaria E, Jeong TE, Levy HL, Mato JM, Corrales FJ, Mudd SH. Methionine adenosyltransferase I/III deficiency: two Korean compound heterozygous siblings with a novel mutation. J Inherit Metab Dis. 2002;25:661–671. doi: 10.1023/a:1022829214415. [DOI] [PubMed] [Google Scholar]
- 40.Cai J, Sun WM, Hwang JJ, Stain SC, Lu SC. Changes in S-adenosylmethionine synthetase in human liver cancer: molecular characterization and significance. Hepatology. 1996;24:1090–1097. doi: 10.1002/hep.510240519. [DOI] [PubMed] [Google Scholar]
- 41.Avila MA, Berasain C, Torres L, Martin-Duce A, Corrales FJ, Yang H, Prieto J, Lu SC, Caballeria J, Rodes J, Mato JM. Reduced mRNA abundance of the main enzymes involved in methionine metabolism in human liver cirrhosis and hepatocellular carcinoma. J.Hepatol. 2000;33:907–914. doi: 10.1016/s0168-8278(00)80122-1. [DOI] [PubMed] [Google Scholar]
- 42.Kerr SJ. Competing methyltransferase systems. J.Biol.Chem. 1972;247:4248–4252. [PubMed] [Google Scholar]
- 43.Chen YM, Shiu JY, Tzeng SJ, Shih LS, Chen YJ, Lui WY, Chen PH. Characterization of glycine-N-methyltransferase-gene expression in human hepatocellular carcinoma. Int.J.Cancer. 1998;75:787–793. doi: 10.1002/(sici)1097-0215(19980302)75:5<787::aid-ijc20>3.0.co;2-2. [DOI] [PubMed] [Google Scholar]
- 44.Liu HH, Chen KH, Shih YP, Lui WY, Wong FH, Chen YM. Characterization of reduced expression of glycine N-methyltransferase in cancerous hepatic tissues using two newly developed monoclonal antibodies. J.Biomed.Sci. 2003;10:87–97. doi: 10.1007/BF02256001. [DOI] [PubMed] [Google Scholar]
- 45.Prudova A, Martinov MV, Vitvitsky VM, Ataullakhanov FI, Banerjee R. Analysis of pathological defects in methionine metabolism using a simple mathematical model. Biochim.Biophys.Acta. 2005;1741:331–338. doi: 10.1016/j.bbadis.2005.04.008. [DOI] [PubMed] [Google Scholar]
- 46.Janosik M, Kery V, Gaustadnes M, Maclean KN, Kraus JP. Regulation of human cystathionine beta-synthase by S-adenosyl-L-methionine: evidence for two catalytically active conformations involving an atoinhibitory domain in the C-terminal region. Biochemistry. 40;2001:10625–10633. doi: 10.1021/bi010711p. [DOI] [PubMed] [Google Scholar]
- 47.Evande R, Blom H, Boers GH, Banerjee R. Alleviation of intrasteric inhibition by the pathogenic activation domain mutation, D444N, in human cystathionine beta-synthase. Biochemistry. 2002;41:11832–11837. doi: 10.1021/bi026248d. [DOI] [PubMed] [Google Scholar]
- 48.Beatty PW, Reed DJ. Involvement of the cystathionine pathway in the biosynthesis of glutathione by isolated rat hepatocytes. Arch Biochem Biophys. 1980;204:80–87. doi: 10.1016/0003-9861(80)90009-0. [DOI] [PubMed] [Google Scholar]
- 49.Garg S, Vitvitsky V, Gendelman HE, Banerjee R. Monocyte differentiation, activation, and mycobacterial killing are linked to transsulfuration-dependent redox metabolism. J Biol Chem. 2006;281:38712–38720. doi: 10.1074/jbc.M606235200. [DOI] [PubMed] [Google Scholar]
- 50.Diwakar L, Ravindranath V. Inhibition of cystathionine-gamma-lyase leads to loss of glutathione and aggravation of mitochondrial dysfunction mediated by excitatory amino acid in the CNS. Neurochem Int. 2007;50:418–426. doi: 10.1016/j.neuint.2006.09.014. [DOI] [PubMed] [Google Scholar]
- 51.Triguero A, Barber T, Garcia C, Puertes IR, Sastre J, Vina JR. Liver intracellular L-cysteine concentration is maintained after inhibition of the trans-sulfuration pathway by propargylglycine in rats. Br J Nutr. 1997;78:823–831. doi: 10.1079/bjn19970198. [DOI] [PubMed] [Google Scholar]
- 52.Cho ES, Hovanec-Brown J, Tomanek RJ, Stegink LD. Propargylglycine infusion effects on tissue glutathione levels, plasma amino acid concentrations and tissue morphology in parenterally-fed growing rats. J Nutr. 1991;121:785–794. doi: 10.1093/jn/121.6.785. [DOI] [PubMed] [Google Scholar]
- 53.Ruiz F, Miqueo CFJC, Mato JM. Nitric oxide inactivates rat hepatic methionine adenosyltransferase in vivo by S-nitrosylation. Hepatology. 1998;28:1051–1057. doi: 10.1002/hep.510280420. [DOI] [PubMed] [Google Scholar]
- 54.Olteanu H, Banerjee R. Human Methionine Synthase Reductase, a Soluble P450 Reductase-like Dual Flavoprotein, is Sufficient for Methionine Synthase Activation. J. Biol. Chem. 2001;276:35558–35563. doi: 10.1074/jbc.M103707200. [DOI] [PubMed] [Google Scholar]
- 55.Singh S, Madzelan P, Stasser J, Weeks CL, Becker D, Spiro TG, Penner-Hahn J, Banerjee R. Modulation of the Heme Electronic Structure and Cystathionine beta-synthase Activity by Second Coordination Sphere Ligands: The Role of Heme Ligand Switching in Redox Regulation. J. Inorg. Biochem. 2009 doi: 10.1016/j.jinorgbio.2009.01.009. [DOI] [PMC free article] [PubMed] [Google Scholar]
- 56.Achouri Y, Robbi M, Van Schaftingen E. Role of cysteine in the dietary control of the expression of 3-phosphoglycerate dehydrogenase in rat liver. Biochem J. 1999;344(Pt 1):15–21. [PMC free article] [PubMed] [Google Scholar]
- 57.Adibi SA. Interrelationships between level of amino acids in plasma and tissues during starvation. Am J Physiol. 1971;221:829–838. doi: 10.1152/ajplegacy.1971.221.3.829. [DOI] [PubMed] [Google Scholar]
- 58.Martensson J. The effect of fasting on leukocyte and plasma glutathione and sulfur amino acid concentrations. Metabolism. 1986;35:118–121. doi: 10.1016/0026-0495(86)90110-1. [DOI] [PubMed] [Google Scholar]
- 59.Goyette P, Simmer JS, Milos R, Duncan AMV, Rosenblatt DS, Matthews RG, Rozen R. Human methylenetetrahydrofolate reductase:isolateion of cDNA, mapping, and mutation identification. Nature Genetics. 1994;7:195–200. doi: 10.1038/ng0694-195. [DOI] [PubMed] [Google Scholar]
- 60.Gherasim C, Rosenblatt DS, Banerjee R. Polymorphic background of methionine synthase reductase modulates the phenotype of a disease-causing mutation. Hum Mutat. 2007;28:1028–1033. doi: 10.1002/humu.20563. [DOI] [PubMed] [Google Scholar]
- 61.Orentreich N, Matias JR, DeFelice A, Zimmerman JA. Low methionine ingestion by rats extends life span. J Nutr. 1993;123:269–274. doi: 10.1093/jn/123.2.269. [DOI] [PubMed] [Google Scholar]
- 62.Miller RA, Buehner G, Chang Y, Harper JM, Sigler R, Smith-Wheelock M. Methionine-deficient diet extends mouse lifespan, slows immune and lens aging, alters glucose, T4, IGF-I and insulin levels, and increases hepatocyte MIF levels and stress resistance. Aging Cell. 2005;4:119–125. doi: 10.1111/j.1474-9726.2005.00152.x. [DOI] [PMC free article] [PubMed] [Google Scholar]
- 63.Sun L, Sadighi Akha AA, Miller RA, Harper JM. Life-span extension in mice by preweaning food restriction and by methionine restriction in middle age. J Gerontol A Biol Sci Med Sci. 2009;64:711–722. doi: 10.1093/gerona/glp051. [DOI] [PMC free article] [PubMed] [Google Scholar]


