

Abstract
The semiacute phase of mild traumatic brain injury (mTBI) is associated with deficits in the cognitive domains of attention, memory, and executive function, which previous work suggests may be related to a specific deficit in disengaging attentional focus. However, to date, there have only been a few studies that have employed dynamic imaging techniques to investigate the potential neurological basis of these cognitive deficits during the semiacute stage of injury. Therefore, event‐related functional magnetic resonance imaging was used to investigate the neurological correlates of attentional dysfunction in a clinically homogeneous sample of 16 patients with mTBI during the semiacute phase of injury (<3 weeks). Behaviorally, patients with mTBI exhibited deficits in disengaging and reorienting auditory attention following invalid cues as well as a failure to inhibit attentional allocation to a cued spatial location compared to a group of matched controls. Accordingly, patients with mTBI also exhibited hypoactivation within thalamus, striatum, midbrain nuclei, and cerebellum across all trials as well as hypoactivation in the right posterior parietal cortex, presupplementary motor area, bilateral frontal eye fields, and right ventrolateral prefrontal cortex during attentional disengagement. Finally, the hemodynamic response within several regions of the attentional network predicted response times better for controls than for patients with mTBI. These objective neurological findings represent a potential biomarker for the behavioral deficits in spatial attention that characterize the initial recovery phase of mTBI. Hum Brain Mapp, 2009. © 2009 Wiley‐Liss, Inc.
Keywords: traumatic brain injury, attention, auditory, bottom‐up, orienting, FMRI
INTRODUCTION
Mild traumatic brain injury (mTBI) remains a poorly understood clinical phenomenon, despite lifetime incidence rates between 110 and 550 per 100,000 individuals (Belanger et al.,2007; Bigler,2008). Meta‐analyses indicate that mTBI is associated with subtle cognitive deficits (moderate effect sizes) during the semiacute phase of injury, but that these deficits typically improve within 3–6 months (Belanger and Vanderploeg,2005; Belanger et al.,2005; Schretlen and Shapiro,2003). Common deficits include problems with executive functioning, working memory, and attention (Belanger et al.,2007; McAllister et al.,2006), all of which are mediated by distributed fronto‐parietal circuits (Cabeza and Nyberg,2000). However, to date, little is known about the putative neurobiological changes that may underlie this temporary disruption in cognitive functioning. Results from traditional neuroimaging techniques such as computed tomography (CT) and magnetic resonance imaging (MRI) are usually negative, indicating overt pathology in only 5–12% of cases [Belanger et al.,2007; Hughes et al.,2004; Sturzenegger et al.,2008; Topal et al.,2008; but see Lee et al. (2008)].
Functional MRI (FMRI) offers great promise for elucidating the potential mechanisms causing cognitive deficits, given its capability for measuring the dynamic changes in neural functioning that characterize higher‐order cognition (Belanger et al.,2007; McAllister et al.,2006). However, the majority of FMRI studies to date suffer from significant limitations, including substantial clinical heterogeneity in terms of both injury severity (e.g., sample consists of patients with mild, moderate, and severe TBI) and time postinjury (e.g., scan‐time ranges from days to years postinjury), as well as small sample sizes (n < 8). This heterogeneity hampers analyses of pathology, given the very significant individual variation in recovery trajectories that characterizes different subgroups of TBI. Specifically, patients with moderate to severe TBI may take years to recover or may never fully recover at all (Thurman et al.,1999). In contrast, although patients with mTBI usually exhibit some form of cognitive deficit for a few days to weeks postinjury, 80–95% of patients fully recover within the first 3–6 months of injury (Belanger et al.,2005,2007; Bigler,2008; Iverson,2005; Schretlen and Shapiro,2003). These clinical observations indicate the need for neuroimaging studies based on homogeneous samples (i.e., only patients with mTBI) in the acute or semiacute phase of injury (i.e., within several weeks postinjury) when cognitive deficits are expected, rather than months later when they are quite atypical.
The few FMRI studies on mTBI with adequate sample sizes (n > 8) have focused on working memory paradigms, with results suggesting a complex relationship between cognitive load and functional activation that is not easily characterized. In a series of studies on semiacute (within 1 month of injury) patients with mTBI, McAllister et al. (1999) reported hyperactivation in right dorsolateral prefrontal cortex and lateral parietal regions for patients with mTBI compared to healthy controls (HC) for moderate processing loads (1‐back to 2‐back), but hypoactivation for the 0‐ to 1‐back task. Additional work indicated that patients with mTBI exhibited fronto‐parietal hyperactivation going from the 1‐back to 2‐back condition, but hypoactivation going from 2‐ to 3‐back (McAllister et al.,2001). A more recent study reported a positive correlation between self‐report measures of symptom severity and increased activation within the working memory network (e.g., dorsolateral and ventrolateral prefrontal cortex), as well as a correlation between hyperactivation outside of the traditional network and self‐reported symptomatology (Smits et al., in press). Other working memory studies have examined concussed athletes within 3–6 months of injury. Results indicated hypoactivation in the prefrontal cortex and anterior cingulate gyrus for concussed individuals compared to healthy controls coupled with hyperactivation in temporal and parietal (Chen et al.,2004,2007) lobes for the concussed group. The reduction in activation was also shown to be negatively related to scores on a postconcussion scale, suggesting that greater self‐reported symptom severity predicts the magnitude of the BOLD response abnormality (Chen et al.,2007). Finally, a recent study by the same group indicated that concussed athletes with depression exhibited hypoactivation within the dorsolateral prefrontal cortex and reduced deactivation during working memory in the anterior cingulate gyrus and temporal lobes compared to both controls and patients without depression (Chen et al.,2008).
Only a few imaging studies have examined attentional or executive functioning in TBI (Kim et al., in press; Scheibel et al.,2007; Soeda et al.,2005; Turner and Levine,2008), with the majority of studies being limited to more severely injured populations. Similar to their results from the working memory paradigm, Smits et al. (in press) reported increased activation within the anterior cingulate gyrus, inferior frontal gyrus, insula, and posterior parietal areas with increased incidence of postconcussive symptoms in mTBI. Recent behavioral studies suggest that participants with TBI may experience difficulty with basic attentional processes such as eye movements (Kraus et al.,2007) and spatial orienting (Drew et al.,2007; Halterman et al.,2006; Pavlovskaya et al.,2007). For example, patients with TBI experience greater difficulties making leftwards than rightwards shifts of spatial attention, a deficit that was ameliorated following treatment with methylphenidate (Pavlovskaya et al.,2007). Other behavioral studies have demonstrated that both spatial orienting and gap saccades are typically impaired in the semiacute stages of mTBI (Drew et al.,2007; Halterman et al.,2006), and that difficulties with disengagement, i.e. shifting attention from one focused target to another, might account for the majority of attentional deficits observed in this population.
A neuroimaging study examining bottom–up attentional orienting in mTBI could therefore offer important new information about the neuroanatomic substrate of the putative disengagement deficit (e.g., frontal or parietal lobes) and how it is related to observed deficits in behavioral performance. Several specific cognitive operations must occur in close temporal proximity for organisms to orient their attention and localize a target in extrapersonal space (Corbetta et al.,2000; Mayer et al.,2007; Thiel et al.,2004). During valid trials (target appears in cued location), participants must first identify the cue, shift their attention to the cued location, identify the location of the target, and finally, respond with a button press. Invalid trials (target appears in uncued location) have the additional requirement of disengaging and reorienting attention to the target's new location. Therefore, when the stimulus onset asynchrony (SOA) between the cue and target is less than 250 ms, invalid trials are typically associated with longer response times and increased activation within the supplementary motor area (SMA), frontal eye fields (FEFs), and inferior parietal lobes (IPLs) (Arrington et al.,2000; Corbetta et al.,2000; Mayer et al.,2004a,2007; Thiel et al.,2004).
At longer SOAs during bottom–up (i.e., exogenous) orienting, the relationship between valid and invalid trials typically inverts so that response times become faster for invalidly compared to validly cued trials (see Fig. 2B for example). This reversal in reaction time has traditionally been called inhibition of return (IOR) and is believed to be either an evolutionary mechanism to promote novelty recognition in the spatial environment or an inhibitory mechanism to prevent repetitive eye movements. This reversal in behavioral data (i.e., slower reaction times for validly compared to invalidly cued trials) is frequently mirrored by an equalization or reversal in functional activation in frontal and parietal sites compared to the greater activation that is observed for invalidly cued trials during shorter SOAs (Lepsien and Pollmann,2002; Mayer et al.,2007).
Figure 2.

Graphs A and B depict reaction time (RT) in milliseconds (ms) for patients with mild traumatic brain injury (mTBI: Panel A) and healthy controls (HC: Panel B) for valid and invalid trials at both 200 and 700 ms stimulus onset asynchronies (SOA). Panel C depicts difference scores between invalid and valid trials for HC (white bars) and patients with mTBI (dark gray bars) at the 200 ms (facilitation; FAC) and 700 ms (inhibition of response; IOR) SOA.
In the current experiment, we predicted that patients with mTBI compared to controls would exhibit both greater reaction times for invalidly cued trials at the short SOA as well as hypoactivation in the disengagement network (SMA, FEF, and IPL) indicative of attentional failures. Likewise, we predicted that patients with mTBI would fail to exhibit IOR for both the behavioral and functional data at longer SOAs. Finally, we predicted that the magnitude of activation within the inferior parietal lobes and frontal oculomotor sites would account for significant variance on behavioral measures of functioning for HC but not for patients with mTBI.
METHODS
Participants
Sixteen patients with mTBI (eight males, eight females; 27.2 ± 7.62 years old; 13.1 ± 2.5 years of education) and sixteen gender‐, age‐, and education‐matched controls (27.3 ± 7.43 years old; 14.4 ± 2.3 years of education) were recruited for the current study. There were no significant differences between groups (P > 0.10) on any of these major demographic variables or for hand preference as assessed by the Edinburgh Handedness Inventory (Oldfield,1971). All patients with mTBI experienced a closed head injury resulting in an alteration in mental status. Patients were evaluated both clinically (mean day postinjury = 11.47 ± 5.34) and with brain imaging (mean day postinjury = 11.88 ± 5.9) within 21 days of injury (see Supporting Information Table I). One patient with mTBI was not able to complete neuropsychological testing within 21 days of injury due to transportation difficulties. Additional inclusion criteria were based on the American Congress of Rehabilitory Medicine and included a Glasgow Coma Score of 13–15 (at presentation in the emergency room), loss of consciousness (if present) limited to 30 min in duration, and post‐traumatic amnesia limited to a 24‐hour period. Participants with mild TBI and controls were excluded if there was a positive history of neurological disease, psychiatric disturbance, additional closed head injuries with more than 5 min loss of consciousness, learning disorder, ADHD, or a history of substance or alcohol abuse. At the time of assessment, three of the subjects with mTBI were being prescribed narcotic medications for pain.1 Informed consent was obtained from subjects according to institutional guidelines at the University of New Mexico.
Clinical Assessment
To reduce redundancy amongst similar neuropsychological measures, composite indices were calculated for the following cognitive domains: attention [Trails A, Paced Auditory Serial Addition Test, Stroop (color‐word and interference scores), and Wechsler Adult Intelligence Scale‐Third Edition (WAIS‐III) digit span], working memory (WAIS‐III letter number sequence, arithmetic, and digits backward), processing speed [grooved pegboard (dominant and nondominant hand) and WAIS‐III digit symbol coding], executive function [Wisconsin Card Sort (errors and perseverative errors), Trails B, and Controlled Oral Word Association FAS test], and memory (California Verbal Learning Test—Second Edition: immediate recall, short‐delay free recall, long‐delay free recall). Composite measures of emotional status (State‐Trait Anxiety Index and Beck Depression Inventory—Second Edition), somatic complaints (Neurobehavioral Symptom Checklist) and cognitive complaints (Neurobehavioral Symptom Checklist) were also assessed. Within each cognitive and psychological domain (with the exception of Neurobehavioral Symptom measures), the relevant test scores were converted to T‐scores (mean = 50, SD = 10) using published age‐specific norms and then averaged to provide an overall composite score. The Wechsler Test of Adult Reading (WTAR) was also used to provide an estimate of overall premorbid intellectual functioning. The Test of Memory and Malingering allowed assessment of participant effort and cooperation. Please see Lezak et al. (2004) for references to all tests.
Task
All participants completed a bottom–up auditory orienting task while undergoing FMRI on a 3.0 T Siemens Trio scanner (see Fig. 1). Participants rested supine in the scanner with their head secured by a forehead strap, with additional foam padding to limit head motion within the head coil. Presentation software (Neurobehavioral Systems) was used for stimulus presentation, synchronization of stimulus events with the MRI scanner, and recording of response times. A white visual fixation cross (visual angle = 1.02°) on a black background was rear‐projected using a Sharp XG‐C50X LCD projector onto an opaque white Plexiglas projection screen.
Figure 1.
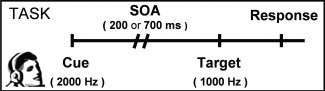
This figure is a diagrammatic representation of the auditory orienting task. Headphones were used to present a 2,000‐Hz pure tone (cue) followed by a 1,000‐Hz tone (target). Cues correctly predicted the target location (valid trials) on half of the trials. The stimulus onset asynchrony (SOA) between cues and targets was either 200 or 700 ms. Participants responded to the target location by pressing a button with their right index (left target) or middle (right target) finger.
Auditory stimuli were presented with an Avotec Silent Scan 3100 Series System. The first tone pip (2,000 Hz) served as a spatial cue that correctly (i.e., valid trials) predicted the location of a second target tone pip (1,000 Hz) on 50% of the experimental trials (e.g., both cue and target occurred in right headphone). On the remainder of the trials the cue incorrectly (i.e., invalid trials) predicted target location (e.g., cue and target occurred in opposite headphones). To maximize bottom–up orienting effects, participants were informed that the cues did not contain any useful information about the location of the target prior to the start of the experiment. Both tones were sampled with a 10 ms linear onset‐offset ramp to reduce the occurrence of clicks during auditory stimulus presentation. The SOA between the cue and the target was either 200 ms (facilitation) or 700 ms (IOR), and SOA and trial‐type (valid versus invalid) were randomly varied throughout the experiment. Participants were instructed to make a key press with their right middle finger for targets appearing in the right headphone and right index finger for targets appearing in the left headphone. There were a total of 84 valid (42 trials per SOA) and 84 invalid trials presented across three separate imaging runs.
The intertrial interval randomly varied between 4, 6, or 8 s. These intervals were selected to both facilitate the sampling of the hemodynamic response (Burock et al.,1998) and to minimize the likelihood of nonlinear summing of hemodynamic responses, which has been demonstrated to occur at intervals of 3 s or less (Glover,1999). Participants were required to both practice the task and to demonstrate 100% proficiency in verbally identifying the cue compared to the target tone pips before entering the scanner environment.
MR Imaging
High resolution T1 [TE (echo time) = 1.64 ms, TR (repetition time) = 2.53 s, 7° flip angle, number of excitations (NEX) = 1, slice thickness = 1 mm, FOV (field of view) = 256 mm, resolution = 256 × 256] and T2 [TE = 77.0 ms, TR = 1.55 s, flip angle 152°, NEX = 1, slice thickness = 1.5 mm, FOV = 220 mm, matrix = 192 × 192, voxel size = 1.15 × 1.15 × 1.5 mm3] anatomic images were collected on a 3 T Siemens Trio scanner. For the three FMRI series, 162 echo‐planar images were collected using a single‐shot, gradient‐echo echoplanar pulse sequence [TR = 2000 ms; TE = 29 ms; flip angle = 75°; FOV = 240 mm; matrix size = 64 × 64]. The first image of each run was eliminated to account for T1 equilibrium effects, leaving a total of 483 images for the final analyses. Thirty‐three contiguous sagittal 3.5‐mm‐thick slices with a gap factor of 1.05 mm were selected to provide whole‐brain coverage (voxel size: 3.75 × 3.75 × 4.55 mm3).
Image Processing and Statistical Analyses
Functional images were generated using Analysis of Functional NeuroImages (AFNI) software package (Cox,1996). Time series images were spatially registered in both two‐ and three‐dimensional space to the second EPI image of the first run to minimize effects of head motion, temporally interpolated to correct for slice‐time acquisition differences and de‐spiked. A deconvolution analysis was then performed on a voxel‐wise basis to generate one hemodynamic response function (HRF) for each of the four main conditions of interest (i.e., valid and invalid trials at each of the SOAs). In addition, participants' motion parameters were entered as regressors of no interest to reduce the impact of head motion on patterns of functional activation. Each HRF was derived relative to the baseline state (visual fixation plus baseline gradient noise) and based on the first 16 s poststimulus onset. The images acquired 4.0–8.0 s poststimulus onset from the cue, corresponding to the peak of the hemodynamic response function (Cohen,1997), were then summed and divided by the model intercept to obtain an estimate of percent signal change. Anatomical and functional images were then interpolated to volumes with 1 mm3 voxels, coregistered, converted to a standard stereotaxic coordinate space (Talairach and Tournoux,1988), and blurred using a 10 mm Gaussian full‐width half‐maximum filter.
A voxel‐wise, 2 × 2 × 2 (group × validity × SOA) repeated measures ANOVA was then performed on the spatially normalized percent signal change measure. In addition, invalidly and validly cued trials were directly compared within each group at both the 200 ms (attentional disengagement and reorienting) and the 700 ms (IOR) SOA to address our primary hypothesis. For all voxel‐wise analyses, a significance threshold corresponding to P < 0.005 was applied in combination with a minimum cluster size threshold of 0.384 ml (six native voxels) to minimize false positives, which resulted in a corrected P value of 0.05 based on 10,000 Monte Carlo simulations (Forman et al.,1995).
RESULTS
Neuropsychological and Clinical Measures
A compilation of all major neuropsychological and clinical indices are presented in Table I. Independent samples t‐tests were first conducted to examine group differences in effort (TOMM), estimates of premorbid levels of intelligence (WTAR), emotional functioning and severity of somatic and cognitive complaints. Results indicated a significant difference for the emotionality index (t 1,29 = 2.72, P < 0.05; mTBI > HC), with controls exhibiting lower than normal (composite T = 43.19) levels of depression and anxiety. In addition, patients with mTBI also reported more cognitive (t 1,29 = 3.79; P < 0.005) and somatic (t 1,29 = 4.22; P < 0.001) complaints than controls. There were no significant differences in levels of effort (P > 0.10), and only a nonsignificant trend (t 1,29 = 1.97, P = 0.058; HC > mTBI) for estimated levels of premorbid intellectual functioning (WTAR).
Table I.
Differences in demographic characteristics, neuropsychological test scores, and symptom severity between mild traumatic brain injury (mTBI) and healthy control (HC) participants
| mTBI (mean ± SD) | HC (mean ± SD) | P value | Cohen's d | |
|---|---|---|---|---|
| Demographic | ||||
| Age | 27.19 ± 7.61 | 27.25 ± 7.43 | >0.10 | 0.01 |
| Education | 13.12 ± 2.47 | 14.38 ± 2.28 | >0.10 | 0.53 |
| HQ | 74.24 ± 42.51 | 77.47 ± 39.79 | >0.10 | 0.08 |
| Sx severity | ||||
| Emotional* | 50.33 ± 7.86 | 43.19 ± 6.75 | <0.05 | 0.98 |
| NBSI‐Som* | 8.73 ± 6.57 | 1.63 ± 1.50 | <0.005 | 1.49 |
| NBSI‐Cog* | 6.07 ± 4.40 | 1.44 ± 2.06 | <0.001 | 1.35 |
| Neuropsychological | ||||
| Attention | 49.87 ± 5.94 | 52.38 ± 5.41 | >0.10 | 0.44 |
| Memory | 48.80 ± 8.95 | 52.31 ± 6.09 | >0.10 | 0.46 |
| WM | 48.80 ± 7.82 | 50.50 ± 8.59 | >0.10 | 0.21 |
| PS | 47.40 ± 7.94 | 49.56 ± 7.37 | >0.10 | 0.28 |
| EF | 44.33 ± 6.23 | 48.75 ± 6.79 | 0.07 | 0.68 |
| WTAR | 48.07 ± 9.43 | 54.43 ± 8.53 | 0.06 | 0.71 |
| TOMM | 53.93 ± 8.61 | 53.38 ± 11.41 | >0.10 | 0.06 |
Note: HQ = handedness quotient; WM = working memory; PS = processing speed; EF = executive function; WTAR = Wechsler Test of Adult Reading; TOMM = Test of Memory Malingering; Sx = symptom; NBSI = Neurobehavioral Symptom Inventory.
Demographic and symptom (Sx) severity data are raw scores, whereas neuropsychological measures are t‐scores.
Denotes significant result.
The composite indices of attention, working memory, memory, processing speed, and executive functioning were correlated to varying degrees (rs ranged from 0.17 to 0.71); therefore, a MANOVA was performed to examine group differences in the cognitive scores using the emotionality index as a covariate. The multivariate effect of group was not significant for the MANOVA (P > 0.10), although moderate or large effect sizes were observed in the domains of attention, executive functioning, and memory.
Behavioral Data
Group‐wise outlier analyses identified one normal control as an extreme outlier (plus three standard deviations) on a key behavioral measure (response time for orienting trials). This subject was subsequently discarded from all further behavioral and functional analyses. Separate 2 × 2 × 2 (group × validity × SOA) mixed‐measures ANOVAs were then performed on the RT and accuracy data to evaluate performance in the scanning environment (see Fig. 2). The RT analyses showed a significant main effect of SOA (F 1,29 = 62.10, P < 0.001), a significant validity by SOA interaction (F 1,29 = 46.61, P < 0.001), a significant validity by group interaction (F 1,29 = 4.67, P < 0.05), and a nonsignificant trend for validity (F 1,29 = 3.83, P = 0.06). Follow‐up paired t‐tests indicated that the validity by SOA interaction was the result of significant reorienting effects (invalid > valid; t 1,30 = −4.52, P < 0.001) at the 200 ms SOA compared to a nonsignificant trend for IOR (valid > invalid; t 1,30 = 1.98, P = 0.057) at the 700 ms SOA.
However, follow up of the validity by group interaction demonstrated that these patterns also varied by group. Specifically, there was no significant difference (P > 0.10) between valid (mean = 565.63 ms) and invalid (mean = 562.89 ms) trials for HC when trials were collapsed across SOA, due to the cancelling effects of facilitation and IOR at the different SOAs. In contrast, patients with TBI exhibited greater reaction times for invalid (mean = 602.71 ms) compared to valid (mean = 546.98 ms) trials when trials were collapsed across SOA (t 1,15 = 2.3, P < 0.05). This general pattern was further elucidated by tests of our predicted hypotheses. Specifically, there was a nonsignificant trend indicating greater costs of reorienting (valid–invalid) at the 200 ms SOA (t 1,29 = 1.71, P = 0.098) as well as a significant reduction in IOR (t 1,29 = 2.08, P < 0.05) at 700 ms for patients with mTBI compared to HC (see Fig. 2C).
An identical 2 × 2 × 2 ANOVA on task accuracy indicated a significant main effect for validity (F 1,29 = 9.25, P < 0.01) and a nonsignificant trend for validity by SOA (F 1,29 = 3.12, P = 0.088). Examination of means indicated that performance was better on valid (mean accuracy = 97.33%) compared to invalid (mean accuracy = 93.5%) trials. However, behavioral accuracy for the task was very high across both groups of participants (mTBI = 95.13 ± 0.06%; HC = 95.71 ± 0.06%).
Structural Imaging Data
Anatomical images (T1 and T2) were read by a board‐certified neuroradiologist and found to be free of trauma‐related pathology (i.e., all patients with mTBI were noncomplicated).
Functional Imaging Data
Two MANOVAs were first conducted to investigate any potential differences in head motion (both rotational and translational displacements in image space) across the two groups, which could serve as a potential confound for the interpretation of FMRI data. The dependent variables for these analyses corresponded to a summation of the absolute difference in head motion parameters across successive images. However, the multivariate effect of group was not significant (P > 0.10) for either of the MANOVAs.
Similar to the behavioral data, a 2 × 2 × 2 mixed‐measures ANOVA (group × validity × SOA) was conducted on the percent signal change data obtained from each trial type. In general, the results from the nongroup effects (effect of SOA, validity, and SOA × validity interaction) were very similar to previously published results in a healthy population (Mayer et al.,2007). Several clusters demonstrated main effects of either validity or SOA and were not implicated in the SOA × validity interaction. Specifically, increased activation during invalid trials was observed in the left inferior gyrus (BAs 45/47), left middle frontal and precentral gyrus (BAs 6/9), left caudate extending into the anterior nucleus of the thalamus, bilateral red nuclei, and right medial dorsal nucleus of the thalamus (see Supporting Information Table II). There were no areas that demonstrated greater activation during validly cued trials.
Increased activation during the 700 ms compared to 200 ms SOA trials was observed within the bilateral precentral and middle frontal gyri (BA 6) corresponding to the frontal eye fields, the left cingulate and medial frontal gyri (BAs 6/24), the right precuneus (BA 7), and bilateral auditory cortical areas (BAs 13/22/41/42) extending into the inferior parietal cortex (see Supporting Information Table III). Conversely, activation was greater for 200 ms trials within the left inferior frontal gyrus/anterior insula (BAs 13/47), bilateral anterior cingulate gyrus (BAs 24/33), right inferior parietal lobule (BA 40), and in the bilateral vermis.
Several regions exhibited a significant validity by SOA interaction, which could be further characterized by two distinct patterns (see Fig. 3; Table II). Specifically, several regions demonstrated patterns of activation that closely resembled the behavioral data in which activation for invalidly cued trials was greater (invalid > valid) at the 200 ms SOA followed by a reversal in this pattern (valid > invalid) at the 700 ms SOA. These areas included left superior and middle temporal gyri, bilateral posterior parietal cortex, right cuneus (BA 19), and right cerebellar tonsil. The second pattern of activation was associated with greater activation for invalid trials at the 200 ms SOA and included the bilateral medial frontal cortex (BAs 6/32), bilateral ventrolateral prefrontal cortex extending into the anterior insula (BAs 45/13), left precentral and middle frontal gyrus (BAs 4/6) corresponding to the frontal eye field (Paus,1996), right middle and superior temporal gyri (BA 21/22), and left thalamic and midbrain nuclei.
Figure 3.

This figure depicts the regions exhibiting the validity × stimulus onset asynchrony (SOA) interaction. Panel A shows the regions implicated in the interaction with axial (z) slice locations provided according to the Talairach atlas (L = left and R = right). Panel B presents clusters that demonstrated increased percent signal change (PSC) for invalid (I200; solid blue bars) compared to valid (V200; solid red bars) trials at the 200 ms SOA (facilitation), as well as increased PSC for valid (V700; solid orange bars) compared to invalid (I700; solid light blue bars) trials at the 700 ms SOA (inhibition of return). These clusters included the (1) left and (2) right posterior parietal cortex and the (3) right cerebellum (not pictured in Panel A). Panel C includes the (4) left and (5) right ventrolateral prefrontal cortex and anterior insula, (6) bilateral medial frontal cortex, (7) left frontal eye field, and (8) left thalamic and midbrain nuclei, which demonstrated increased PSC for invalid compared to valid trials at the 200 ms SOA only.
Table II.
Regions implicated in the SOA by validity interaction
| Region | Side | BAs | X | Y | Z | Volume (ml) | SOA | |
|---|---|---|---|---|---|---|---|---|
| 200 ms | 700 ms | |||||||
| Frontal | ||||||||
| Medial frontal and cingulate gyrus | M | 6/32 | 3 | 17 | 41 | 6.834 | INV > VAL | — |
| Inferior frontal gyrus and insula | R | 45/47/13 | 33 | 23 | 5 | 2.399 | INV > VAL | — |
| Inferior/middle frontal gyrus and insula | L | 44/45/13 | −37 | 17 | 15 | 3.056 | INV > VAL | — |
| Middle frontal and precentral gyrus | L | 4/6 | −42 | −3 | 42 | 2.712 | INV > VAL | — |
| Temporal | — | |||||||
| Middle/superior temporal gyrus | R | 22 | 52 | −40 | 11 | 0.397 | INV > VAL | — |
| Middle/superior temporal gyrus, inferior parietal lobe | L | 13/21/22/40 | −58 | −43 | 15 | 3.276 | INV > VAL | VAL > INV* |
| Parietal | ||||||||
| Posterior parietal cortex | R | 7/40 | 37 | −50 | 40 | 4.343 | INV > VAL | VAL > INV* |
| L | 7/19/39/40 | −36 | −54 | 44 | 11.919 | INV > VAL | VAL > INV | |
| Occipital | ||||||||
| Cuneus | R | 19 | 19 | −90 | 27 | 0.462 | INV > VAL | VAL > INV |
| Subcortical | ||||||||
| Midbrain nuclei | L | −11 | −14 | −3 | 0.786 | INV > VAL | — | |
| Cerebellum | ||||||||
| Cerebellar tonsil | R | 33 | −51 | −47 | 0.809 | INV > VAL | VAL > INV* | |
Note: Side refers to the hemisphere showing activation where M = midline; L = left, and R = right hemisphere. The Brodmann area (BA), the center of mass in Talairach coordinates (X, Y, Z), and volume are specified for each area of activation.
Indicates that effect was only significant at a trend level (0.05 ≤ P ≥ 0.10).
In terms of the main effect of group (see Fig. 4; Table III), results indicated decreased activation (i.e., hypoactivation) for patients with mTBI relative to controls within the bilateral posterior cingulate gyrus (BAs 23/29), bilateral pons and midbrain nuclei, bilateral culmen and declive, bilateral medial dorsal nucleus of the thalamus and the bilateral rostral basal ganglia.
Figure 4.

This figure presents the clusters exhibiting significant group differences across all task conditions and the percent signal change (PSC) values for healthy controls (HC; blue bars) and mild traumatic brain injury (mTBI; red bars). Clusters include the (1) right and (2) left striatum, (3) pons and midbrain nuclei, (4) cerebellum, (5) posterior cingulate gyrus, and (6) medial dorsal nucleus of the thalamus. The locations of axial (z) and sagittal (x) slices are given according to the Talairach atlas (L = left and R = right).
Table III.
Regions demonstrating hypoactivation for mild traumatic brain injury patients relative to healthy controls
| Region | Side | BAs | X | Y | Z | Volume (ml) |
|---|---|---|---|---|---|---|
| Parietal | ||||||
| Posterior cingulate gyrus | M | 23/29 | 1 | −31 | 24 | 4.561 |
| Subcortical | ||||||
| Striatum | R | 18 | 8 | −5 | 1.755 | |
| L | −17 | −4 | −2 | 0.430 | ||
| Medial dorsal nucleus of the thalamus | M | 2 | −14 | 6 | 0.518 | |
| Pons and midbrain nuclei | M | −1 | −20 | −12 | 3.482 | |
| Cerebellum | ||||||
| Culmen and declive | M | −3 | −49 | −13 | 1.264 |
Note: Side refers to the hemisphere showing activation where M = midline; L = left, and R = right hemisphere. The Brodmann area (BA), the center of mass in Talairach coordinates (X, Y, Z), and volume are specified for each area of activation.
Significant group × validity interactions were observed within the left superior frontal (BA 9; center of mass X = −7, Y = 45, Z = 27; 0.669 ml) and right superior temporal (BA 38; center of mass X = 22, Y = 9, Z = −30; 0.712 ml) gyrus. Follow‐up t‐tests revealed that there were no significant group differences for either valid or invalid trials, but that the patterns of activation did differ within each group. Specifically, HC and patients with mTBI exhibited activation within the right superior temporal gyrus and deactivation in the left medial/superior frontal gyri (BA 9); however, the magnitude was greater for mTBI in both regions for invalid compared to valid trials, while HC showed an opposite pattern of activation, with greater percent signal change occurring during valid trials.
Finally, a group × validity × SOA interaction effect was observed within the left inferior and middle temporal gyri (BAs 21/37; center of mass X = −58, Y = −54, Z = −1; 0.485 ml). To further dissect this three‐way interaction, two 2 × 2 (group × validity) ANOVAs were conducted separately for each SOA. Results indicated that the group × validity interaction was significant at both SOAs (no main effects), which was the result of HC, but not patients with mTBI, exhibiting both reorienting (i.e., invalid > valid at 200 ms) and inhibitory (valid > invalid at 700 ms) effects during functional activation.
In our next set of functional analyses, direct estimates of disengagement/reorienting (200 ms SOA) and IOR (700 ms SOA) were obtained for each group separately by comparing invalidly and validly cued trials at each SOA. For both groups, there were no clusters that survived the false positive correction (P < 0.005; 0.384 ml) at the 700 ms SOA. In contrast, a large network of cortical and subcortical areas, which closely corresponded to the network identified in the SOA × validity interaction, exhibited greater activation for invalidly cued trials during disengagement and attentional reorienting (200 ms SOA) for HC but not for patients with mTBI (see Fig. 5). Specifically, the only areas of overlap (see Tables IV and V, starred text) between the two groups included the bilateral anterior insula (BA 13), right ventrolateral prefrontal cortex (BAs 45/47), left inferior frontal gyrus (BA 9), and left posterior parietal lobules (BAs 40/7). However, for all of these clusters, the volume of activation was severely reduced in the mTBI group. In addition, HC exhibited widespread unique activation during attentional disengagement and reorienting (invalid > valid) within the bilateral pre‐SMA and cingulate gyrus (BAs 6/24/31/32), bilateral frontal eye field areas (BA 6), right posterior parietal lobes (BAs 7/39/40), bilateral striatum, bilateral thalamus, and bilateral cerebellum as well as increased spatial activation of the right ventrolateral prefrontal cortex compared to mTBI (Table IV). Several clusters of unique activation were also observed within the bilateral temporal lobe and left cuneus for HC but not patients with mTBI. In contrast, only a single cluster within the bilateral midbrain and anterior thalamic nuclei exhibited activation unique for subjects with mTBI (invalid > valid; see Table V).
Figure 5.

This figure presents the within‐group comparisons of invalid and valid trials at 200 ms stimulus onset asynchrony for healthy controls (HC: Panel A) and mild traumatic brain injury patients (mTBI: Panel B). Results indicated robust activation during attentional disengagement within the frontal eye fields (FEF), posterior parietal cortex (PPL), ventrolateral prefrontal cortex (VLPFC), anterior insula (aINS), presupplementary motor area (p‐SMA), and midbrain nuclei (MDB) for controls, which was either absent or greatly reduced for patients with mTBI. The locations of axial (z) and sagittal (x) slices are given according to the Talairach atlas (L = left and R = right).
Table IV.
Regions of activation for healthy controls at 200 ms (invalid > valid)
| Region | Side | BAs | X | Y | Z | Volume (ml) |
|---|---|---|---|---|---|---|
| Frontal | ||||||
| Medial frontal and cingulate gyrus | M | 6/32/34 | 0 | 12 | 41 | 13.773 |
| Medial frontal and precentral gyrus | R | 6 | 30 | −9 | 52 | 0.679 |
| Medial frontal, cingulate and precentral gyrus | L | 6/24/31 | −26 | −7 | 47 | 5.819 |
| Ventro‐ and dorsolateral prefrontal cortex, insula extending to striatum | R* | 13/44/45/46/47 | 35 | 20 | 6 | 9.438 |
| L* | 9/13/44/45/46/47 | −36 | 19 | 14 | 21.155 | |
| Temporal | ||||||
| Middle/superior temporal gyrus | R | 21/22/42 | 53 | −39 | 5 | 6.779 |
| Middle/superior temporal gyrus and insula extending to parietal lobe | L | 13/21/22/37/39/40/41/42 | −54 | −41 | 9 | 12.870 |
| Inferior/middle temporal gyrus | L | 21 | −63 | 15 | −11 | 0.420 |
| Inferior/middle temporal gyrus and fusiform gyrus | L | 20/37 | −51 | −42 | −13 | 0.802 |
| Lingual and fusiform gyrus | R | 18/19 | 22 | −69 | −4 | 0.674 |
| Parietal | ||||||
| Posterior parietal cortex | R | 7/39/40 | 37 | −50 | 41 | 4.675 |
| L* | 7/13/19/39/40 | −38 | −50 | 39 | 14.402 | |
| Precuneus | L* | 7 | −19 | −66 | 46 | 0.602 |
| Occipital | ||||||
| Cuneus | L | 17/18 | −8 | −86 | 12 | 0.681 |
| Subcortical | ||||||
| Striatum | R | 19 | 4 | 9 | 2.096 | |
| L | −17 | 10 | 10 | 0.991 | ||
| Ventral anterior/lateral nuclei of the thalamus | R | 14 | −11 | 6 | 0.841 | |
| Cerebellum | ||||||
| Cerebellar tonsil | R | 11 | −61 | −34 | 1.280 | |
| L | −28 | −53 | −41 | 0.718 | ||
| Pyramis and culmen | R | 26 | −59 | −26 | 0.392 |
Note: Side refers to the hemisphere showing activation where M = midline; L = left, and R = right hemisphere. The Brodmann area (BA), the center of mass in Talairach coordinates (X, Y, Z), and volume are specified for each area of activation.
Indicates overlapping areas of activation between healthy controls and patients with mild traumatic brain injury.
Table V.
Regions of activation for patients with mTBI at 200 ms (invalid > valid)
| Region | Side | BAs | X | Y | Z | Volume (ml) |
|---|---|---|---|---|---|---|
| Frontal | ||||||
| Inferior frontal gyrus and insula | R* | 45/47/13 | 35 | 22 | 3 | 1.833 |
| L* | 13 | −36 | 18 | 9 | 0.422 | |
| Inferior/middle frontal gyrus | L* | 9 | −40 | 21 | 30 | 0.438 |
| Parietal | ||||||
| Superior parietal lobules and precuneus | L* | 7 | −23 | −68 | 50 | 0.593 |
| Inferior/superior parietal lobules | L* | 40/7 | −38 | −53 | 52 | 2.190 |
| Subcortical | ||||||
| Midbrain nuclei | M | −2 | −4 | 4 | 2.502 |
Note: Side refers to the hemisphere showing activation where M = midline; L = left, and R = right hemisphere. The Brodmann area (BA), the center of mass in Talairach coordinates (X, Y, Z), and volume are specified for each area of activation.
Indicates overlapping areas of activation between healthy controls and patients with mild traumatic brain injury.
The final analyses examined which of the clusters from the validity × SOA interaction were capable of predicting significant variance in behavioral performance on the orienting task. Specifically, hierarchical backwards multiple regressions were conducted separately for each group in which the validity by SOA clusters served as the independent variables and the reaction time data served as the dependent variable. The analyses included subject‐specific random effects to account for repeated measures on each individual. The validity × SOA interaction map was adopted as the ROI network for these analyses, as it was calculated based on data from both groups of subjects (e.g., unbiased) and closely resembled the classic fronto‐parietal network that has been reported in previous studies of attentional orienting (Corbetta and Shulman,1998; Mayer et al.,2007; Thiel et al.,2004). In healthy controls, a network including the left posterior parietal cortex (t 1,40 = −2.19, P < 0.05), bilateral medial frontal cortex (t 1,40 = 4.54, P < 0.0001), left (t 1,40 = −1.8, P = 0.079) and right (t 1,40 = −4.47, P < 0.0001) middle and superior temporal gyrus and right cuneus (t 1,40 = 2.51, P < 0.05) predicted response time data (overall model F 5,40 = 7.38, P < 0.0001). In contrast, only the right ventrolateral prefrontal cortex/anterior insula (t 1,46 = 5.52, P < 0.0001) and right middle/superior temporal gyrus (t 1,46 = −1.79, P = 0.081) predicted response time data for patients with mTBI (overall model F 2,46 = 15.85, P < 0.0001).
DISCUSSION
To our knowledge, this is the first FMRI study to examine attentional dysfunction in a clinically homogeneous sample of noncomplicated patients with mTBI during the semiacute phase of injury when cognitive deficits are likely to be present (Belanger et al.,2007; Bigler,2008). Before examining the findings related to the patient group, we first briefly discuss the most relevant behavioral and imaging results from the healthy controls. In general, healthy participants exhibited both increased reaction times and increased functional activity within a distributed fronto‐parietal network for invalidly compared to validly cued 200 ms SOA trials. These behavioral and functional “costs” correspond to the active disengagement and reorienting of auditory attention following an invalid trial (Mayer et al.,2007; Posner et al.,1985). In contrast, response times were faster for invalidly rather than validly cued trials at the 700 ms SOA (i.e., inhibition of return), and activation within the fronto‐parietal network was either equated or in some cases, such as the posterior parietal cortex, reversed. Current behavioral and functional results are generally consistent with previous studies on bottom–up orienting in both the auditory and visual modality (Lepsien and Pollmann,2002; Mayer et al.,2004b,2007), and support the notion of redundancy within the attentional system (Mesulam,1990).
Several important differences in clinical, behavioral, and functional measures were also observed between mTBI and HC groups. In terms of overall functioning, patients with mTBI reported significantly more cognitive problems on a self‐report checklist compared to the matched controls. Although the magnitude of deficits on traditional neuropsychological measures were not sufficient to reach conventional levels of statistical significance, the effect sizes (moderate to large) were consistent with previous meta‐analyses suggesting subtle cognitive deficits for this population (Belanger and Vanderploeg,2005; Belanger et al.,2005; Schretlen and Shapiro,2003). Patients with mild TBI also scored significantly higher than controls on several self‐report measures of emotional distress (primarily depression and anxiety) and somatic complaints. However, it is noteworthy that scores on normative measures of depression (Beck Depression Inventory) and anxiety (State‐Trait Anxiety Inventory) were within the normal range (composite T score = 50.33) for the patient group, suggesting that overt psychopathology is not a compelling explanation for either the behavioral deficits or functional differences described below.
Previous behavioral studies have demonstrated that both visual‐spatial orienting and gap saccades are typically impaired in the semiacute stages of mTBI (Cremona‐Meteyard and Geffen,1994; Drew et al.,2007; Halterman et al.,2006; Van Donkelaar et al.,2005), whereas more severely injured populations are both generally slower to identify targets during top–down orienting (Bate et al.,2001) and exhibit deficits in engaging attentional focus (i.e., cueing benefits) (Cremona‐Meteyard et al.,1992). Current findings suggest that patients with mTBI exhibited a deficit in disengaging their attention following an invalid cue (e.g., greater costs) at the shorter SOA, as well as a failure to inhibit attentional allocation to a cued spatial location (e.g., inhibition of return) at the longer SOA relative to controls. Although previous studies suggest that orienting deficits typically normalize within 1 week of injury (Halterman et al.,2006; Van Donkelaar et al.,2005), the postinjury scanning time (mean = 11.9 ± 5.9 days) indicates that orienting deficits likely persisted beyond this window in the current sample. This discrepancy may be the result of sample characteristics as previous work (Halterman et al.,2006; Van Donkelaar et al.,2005) excluded college students who had experienced a loss of consciousness (i.e., American Academy of Neurology Grade III concussions). In contrast, the current sample was recruited from a local hospital and the majority of patients (87.5%) experienced a grade III concussion according to both self‐report and hospital records. Collectively, current and previous results suggest that the grade of the mTBI may partially determine how quickly orienting deficits ameliorate following mTBI.
These behavioral findings provide a clinical measurement for the self‐reported attentional deficits that are so frequently observed within the first few weeks of mTBI (Belanger et al.,2007; Bigler,2008; Iverson,2005). Specifically, patients with mTBI may have difficulty quickly reallocating their attention to detect new threats within their environment, which may have important implications for returning to work, engaging in hazardous activities, and driving. Importantly, behavioral deficits in patients with mTBI were associated with two different findings of functional abnormalities, and there were fewer regions of the core attention network that predicted response time data in patients compared to controls. The first major finding indicated that patients with mTBI demonstrated hypoactivation within the bilateral striatum, medial dorsal nucleus of the thalamus, pons, midbrain nuclei, and cerebellum. All of these structures have previously been implicated in the orienting and maintenance of spatial attention. For example, behavioral work suggests a direct link between cerebellar hypoplasia and slower attentional shifts in autistic children (Harris et al.,1999). Neuroimaging studies in healthy controls have reported cerebellar activation during sound discrimination (Belin et al.,2002), spatial localization (Zatorre et al.,2002), as well as auditory reorienting and IOR (Mayer et al.,2007; Salmi et al.,2007), indicating the large role that this structure plays in various forms of auditory attention. Similarly, lesion (Arend et al.,2008; Rafal and Posner,1987) and more recent neuroimaging studies (Salmi et al.,2007) suggest that the thalamus plays a crucial role in directing spatial attention. Finally, the cluster of hypoactivation within the medial pons roughly corresponds to auditory brainstem regions including the superior olivary complex (Hesselmann et al.,2001), which was also shown to be more active for invalid compared to valid trials (main effect of validity). Collectively, these results suggest a general failure for patients with mTBI to recruit the neuronal structures necessary to efficiently perform an orienting task across all trial types.
Our second major finding indicated that patients with mTBI also exhibited hypoactivation within the traditional attentional network at the 200 ms SOA when disengagement demands were the greatest. Previous work suggests that the disengagement and reorienting of attentional focus is largely mediated by a distributed network composed of frontal oculomotor sites, ventrolateral prefrontal cortex, and the posterior parietal lobe (Arrington et al.,2000; Corbetta et al.,2000; Mayer et al.,2009; Thiel et al.,2004). In contrast to healthy controls, patients with mTBI failed to show the expected pattern of increased activation (invalid > valid) during attentional disengagement within right posterior parietal cortex, pre‐SMA, bilateral FEF, right ventrolateral prefrontal cortex, thalamic, midbrain nuclei, and cerebellum. In addition, the volume of activation within the left posterior parietal cortex, bilateral insula, and left ventrolateral prefrontal cortex was also greatly reduced for patients with mTBI. These findings corroborate the notion that the disengagement of attentional focus may be one of the primary behavioral deficits in mTBI during the initial recovery phase (Drew et al.,2007; Halterman et al.,2006) and further suggest that hypoactivation within the core attentional network may provide a potential biomarker of cognitive dysfunction during the semiacute stage. Further evidence of this comes from our hierarchical regression analyses, which demonstrated that only the right ventrolateral prefrontal cortex and right middle/superior temporal gyrus accounted for significant variance in patients with mTBI. In contrast, a much broader network that included the left posterior parietal cortex, bilateral medial frontal gyrus, bilateral middle/superior temporal gyrus, and right cuneus accounted for significant variance amongst the healthy controls. These results suggest a potential disconnect between the neuronal circuitry mediating attentional orienting and observed behavioral performance in patients with mTBI.
As noted in the Introduction, previous neuroimaging studies have reported a mixed pattern of both hypo‐ and hyperactivation in mTBI and more severely injured patients. Specifically, McAllister and coworkers reported hypoactivation in dorsolateral prefrontal cortex during lower levels of cognitive effort followed by hyperactivation in similar areas during more moderate cognitive loads during a working memory task (McAllister et al.,1999,2001). Smits et al. (in press) reported hyperactivation during both a working memory and attention task in patients with mTBI with more severe postconcussive symptoms. Chen and coworkers reported hypoactivation for patients with mTBI within both the prefrontal cortex and anterior cingulate gyrus coupled with hyperactivation in temporal and parietal cortices (Chen et al.,2004,2007). More severely injured patients exhibit hypoactivation within the anterior cingulate during both the Stroop task (Soeda et al.,2005) and visual orienting (Kim et al.,1999), although hyperactivation within the right middle frontal gyrus, insula, and left temporal cortex was also observed in the latter task (Kim et al.,1999). Therefore, the largest difference between current and previous functional imaging studies seems to be the more consistent finding of hypoactivation across two separate networks in the current study.
The pattern of hypoactivation observed in the patients with mTBI may be the result of impaired neuronal function, impaired neural control of microvessels, direct damage to the vascular system, a result of metabolic disruptions, or a combination of all of these. For example, frank neuronal dysfunction (e.g., reduced mass‐action of neuronal spikings) could result in a reduced BOLD effect by reducing the demand for hemodynamically delivered resources to restore cell homeostasis following increased metabolic demands (Logothetis,2008). Indirect support for this hypothesis comes from findings of reduced concentration of glutamate, an excitatory neurotransmitter, in supraventricular gray matter in a similar sample of semiacute patients with mTBI during magnetic resonance spectroscopy (Gasparovic et al., in press). Likewise, other MRS studies on mTBI have also reported neurometabolic abnormalities in white matter voxels suggestive of direct damage to pathways (Govindaraju et al.,2004; Vagnozzi et al.,2008), which has also been generally supported by findings from diffusion tensor imaging (DTI) studies (Miles et al.,2008; Niogi et al.,2008).
In addition, mTBI typically produces mechanical forces, which could directly impact on the vasculature that underlies the BOLD response. For example, severe TBI significantly reduces cerebral blood flow and transit time (Hillary and Biswal,2007). In mTBI, increased Virchow–Robin spaces have been observed, which may have been the result of an inflammatory process (Inglese et al.,2005). Hemosiderin depositions, secondary to microhemorrhages and inflammation, have also been noted in the autopsy report of a patient with mTBI who died 7 months postinjury (Bigler,2004). In addition, animal studies based on the fluid percussion model indicate a semiacute reduction in capillary number and diameter at two different levels of injury severity (Park et al.,2009). Furthermore, Ueda et al. (2006) reported that TBI resulted in prolonged increases in reactivity of smooth muscle in the walls of microvessels. At present, it would be inappropriate to draw conclusions about the relative importance of these different mechanisms as they pertain to our finding of hypoactivation in a human clinical sample. Specifically, the BOLD response is an indirect measure of neuronal functioning whose basic signal properties are determined by cerebral blood flow, blood volume, and the ratio of deoxyhemoglobin to oxyhemoglobin (Logothetis,2008), rendering an accurate assessment of potential mechanisms of neuropathology speculative at best. However, longitudinal multimodal studies of mTBI may provide a window on the temporal emergence and resolution of these abnormalities, providing unique insights as to their functional significance and impact on the BOLD response.
Several other potential explanations for the differences in the pattern of activation across these studies may exist. First, unlike previous studies (Chen et al.,2004,2007; McAllister et al.,1999,2001), patients with mTBI exhibited behavioral deficits during the orienting task, which may have biased the functional results toward an overall pattern of functional hypoactivation due to a failure to recruit appropriate neuronal resources. Second, the discrepancies in behavioral findings across studies might partially be the result of injury acuity (e.g., the majority of patients in Chen studies were several months postinjury) or due to differences in task selection. Specifically, the orienting task maximized the attentional disengagement deficit (Drew et al.,2007; Halterman et al.,2006) compared to previous FMRI studies, which utilized working memory paradigms (Chen et al.,2004,2007; McAllister et al.,1999,2001). Similarly, the reflexive and automatic (i.e., less effortful) nature of the bottom–up orienting task may have also contributed to the consistent pattern of hypoactivation observed in the current study. The level of effort required to perform the current task is likely to be more consistent with a lower cognitive load, which also resulted in hypoactivation for patients with mTBI in previous work (McAllister et al.,1999,2001). Future studies should determine if a mixed pattern of hypo‐ and hyperactivation for patients with mTBI would be observed during a top–down orienting task that involves more effortful shifts of attentional focus.
In conclusion, current results demonstrate both behavioral and functional deficits in bottom–up spatial orienting in semiacute patients with mTBI. These and previous (Govindaraju et al.,2004; Inglese et al.,2005; Vagnozzi et al.,2008) findings suggest that magnetic resonance‐based techniques such as FMRI, MRS, and DTI show great promise for elucidating potential mechanisms of neuropathology in mTBI compared to more traditional imaging techniques (CT scans and T1‐ and T2‐weighted images). However, of these techniques, only FMRI is capable of measuring the underlying neural response to dynamic cognitive challenges that are so often reported to be problematic within this population. Future FMRI studies should determine whether these behavioral and functional deficits normalize in conjunction with recovery, which is expected to spontaneously occur in the majority of patients with mTBI (Belanger et al.,2007; Bigler,2008; Iverson,2005). For example, activation within the frontal and parietal lobes has been shown to normalize as a function of recovery in more severely injured populations (Sanchez‐Carrion et al.,2008; Kim et al., in press), which is also likely to occur in mTBI in the first few months postinjury.
Supporting information
Additional Supporting Information may be found in the online version of this article.
Table I: Mild traumatic brain injury patients' injury information. Table II: Regions exhibiting increased activation during invalid compared to valid trials Table III: Regions showing a main effect of stimulus onset asynchrony (SOA; 200ms vs. 700ms).
Acknowledgements
Special thanks to Diana South and Cathy Smith for assistance with data collection, to Edward J. Bedrick, PhD, for help with statistical analyses, and to Gayle Pohl and her class for fundraising efforts to further support this project.
Footnotes
There were no differences in the functional activation group effects when these subjects and their controls were removed from analyses. Although behavioral differences in both facilitation and IOR were no longer significant, this appeared to be more related to a loss of power as the effect sizes remained largely unchanged (facilitation d = .62 to .59; IOR d = .75 to .57).
REFERENCES
- Arend I, Rafal R, Ward R ( 2008): Spatial and temporal deficits are regionally dissociable in patients with pulvinar lesions. Rev Neurol 131: 2140–2152. [DOI] [PubMed] [Google Scholar]
- Arrington CM, Carr TH, Mayer AR, Rao SM ( 2000): Neural mechanisms of visual attention: Object‐based selection of a region in space. J Cogn Neurosci 12: 106–117. [DOI] [PubMed] [Google Scholar]
- Bate AJ, Mathias JL, Crawford JR ( 2001): The covert orienting of visual attention following severe traumatic brain injury. J Clin Exp Neuropsychol 23: 386–398. [DOI] [PubMed] [Google Scholar]
- Belanger HG, Vanderploeg RD ( 2005): The neuropsychological impact of sports‐related concussion: A meta‐analysis. J Int Neuropsychol Soc 11: 345–357. [DOI] [PubMed] [Google Scholar]
- Belanger HG, Curtiss G, Demery JA, Lebowitz BK, Vanderploeg RD ( 2005): Factors moderating neuropsychological outcomes following mild traumatic brain injury: A meta‐analysis. J Int Neuropsychol Soc 11: 215–227. [DOI] [PubMed] [Google Scholar]
- Belanger HG, Vanderploeg RD, Curtiss G, Warden DL ( 2007): Recent neuroimaging techniques in mild traumatic brain injury. J Neuropsychiatry Clin Neurosci 19: 5–20. [DOI] [PubMed] [Google Scholar]
- Belin P, McAdams S, Thivard L, Smith B, Savel S, Zilbovicius M, Samson S, Samson Y ( 2002): The neuroanatomical substrate of sound duration discrimination. Cogn Neuropsychol 40: 1956–1964. [DOI] [PubMed] [Google Scholar]
- Bigler ED ( 2004): Neuropsychological results and neuropathological findings at autopsy in a case of mild traumatic brain injury. J Int Neuropsychol Soc 10: 794–806. [DOI] [PubMed] [Google Scholar]
- Bigler ED ( 2008): Neuropsychology and clinical neuroscience of persistent post‐concussive syndrome. J Int Neuropsychol Soc 14: 1–22. [DOI] [PubMed] [Google Scholar]
- Burock MA, Buckner RL, Woldorff MG, Rosen BR, Dale AM ( 1998): Randomized event‐related experimental designs allow for extremely rapid presentation rates using functional MRI. NeuroReport 9: 3735–3739. [DOI] [PubMed] [Google Scholar]
- Cabeza R, Nyberg L ( 2000): Imaging cognition II: An empirical review of 275 PET and fMRI studies. J Cogn Neurosci 12: 1–47. [DOI] [PubMed] [Google Scholar]
- Chen JK, Johnston KM, Frey S, Petrides M, Worsley K, Ptito A ( 2004): Functional abnormalities in symptomatic concussed athletes: An fMRI study. Neuroimage 22: 68–82. [DOI] [PubMed] [Google Scholar]
- Chen JK, Johnston KM, Collie A, McCrory P, Ptito A ( 2007): A validation of the post concussion symptom scale in the assessment of complex concussion using cognitive testing and functional MRI. J Neurol Neurosurg Psychiatry 78: 1231–1238. [DOI] [PMC free article] [PubMed] [Google Scholar]
- Chen JK, Johnston KM, Petrides M, Ptito A ( 2008): Neural substrates of symptoms of depression following concussion in male athletes with persisting postconcussion symptoms. Arch Gen Psychiatry 65: 81–89. [DOI] [PubMed] [Google Scholar]
- Cohen M ( 1997): Parametric analysis of fMRI data using linear systems methods. Neuroimage 6: 93–103. [DOI] [PubMed] [Google Scholar]
- Corbetta M, Shulman GL ( 1998): Human cortical mechanisms of visual attention during orienting and search. Philos Trans R Soc Lond B Biol Sci 353: 1353–1362. [DOI] [PMC free article] [PubMed] [Google Scholar]
- Corbetta M, Kincade JM, Ollinger JM, McAvoy MP, Shulman GL ( 2000): Voluntary orienting is dissociated from target detection in human posterior parietal cortex. Nat Neurosci 3: 292–297. [DOI] [PubMed] [Google Scholar]
- Cox RW ( 1996): AFNI: Software for analysis and visualization of functional magnetic resonance neuroimages. Comput Biomed Res 29: 162–173. [DOI] [PubMed] [Google Scholar]
- Cremona‐Meteyard SL, Geffen GM ( 1994): Persistent visuospatial attention deficits following mild head injury in Australian Rules football players. Cogn Neuropsychol 32: 649–662. [DOI] [PubMed] [Google Scholar]
- Cremona‐Meteyard SL, Clark CR, Wright MJ, Geffen GM ( 1992): Covert orientation of visual attention after closed head injury. Cogn Neuropsychol 30: 123–132. [DOI] [PubMed] [Google Scholar]
- Drew AS, Langan J, Halterman C, Osternig LR, Chou LS, van Donkelaar P ( 2007): Attentional disengagement dysfunction following mTBI assessed with the gap saccade task. Neurosci Lett 417: 61–65. [DOI] [PubMed] [Google Scholar]
- Forman SD, Cohen JD, Fitzgerald M, Eddy WF, Mintun MA, Noll DC ( 1995): Improved assessment of significant activation in functional magnetic resonance imaging (fMRI): Use of a cluster‐size threshold. Magn Reson Med 33: 636–647. [DOI] [PubMed] [Google Scholar]
- Gasparovic C, Yeo R, Mannell M, Ling J, Elgie R, Phillips J, Doezema D, Mayer A ( 2009): Neurometabolite concentrations in gray and white matter in mild traumatic brain injury: A 1HMagnetic resonance spectroscopy study. J Neurotrauma (in press). [DOI] [PMC free article] [PubMed] [Google Scholar]
- Glover GH ( 1999): Deconvolution of impulse response in event‐related BOLD fMRI. Neuroimage 9: 416–429. [DOI] [PubMed] [Google Scholar]
- Govindaraju V, Gauger GE, Manley GT, Ebel A, Meeker M, Maudsley AA ( 2004): Volumetric proton spectroscopic imaging of mild traumatic brain injury. AJNR Am J Neuroradiol 25: 730–737. [PMC free article] [PubMed] [Google Scholar]
- Halterman CI, Langan J, Drew A, Rodriguez E, Osternig LR, Chou LS, van Donkelaar P ( 2006): Tracking the recovery of visuospatial attention deficits in mild traumatic brain injury. Brain 129: 747–753. [DOI] [PubMed] [Google Scholar]
- Harris NS, Courchesne E, Townsend J, Carper RA, Lord C ( 1999): Neuroanatomic contributions to slowed orienting of attention in children with autism. Brain Res Cogn Brain Res 8: 61–71. [DOI] [PubMed] [Google Scholar]
- Hesselmann V, Wedekind C, Kugel H, Schulte O, Krug B, Klug N, Lackner KJ ( 2001): Functional magnetic resonance imaging of human pontine auditory pathway. Hear Res 158: 160–164. [DOI] [PubMed] [Google Scholar]
- Hillary FG, Biswal B ( 2007): The influence of neuropathology on the FMRI signal: A measurement of brain or vein? Clin Neuropsychol 21: 58–72. [DOI] [PubMed] [Google Scholar]
- Hughes DG, Jackson A, Mason DL, Berry E, Hollis S, Yates DW ( 2004): Abnormalities on magnetic resonance imaging seen acutely following mild traumatic brain injury: Correlation with neuropsychological tests and delayed recovery. Neuroradiology 46: 550–558. [DOI] [PubMed] [Google Scholar]
- Inglese M, Makani S, Johnson G, Cohen BA, Silver JA, Gonen O, Grossman RI ( 2005): Diffuse axonal injury in mild traumatic brain injury: A diffusion tensor imaging study. J Neurosurg 103: 298–303. [DOI] [PubMed] [Google Scholar]
- Iverson GL ( 2005): Outcome from mild traumatic brain injury. Curr Opin Psychiatry 18: 301–317. [DOI] [PubMed] [Google Scholar]
- Kim YH, Gitelman DR, Nobre AC, Parrish TB, LaBar KS, Mesulam MM ( 1999): The large‐scale neural network for spatial attention displays multifunctional overlap but differential asymmetry. Neuroimage 9: 269–277. [DOI] [PubMed] [Google Scholar]
- Kim YH, Yoo WK, Ko MH, Park CH, Kim ST, Na DL ( 2009): Plasticity of the attentional network after brain injury and cognitive rehabilitation. Neurorehabil Neural Repair 23: 468–477. [DOI] [PubMed] [Google Scholar]
- Kraus MF, Little DM, Donnell AJ, Reilly JL, Simonian N, Sweeney JA ( 2007): Oculomotor function in chronic traumatic brain injury. Cogn Behav Neurol 20: 170–178. [DOI] [PubMed] [Google Scholar]
- Lee H, Wintermark M, Gean AD, Ghajar J, Manley GT, Mukherjee P ( 2008): Focal lesions in acute mild traumatic brain injury and neurocognitive outcome: CT versus 3T MRI. J Neurotrauma 25: 1049–1056. [DOI] [PubMed] [Google Scholar]
- Lepsien J, Pollmann S ( 2002): Covert reorienting and inhibition of return: An event‐related fMRI study. J Cogn Neurosci 14: 127–144. [DOI] [PubMed] [Google Scholar]
- Lezak MD, Howieson DB, Loring DW, Hannay HJ, Fischer JS ( 2004): Neuropsychological Assessment. New York: Oxford University Press. [Google Scholar]
- Logothetis NK ( 2008): What we can do and what we cannot do with fMRI. Nature 453: 869–878. [DOI] [PubMed] [Google Scholar]
- Mayer AR, Dorflinger JM, Rao SM, Seidenberg M ( 2004a): Neural networks underlying endogenous and exogenous visual‐spatial orienting. Neuroimage 23: 534–541. [DOI] [PubMed] [Google Scholar]
- Mayer AR, Seidenberg M, Dorflinger JM, Rao SM ( 2004b): An event‐related fMRI study of exogenous orienting: Supporting evidence for the cortical basis of inhibition of return? J Cogn Neurosci 16: 1262–1271. [DOI] [PubMed] [Google Scholar]
- Mayer AR, Harrington DL, Stephen J, Adair JC, Lee RR ( 2007): An event‐related fMRI study of exogenous facilitation and inhibition of return in the auditory modality. J Cogn Neurosci 19: 455–467. [DOI] [PubMed] [Google Scholar]
- Mayer AR, Hanlon FM, Franco AR, Teshiba TM, Thoma RJ, Clark VP, Canive JM ( 2009): The neural networks underlying auditory sensory gating. Neuroimage 44: 182–189. [DOI] [PMC free article] [PubMed] [Google Scholar]
- McAllister TW, Saykin AJ, Flashman LA, Sparling MB, Johnson SC, Guerin SJ, Mamourian AC, Weaver JB, Yanofsky N ( 1999): Brain activation during working memory 1 month after mild traumatic brain injury: A functional MRI study. Neurology 53: 1300–1308. [DOI] [PubMed] [Google Scholar]
- McAllister TW, Sparling MB, Flashman LA, Guerin SJ, Mamourian AC, Saykin AJ ( 2001): Differential working memory load effects after mild traumatic brain injury. Neuroimage 14: 1004–1012. [DOI] [PubMed] [Google Scholar]
- McAllister TW, Flashman LA, McDonald BC, Saykin AJ ( 2006): Mechanisms of working memory dysfunction after mild and moderate TBI: Evidence from functional MRI and neurogenetics. J Neurotrauma 23: 1450–1467. [DOI] [PubMed] [Google Scholar]
- Mesulam MM ( 1990): Large‐scale neurocognitive networks and distributed processing for attention, language, and memory. Ann Neurol 28: 597–613. [DOI] [PubMed] [Google Scholar]
- Miles L, Grossman RI, Johnson G, Babb JS, Diller L, Inglese M ( 2008): Short‐term DTI predictors of cognitive dysfunction in mild traumatic brain injury. Brain Inj 22: 115–122. [DOI] [PubMed] [Google Scholar]
- Niogi SN, Mukherjee P, Ghajar J, Johnson CE, Kolster R, Lee H, Suh M, Zimmerman RD, Manley GT, McCandliss BD ( 2008): Structural dissociation of attentional control and memory in adults with and without mild traumatic brain injury. Rev Neurol 131: 3209–3221. [DOI] [PubMed] [Google Scholar]
- Oldfield RC ( 1971): The assessment and analysis of handedness: The Edinburgh inventory. Cogn Neuropsychol 9: 97–113. [DOI] [PubMed] [Google Scholar]
- Park E, Bell JD, Siddiq IP, Baker AJ ( 2009): An analysis of regional microvascular loss and recovery following two grades of fluid percussion trauma: A role for hypoxia‐inducible factors in traumatic brain injury. J Cereb Blood Flow Metab 29: 575–584. [DOI] [PubMed] [Google Scholar]
- Paus T ( 1996): Location and function of the human frontal eye‐field: A selective review. Cogn Neuropsychol 34: 475–483. [DOI] [PubMed] [Google Scholar]
- Pavlovskaya M, Hochstein S, Keren O, Mordvinov E, Groswasser Z ( 2007): Methylphenidate effect on hemispheric attentional imbalance in patients with traumatic brain injury: A psychophysical study. Brain Inj 21: 489–497. [DOI] [PubMed] [Google Scholar]
- Posner MI, Rafal RD, Choate LS, Vaughan J ( 1985): Inhibition of return: Neural basis and function. Cogn Neuropsychol 2: 211–228. [Google Scholar]
- Rafal RD, Posner MI ( 1987): Deficits in human visual spatial attention following thalamic lesions. Proc Natl Acad Sci USA 84: 7349–7353. [DOI] [PMC free article] [PubMed] [Google Scholar]
- Salmi J, Rinne T, Degerman A, Salonen O, Alho K ( 2007): Orienting and maintenance of spatial attention in audition and vision: Multimodal and modality‐specific brain activations. Brain Struct Funct 212: 181–194. [DOI] [PubMed] [Google Scholar]
- Sanchez‐Carrion R, Gomez PV, Junque C, Fernandez‐Espejo D, Falcon C, Bargallo N, Roig‐Rovira T, Ensenat‐Cantallops A, Bernabeu M ( 2008): Frontal hypoactivation on functional magnetic resonance imaging in working memory after severe diffuse traumatic brain injury. J Neurotrauma 25: 479–494. [DOI] [PubMed] [Google Scholar]
- Scheibel RS, Newsome MR, Steinberg JL, Pearson DA, Rauch RA, Mao H, Troyanskaya M, Sharma RG, Levin HS ( 2007): Altered brain activation during cognitive control in patients with moderate to severe traumatic brain injury. Neurorehabil Neural Repair 21: 36–45. [DOI] [PubMed] [Google Scholar]
- Schretlen DJ, Shapiro AM ( 2003): A quantitative review of the effects of traumatic brain injury on cognitive functioning. Int Rev Psychiatry 15: 341–349. [DOI] [PubMed] [Google Scholar]
- Smits M, Dippel DW, Houston GC, Wielopolski PA, Koudstaal PJ, Hunink MG, van der LA ( 2008): Postconcussion syndrome after minor head injury: Brain activation of working memory and attention. Hum Brain Mapp (in press). [DOI] [PMC free article] [PubMed] [Google Scholar]
- Soeda A, Nakashima T, Okumura A, Kuwata K, Shinoda J, Iwama T ( 2005): Cognitive impairment after traumatic brain injury: A functional magnetic resonance imaging study using the Stroop task. Neuroradiology 47: 501–506. [DOI] [PubMed] [Google Scholar]
- Sturzenegger M, Radanov BP, Winter P, Simko M, Farra AD, Di Stefano G ( 2008): MRI‐based brain volumetry in chronic whiplash patients: No evidence for traumatic brain injury. Acta Neurol Scand 117: 49–54. [DOI] [PubMed] [Google Scholar]
- Talairach J, Tournoux P ( 1988). Co‐Planar Steriotaxic Atlas of the Human Brain. New York: Thieme. [Google Scholar]
- Thiel CM, Zilles K, Fink GR ( 2004): Cerebral correlates of alerting, orienting and reorienting of visuospatial attention: An event‐related fMRI study. Neuroimage 21: 318–328. [DOI] [PubMed] [Google Scholar]
- Thurman DJ, Alverson C, Dunn KA, Guerrero J, Sniezek JE ( 1999): Traumatic brain injury in the United States: A public health perspective. J Head Trauma Rehabil 14: 602–615. [DOI] [PubMed] [Google Scholar]
- Topal NB, Hakyemez B, Erdogan C, Bulut M, Koksal O, Akkose S, Dogan S, Parlak M, Ozguc H, Korfali E ( 2008): MR imaging in the detection of diffuse axonal injury with mild traumatic brain injury. Neurol Res 30: 974–978. [DOI] [PubMed] [Google Scholar]
- Turner GR, Levine B ( 2008): Augmented neural activity during executive control processing following diffuse axonal injury. Neurology 71: 812–818. [DOI] [PMC free article] [PubMed] [Google Scholar]
- Ueda Y, Walker SA, Povlishock JT ( 2006): Perivascular nerve damage in the cerebral circulation following traumatic brain injury. Acta Neuropathol 112: 85–94. [DOI] [PubMed] [Google Scholar]
- Vagnozzi R, Signoretti S, Tavazzi B, Floris R, Ludovici A, Marziali S, Tarascio G, Amorini AM, Di Pietro V, Delfini R, Lazzarino G ( 2008): Temporal window of metabolic brain vulnerability to concussion: A pilot 1H‐magnetic resonance spectroscopic study in concussed athletes—Part III. Neurosurgery 62: 1286–1295. [DOI] [PubMed] [Google Scholar]
- Van Donkelaar P, Langan J, Rodriguez E, Drew A, Halterman C, Osternig LR, Chou LS ( 2005): Attentional deficits in concussion. Brain Inj 19: 1031–1039. [DOI] [PubMed] [Google Scholar]
- Zatorre RJ, Bouffard M, Ahad P, Belin P ( 2002): Where is ‘where’ in the human auditory cortex? Nat Neurosci 5: 905–909. [DOI] [PubMed] [Google Scholar]
Associated Data
This section collects any data citations, data availability statements, or supplementary materials included in this article.
Supplementary Materials
Additional Supporting Information may be found in the online version of this article.
Table I: Mild traumatic brain injury patients' injury information. Table II: Regions exhibiting increased activation during invalid compared to valid trials Table III: Regions showing a main effect of stimulus onset asynchrony (SOA; 200ms vs. 700ms).