Abstract
Objective
To study the growth of children with complete unilateral cleft lip and palate (UCLP) from birth to 2 years of age and to construct specific UCLP growth curves.
Design
Physical growth was a secondary outcome measure of a NIH sponsored longitudinal, prospective clinical trial involving the University of Florida (USA) and the University of São Paulo (Brazil).
Patients
627 children with UCLP, nonsyndromic, both genders.
Methods
Length, weight, and head circumference were prospectively measured for a group of children enrolled in a clinical trial. Median growth curves for the 3 parameters (length, weight, head circumference) were performed and compared to the median for the National Center for Health Statistics (NCHS, 2000) curves. The median values for length, weight, and head circumference at birth, 6, 12, 18 and 24 month of age were plotted against NCHS median values, and statistically compared at birth and 24 months.
Setting
Hospital de Reabilitação de Anomalias Craniofaciais, Universidade de São Paulo, Bauru, Brazil (HRAC-USP).
Results
At birth, children of both genders with UCLP presented with smaller body dimensions in relation to NCHS median values, but the results suggest a “catch up growth” for length, weight, and head circumference for girls and for weight (to some degree) and head circumference for boys.
Conclusions
Weight was the most compromised parameter for both genders followed by length and then head circumference. There was no evidence of short statue. This study established growth curves for children with UCLP.
Keywords: cleft palate, outcome measures, clinical trial, length, weight, head circumference, body stature
Investigators have studied the growth of children with cleft lip and palate (CLP). However, there continues to be controversy whether children with isolated clefts attain normal growth or do in fact show different growth patterns as compared to normal children. Physical growth of infants and children is a key health outcome. Inadequate physical growth, as in very small size, may indicate a number of concerns that include: inadequate nutrition, chronic health condition, or genetic condition or a syndrome. The National Center for Health Statistics (NCHS) growth charts are used as references for monitoring physical growth of infants and children in the United States and in many parts of the world.
Many physical growth studies of children with CLP have been published (Bowers et al., 1987; Felix-Schollaart et al., 1992; Ross and Jhonston, 1972; Cunninghan and Jerome, 1997; Becker et al., 1998; Montagnoli et al., 2005, Gopinath and Muda, 2005). Although the results vary between different investigators, most of them state that these children are smaller and lighter than the control subjects, mainly during the first years of age. A catch up growth may occur later in childhood (Ross and Jhonston, 1972; Lee et al., 1996).
Many factors such as feeding problems and recurrent respiratory infections have been suggested to negatively impact normal growth. Reports indicate that growth problems are more severe in early infancy and are more frequent in children with isolated cleft palate (ICP), and cleft lip and palate (CLP), than in children with isolated cleft lip or normal (unaffected) children (Felix-Schollaart et al., 1992; Lee et al., 1996, Montagnoli et al., 2005).
The limitations of previous growth studies include relatively small number of children included in their sample, possible inclusion of children with chronic health conditions and syndromes, and inclusion of different types of clefts or age ranges. Most studies were retrospective.
This article is part of a series of studies that summarize an eleven-year prospective randomized clinical trial. The objective of this paper was to analyze the physical growth of the large sample of nonsyndromic children with unilateral cleft lip and palate (UCLP), from birth to two years of age, according to gender, in a longitudinal and prospective study and to construct specific growth curves.
Methods
In 1994 the University of Florida Craniofacial Center (UFCFC) initiated a 10-year clinical trial sponsored by the National Institute of Health (NIH), in collaboration with the Hospital de Reabilitação de Anomalias Craniofaciais at the University of São Paulo (HRAC-USP), Bauru, Brazil. Physical growth was one of the secondary outcome measures of this trial. Length, weight, and head circumference were prospectively measured for all enrolled children, in a longitudinal and prospective study. This growth study included 627 infants with complete UCLP who were followed through the HRAC-USP outpatient clinic. Children with associated malformations, genetic syndromes, or chronic disease which could impact their growth were not included in the study. A little more than ninety percent of the sample (90.58%) (N=627) was born at term: between 38 and 42 weeks of gestation. The sample did not present infants born below 32 weeks of gestation. Since only 9.22% of the studied children were either born between 32 and 37 weeks of gestation (6.43%) and above 42 weeks of gestation (1.09%), or their parents did not know the birth gestational age (1.70%), no children were excluded. None of the children included in this study were tube fed and only 2.5% were breastfed for more than 30 days. All patients received care in the same facility by three pediatricians. The pediatric protocol of care included serial examinations in growth measurements (weight, length, and head circumference). Growth measurements techniques were standardized. Weight was obtained by using standard infant and toddler scales. Length was measured with a horizontal anthropometer with the child in the supine position. Length, weight, and head circumference were measured at each exam. Criteria defining small size were length, weight, and head circumference greater than two standard deviations below the median or below the third percentile for age and gender as compared to the National Center of Health Statistics (NCHS, 2000) growth charts. The weight, length and head circumference at birth were obtained by information provided by the parents. This study was approved by the Institutional Review Board (IRB) at the University of Florida and by the Ethical Committee at HRAC-USP.
Statistical Methods
Values for weight, length and head circumference were imputed for each time point tabulated except for birth (age 0) which used actual values (Table 1). The variables of length, weight and head circumference were imputed as show in Table 2 for males and females respectively.
Table 1.
Time Points Used to Create the Age Time Target Window
| Target Age | Minimum in Window | Maximum in Window |
|---|---|---|
| 0M* | 0M | 0M |
| 6 M | 0 M | 12 M |
| 12 M | 6M | 24 M |
| 18 M | 12 M | 30 M |
| 24 M | 18 M | 36 M |
Actual values used for birth, without imputation.
Table 2.
Distribution of Weight, Length and Head Circumference Measures According to Gender for Children with Unilateral Cleft Lip and Palate (UCLP) and Children Without (NCHS, 2000)
| Weight (kg) | ||||
|---|---|---|---|---|
| Gender | N | Age in Months | UCLP Median | NCHS Median |
| Male | 378 | birth | 3.20 | 3.53 |
| Male | 380 | 6 | 6.67 | 7.90 |
| Male | 251 | 12 | 9.66 | 10.30 |
| Male | 243 | 18 | 11.05 | 11.7 |
| Male | 224 | 24 | 12.40 | 12.7 |
| Female | 249 | birth | 3.10 | 3.4 |
| Female | 247 | 6 | 6.45 | 7.2 |
| Female | 174 | 12 | 8.97 | 9.5 |
| Female | 166 | 18 | 10.45 | 11.0 |
| Female | 152 | 24 | 11.96 | 12.1 |
| Length (cm) | ||||
| Gender | N | Age in Months | UCLP Median | NCHS Median |
| Male | 282 | birth | 49.00 | 50.0 |
| Male | 317 | 6 | 63.60 | 67.0 |
| Male | 251 | 12 | 75.01 | 75.6 |
| Male | 243 | 18 | 81.00 | 81.9 |
| Male | 223 | 24 | 86.00 | 87.3 |
| Female | 177 | birth | 48.00 | 49.3 |
| Female | 218 | 6 | 63.33 | 65.3 |
| Female | 173 | 12 | 73.99 | 73.8 |
| Female | 166 | 18 | 80.29 | 80.3 |
| Female | 152 | 24 | 85.86 | 85.8 |
| Head Circumference (cm) | ||||
| Gender | N | Age in Months | UCLP Median | NCHS Median |
| Male | 96 | birth | 35.00 | 35.8 |
| Male | 230 | 6 | 43.09 | 43.7 |
| Male | 243 | 12 | 46.80 | 46.35 |
| Male | 227 | 18 | 48.24 | 47.77 |
| Male | 178 | 24 | 49.00 | 48.67 |
| Female | 64 | birth | 34.00 | 34.7 |
| Female | 163 | 6 | 42.00 | 42.4 |
| Female | 165 | 12 | 45.75 | 45.03 |
| Female | 153 | 18 | 47.25 | 46.5 |
| Female | 118 | 24 | 48.01 | 47.5 |
Top Priority
If a subject had a measurement at the specific target month, i.e., 6, 12, 18, or 24 months (age rounded down to whole month), it was used.
Second Priority
If a subject had at least one measure at an age in the window before the target age and at least one in the target window after the age (See Table 1 for the window definitions), the value was interpolated from the latest before to the earliest after. For example, if the target was 24 M, and measures had been obtained at 21, 30, and 33 M, (3 in the window for the Target Age of 24 months), the 33M measure would be ignored, and take 6/9(Measure at 21 M) + 3/9(Measure at 30 months). Note that date of assessment which is closer to the target date receives a higher weighted value. Graphically, we join the two measures in the window surrounding on either side of the target date and draw a straight line between their values. The imputed value is where this line crosses the target age (24 months in this example).
Last Priority
If a subject had only one measurement in the target window, a general slope for the window is computed, consisting of all subjects with one measure before and one measure after the Target Age (second priority), and used that slope to extrapolate the growth measure from the observation in the window.
Subjects with no measurements obtained in the Target Age window were excluded. Also, no growth measures were used if the date of measurement was outside of the Target Age window. These data were used to calculate percentiles and other descriptive statistics by Target Age and gender. Smooth curves from these points were derived in constructing the graphs. The NCHS growth values and curves were used as a reference for normality. A CDC SAS program was used to express the median for subjects' growth measures by gender and age as a percentile of the NCHS same age and gender population. Statistical comparisons were done by calculating the individual Z-scores for each child's observation at the Target Age and gender, relative to the NCHS values. The Null hypothesis is that the target population Mean Z-score for the cleft population is zero. This hypothesis was tested via a one sample, two-sided t-test.
Results
The following results are presented separately for girls and boys. Table 2 provides a summary of the median weights, length and head circumference by age (birth, 6, 12, 18 and 24 months) for all studied subjects. In addition, Table 2 provides comparative NCHS values by age.
As can be seen in Figure 1, girls' (N = 177) median birth length was at the 30th percentile of NCHS values, revealing them to be shorter than the reference (P < 0.001). At 12 months, however, girls reached the NCHS median length values remaining even with the reference through the last measures made at two years of age (P = 0.52). Figure 1 also suggests a catch-up in length for girls before 12 months of age. As shown in Figure 2, girls' (N = 249) median birth weight was at the 27th percentile; revealing them to have significantly less weight than the NCHS values (P < 0.001). The girls' remained below the median value in weight until two years of age. At two years of age the girls' weight reached the 47th percentile (P = 0.14). Figure 2 also suggests a catch-up in weight for girls beginning at 18 months of age. As shown in Figure 3, the girls' (N = 64) birth head circumference was at the 33rd percentile revealing significantly smaller head size compared to NCHS (P = 0.0030). At six months of age, the girls' head circumference reached the NHCH median value and at nine months surpassed the median. At two years of age, girls' head circumference was at the 65th percentile (P < 0.001). As can be seen in Figure 4, boys' (N = 378) median lengths at birth and at two years of age were at the 36th percentile (P < 0.001 at both birth and age two) revealing their length to be short compared to NCHS but within normal limits as defined for this study. Boys' (N = 378) birth weight, as graphed in Figure 5, was at the 28th percentile revealing weight to be significantly less than the NCHS values (P < 0.001). At two years of age, however, boys' weight was at the 42nd percentile (P = 0.0063) which although significantly below the NCHS median, was less extreme than at birth. Figure 5 also suggests a catch-up in weight for boys beginning at 18 months of age. Figure 6 illustrates the boys' (N = 96) head circumference at the 34th percentile which although is significantly less than the NCHS values (P < 0.001). By 12 months of age boys' head circumference crossed the NCHS median curve, and by two years of age boys' head circumference was at the 59th percentile (P = 0.018).
Figure 1.
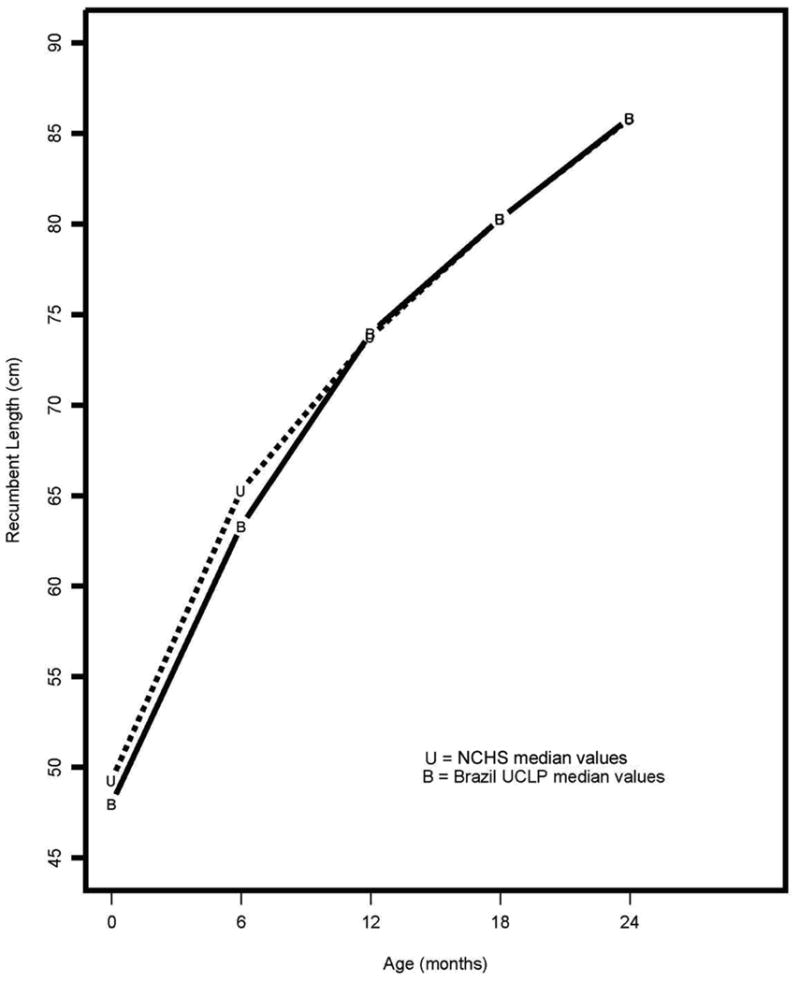
Median Length for Girls by age
Figure 2.
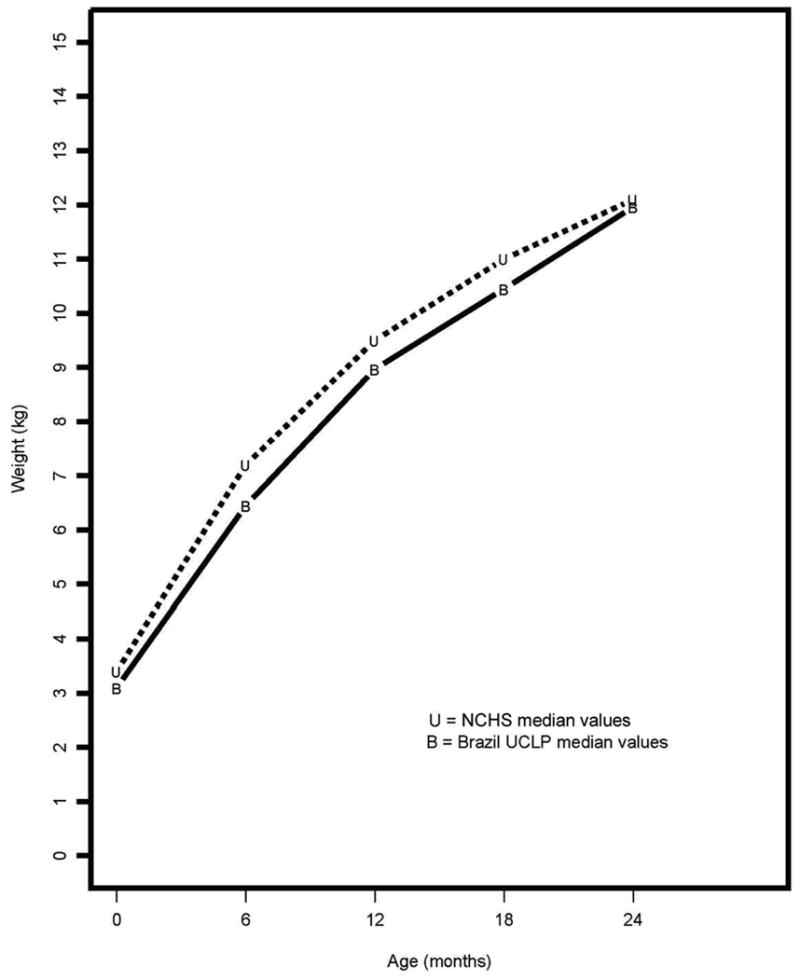
Median Weight for Girls by age
Figure 3.
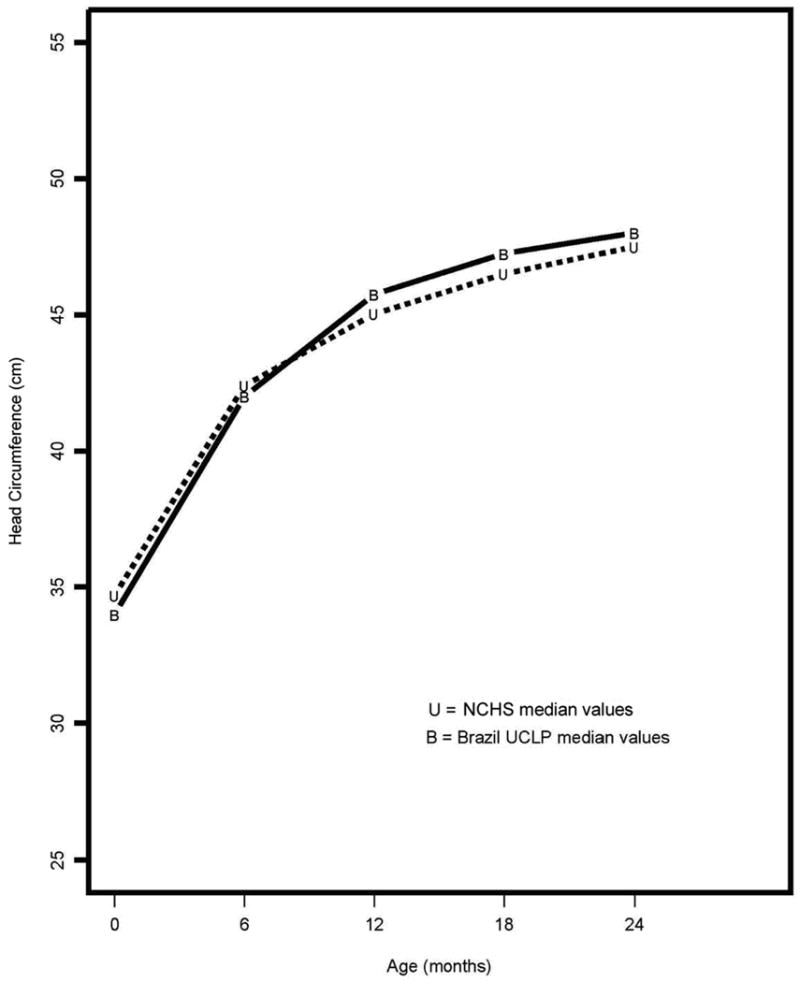
Median Head Circumference for Girls by age
Figure 4.
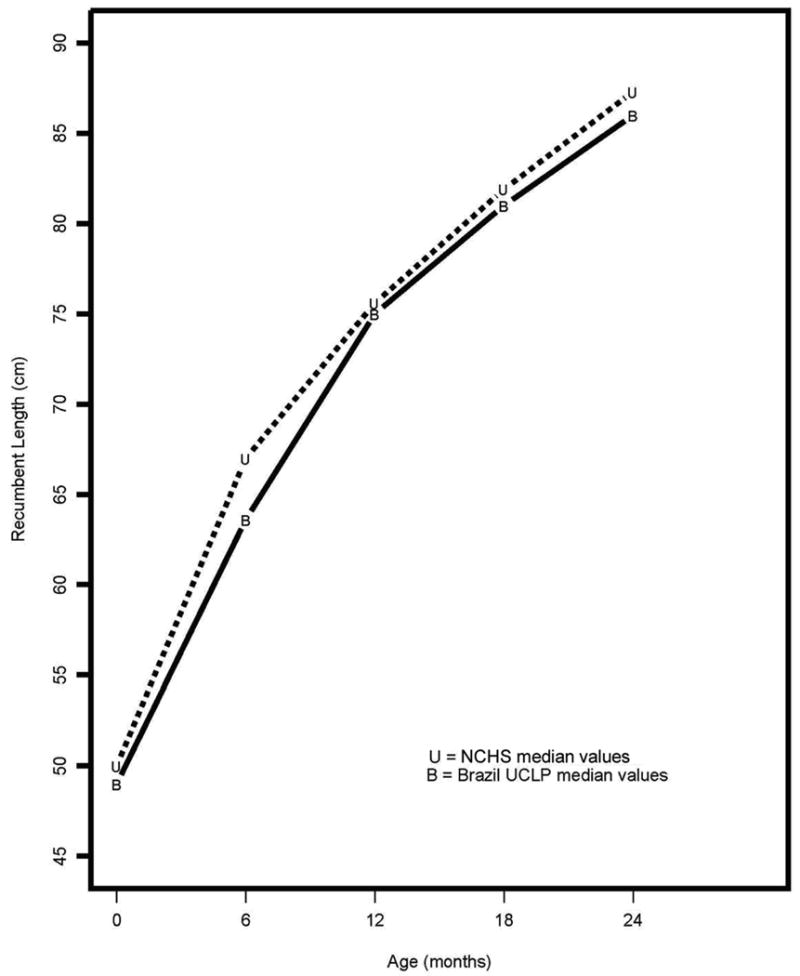
Median Length for Boys by age
Figure 5.
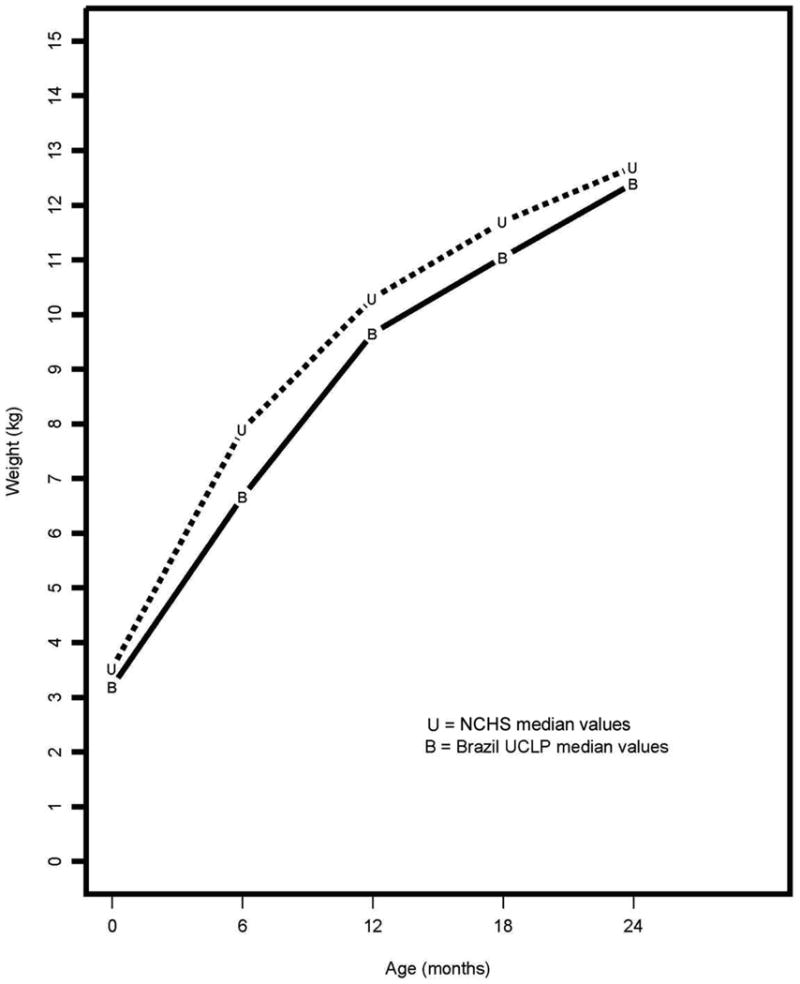
Median Weight for Boys by age
Figure 6.
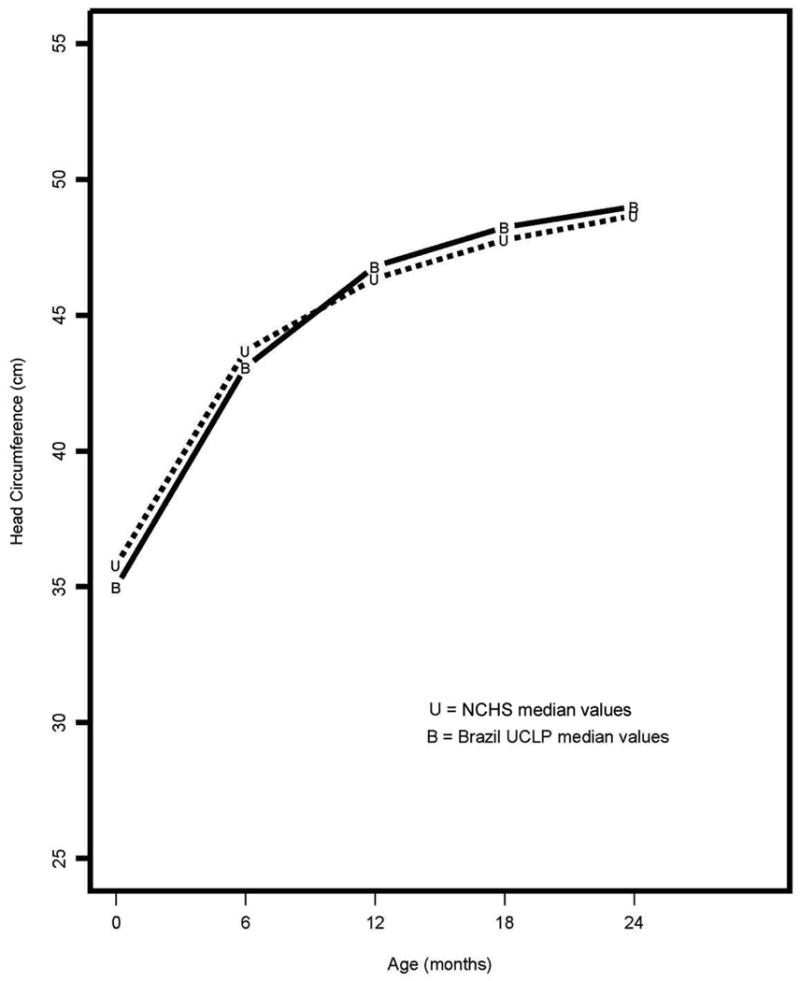
Median Head Circumference for Boys by age
Discussion and Conclusions
The majority of studies reporting growth of children with clefts detected physical growth deficiencies in length and weight for children with CLP and ICP, especially during the first year of life when the primary palatoplasty had not yet been done (Seth and McWilliams, 1998; Day, 1985; Jones, 1988; Pandya and Booman, 2001; Lee et al., 1996; Montagnoli et al., 2005). Growth deficiency observed during this period has been attributed to environmental factors including the high frequency of infectious diseases (Seth and McWilliams, 1998) and the different degrees of difficulties encountered to feed the children with cleft palate (Drillen et al., 1966; Coy et al., 2000; Montagnoli et al., 2005).
After 2 years of age the biological factors have a greater influence than environmental factors in regulating growth (Coy et al., 2000). In the literature there are speculations regarding growth hormone (GH) deficiency in children with CLP which effects can be noted during the second or third year of life (Laron et al., 1967; Rudman et al., 1978). Controversy regarding GH deficiency and clefts is still found in the literature with some authors reporting no associations between orofacial clefting and GH deficiency (Koster et al., 1984) as well as between CLP and the risk for short stature in children with UCLP between 4 and 10 years of age (Nackashi et al., 1998).
Some studies have emphasized the importance of a precise diagnosis of the type of cleft lip and palate for growth assessment using populations as homogenous as possible. They assumed that child with CLP without associated genetic syndromes will follow a growth pattern that is reflected in one of the percentiles of the reference curve; thus deviations from this growth trajectory should be taken into account in the same way as done for a child without cleft (Day, 1985; Bowers et al., 1987). In contrast, other investigators (Rudman et al., 1978; Ranke, 1989; Cunninghan, 1997; Lipman et al., 1999) have stated that children with congenital malformations or genetic syndromes assume their own growth pattern, which might differ from that of normal children, and represent groups with their own “disease-specific” growth pattern.
Another controversial issue has been related to weight, length, and head circumference of children with clefts at birth. The majority of studies demonstrated that children with CLP presented with smaller body dimensions when compared with typical children (Ross and Johnston, 1972; Rudman et al., 1978; Duncan, 1983). Some authors have suggested an association between the severity of intrauterine growth deficiency with the width of the cleft, with infants with CLP presenting greater risk for low birth weight birth for gestational age (Becker et al., 1998).
The contribution of the present study in relation to the questions posed above has been the presentation of longitudinal growth data for length, weight and head circumference during the period between birth and 2 years of age on a large sample. The data set yielded the establishment of gender specific growth curves for children with UCLP.
In the present study we used the NCHS 2000 growth curves as the reference for normal growth because they are recommended by World Health Organization (WHO) for international growth studies and by Brazilian Health Service for growth monitoring. For growth studies, the ideal procedure would be to evaluate the children at regular intervals to facilitate the statistical analysis but in this study it was not possible. The HRAC-USP is one of the major reference centers for craniofacial malformations in Brazil which receives patients from distant locations. For this reason, returns for reevaluations (pre- and post-operative) were established following the clinical trial protocol and availability of the family. Even with this limitation, this data set is one of the largest prospective and longitudinal growth studies ever published for children with CLP.
In conclusion, children of both gender in this study presented with smaller body dimensions in relation to typical children. The results, however, suggest a “catch up growth” for length, weight, and head circumference for girls and for weight and head circumference for boys. Even though boys did not present a “catch up growth” for length, all median values found were within the normal range during the 2 years studied. Weight was the most compromised parameter for both genders followed by length and then head circumference. The median for the head circumference parameter was found to be very close to the NCHS median during the entire studied period, below the median at birth and the only growth parameter above the median at two years of age for girls and boys. Nutritional difficulties may have compromised growth since weight was the most compromised growth parameter and is the parameter most susceptible to inadequate nutrition. The weight and length at birth were lower for the children with UCLP when compared to the norms. A pattern towards “smaller size” was found particularly for weight for girls at birth.
Finally, the growth curves established in this study can be used along with reference curves to monitor the growth of children with UCLP. The population studied was enrolled using inclusion criteria to screen out other malformations, syndromes or health conditions that could have negatively impacted the children's overall health status. Deviations from these curves found in children with UCLP could indicate other conditions or complications.
Acknowledgments
The authors wish to acknowledge the financial support of NIH/NIDCR (R01-DE10437), the members of the DSMB who contributed without remuneration hundreds of hours of their time over the course of this study, the patients and their families, staff and professionals at HRAC-USP who assisted in the conduct of this long-term study, and to Dr. Sue McGorray for statistical support. Special gratitude goes to Dr. José Alberto de Souza Freitas, Superintendant of HRAC-USP for his support in the assessment of treatment outcomes.
This study was funded in part by NIH/NIDCR, R01-DE10437
Footnotes
Part of this work was presented at The 63rd Annual Meeting of the American Cleft Palate-Craniofacial Association, Vancouver, B.C., April, 2006.
References
- Becker M, Svensson H, Kallen B. Birth weight, body length, and cranial circumference in newborns with cleft lip or palate. Cleft Palate Craniofac J. 1998;35:255–261. doi: 10.1597/1545-1569_1998_035_0255_bwblac_2.3.co_2. [DOI] [PubMed] [Google Scholar]
- Bowers EJ, Mayro RF, Whitaker LA, Pasquariello OS, LaRossa D, Randall P. General body growth in children with clefts of the lip, palate and craniofacial structure. Scand J Plast Reconst Surg. 1987;21:7–14. doi: 10.3109/02844318709083572. [DOI] [PubMed] [Google Scholar]
- Coy K, Speltz ML, Jones K, Hill S, Omnell ML. Do psychosocial variables predict the physical growth of infants with orofacial clefts? J Dev Behav Pediatr. 2000;21:198–206. [PubMed] [Google Scholar]
- Cunningham ML, Jerome JT. Linear growth characteristics of children with cleft lip and palate. J Pediatr. 1997;131:707–711. doi: 10.1016/s0022-3476(97)70097-0. [DOI] [PubMed] [Google Scholar]
- Day WD. Accurate diagnosis and assessment of growth in patients with orofacial clefting. Birth Defects. 1985;21:1–14. [PubMed] [Google Scholar]
- Drillen CM, Ingram TTS, Wilkinson EM. The causes and natural history of cleft lip and palate. Baltimore: Williams and Wilkins; 1966. [Google Scholar]
- Duncan PA, Shapiro LR, Soley L, Turet SE. Linear growth patterns in patients with cleft lip or palate or both. Am J Dis Child. 1983;137:159–163. doi: 10.1001/archpedi.1983.02140280051014. [DOI] [PubMed] [Google Scholar]
- Felix-Schollaart B, Hoesksma J, Phral-Andersen B. Growth comparison between children with cleft lip and/or palate and controls. Cleft Palate J. 1992;29:475–480. doi: 10.1597/1545-1569_1992_029_0475_gcbcwc_2.3.co_2. [DOI] [PubMed] [Google Scholar]
- Gopinath VK, Muda WA. Assesment of growth and feeding in children with cleft lip and palate. Southest Asian J Trop Med Public Health. 2005;36:254–258. [PubMed] [Google Scholar]
- Jones BJ. Weight gain and feeding in the neonate with cleft: a three-center study. Cleft Palate J. 1988;25:379–384. [PubMed] [Google Scholar]
- Koster K, Butenandt D, Coerdt I. Wachstum und waschstum hormon bei kindern nut angeborenen lyppenkieger- gaumens palten. Klin paediat. 1984;196:304–306. doi: 10.1055/s-2008-1034084. [DOI] [PubMed] [Google Scholar]
- Laron Z, Taube E, Kaplan I. Pituitary growth hormone insufficiency associated with cleft. lip. and palate. Helv Paediatr Acta. 1969;24:576–581. [PubMed] [Google Scholar]
- Lee J, Nunn J, Wright C. Height and weight achievement in cleft lip and palate. Arch Dis Child. 1997;76:70–72. doi: 10.1136/adc.76.1.70a. [DOI] [PMC free article] [PubMed] [Google Scholar]
- Lipman TH, Rezvani I, Mitra A, Mastropieri CJ. Assessment of stature in children with orofacial clefting. Am J Matern Child Nurs. 1999;24:252–256. doi: 10.1097/00005721-199909000-00009. [DOI] [PubMed] [Google Scholar]
- Montagnoli LC, Barbieri MA, Bettiol H, Marques IL, de Souza L. Growth impairment of children with diferent types of lip and palate clefts in the first 2 years of life: a cross sectional study. J Pediatr (Rio J) 2005;81:461–465. doi: 10.2223/JPED.1420. [DOI] [PubMed] [Google Scholar]
- Nackashi JA, Rosenbloon AL, Marks R, Williams WN, Seagle MB, Frolova LE. Stature of Russian children with isolated cleft lip and palate. Cleft Palate Craniofac J. 1998;35:500–502. doi: 10.1597/1545-1569_1998_035_0500_sorcwi_2.3.co_2. [DOI] [PubMed] [Google Scholar]
- National Center for Health Statistics. NCHS growth curves for children birth-18 years. Hyattsville: Public Health Service; 2000. [PubMed] [Google Scholar]
- Pandya AN, Boorman JG. Failure to thrive in babies with cleft lip and palate. Br J Plast Surg. 2001;54:471–475. doi: 10.1054/bjps.2001.3618. [DOI] [PubMed] [Google Scholar]
- Ranke MB. Disease-specific growth charts – do we need them? Acta Paediatr Scand. 1989;356(Suppl):17–25. doi: 10.1111/j.1651-2227.1989.tb11236.x. [DOI] [PubMed] [Google Scholar]
- Ross RB, Jhonston MC. Cleft Lip and Palate. Baltimore: Williams and Wilkins; 1972. [Google Scholar]
- Rudman D, Davis T, Priest JH, Patterson JH, Kutner MH, Heymsfield SB, Bethel RA. Prevalence of growth hormone deficiency in children with cleft lip or palate. J Pediatr. 1978;93:378–382. doi: 10.1016/s0022-3476(78)81141-x. [DOI] [PubMed] [Google Scholar]
- Seth AK, Mc William BJ. Weight gain in children with cleft palate from birth to two years. Cleft Palate J. 1988;25:146–150. [PubMed] [Google Scholar]


