Abstract
We recently reported that mouse astrocytes express leptin receptors (ObR), and that obesity induces upregulation of astrocytic ObR. To provide further evidence of the importance of astrocytic ObR expression, we performed double-labeling fluorescent in-situ hybridization (FISH) and immunohistochemistry in the rat hypothalamus. Laser confocal microscopic image analysis showed that ObR mRNA was present in glial fibrillary acidic protein (+) cells that show distinctive astrocytic morphology as well as in neurons. In addition to the presence of ObR mRNA, ObR protein was shown in both astrocytes and neurons in the rat hypothalamus by double-labeling immunohistochemistry. In cultured rat C6 astrocytoma cells treated with different doses of lipopolysaccharide for 6 h, the mRNA for ObRa or ObRb did not show significant changes, as measured by quantitative RT-PCR. However, the protein expression of both ObRa and ObRb, determined by western blotting, was increased after the C6 cells were treated with either lipopolysaccharide or tumor necrosis factor-α. The results indicate that astrocytic ObR expression is present in rats as well as mice, and that it probably plays a role in the neuroinflammatory response.
Keywords: Leptin, ObR, mRNA, Astrocytes, Lipopolysaccharide, TNF, Fluorescent in-situ hybridization, Immunohistochemistry
Introduction
Since the discovery of leptin as a major anorexic adipokine that acts on the hypothalamus to reduce food intake, most neuroscientists have focused on the neuronal functions of the leptin system. Unexpectedly, in both C57 male mice fed a high-fat diet [8] and mice with a genetic predisposition to obesity resulting from the agouti viable yellow (Avy) mutation [14], there is robust upregulation of leptin receptor (ObR) immunoreactivity in glial fibrillary acidic protein (GFAP) (+) astrocytes in the hypothalamus. Adult-onset obesity is associated with hyperleptinemia and partial saturation of leptin transport across the blood-brain barrier (BBB) [1,2,10,16]. Leptin is also transported across the blood-cerebrospinal fluid barrier by a high-capacity transport system [12,21]. However, the fate of leptin after it reaches the CNS and its regulatory changes in situations of altered energy metabolism have not been fully elucidated. The demonstration that astrocytes express ObR and respond to leptin by calcium signaling [8] has expanded our understanding of the leptin system in the brain. Here we further characterize the astrocytic ObR and test whether it is species-specific by performing fluorescent in-situ hybridization (FISH) and double-labeling immunohistochemistry (IHC) in the rat hypothalamus.
Regulatory changes of ObR expression have been shown in both hypothalamic homogenates and enriched cerebral microvessels composing the BBB [15]. In the hypothalamus, ObRa is higher in neonates, but ObRb is higher in adult mice. In cerebral microvessels, both ObRa and ObRb mRNA show age-dependent reductions from neonates to young adults. Another short form receptor ObRc and the soluble receptor ObRe showed similar changes as that of ObRa. Besides normal developmental changes, progression of obesity is also associated with a shift of a neuronal predominant expression pattern to an astrocytic preference in mice [14]. Morash et al. have shown that the level of leptin expression in rat C6 astrocytoma cells is decreased by corticosterone but increased by dbcAMP, insulin-like growth factor-1, and insulin, and that leptin acts on its receptor ObRa in an autocrine manner [13]. Our previoius results also show that C6 cells express ObRa and ObRb mRNA but not ObRc or ObRe mRNA [8]. Therefore we further determined whether C6 cells respond to lipopolysaccharide (LPS), a strong proinflammatory stimulus, by altered expression of ObR isoforms. The effect of LPS was compared with that of tumor necrosis factor α (TNF), a cytokine stimulated by LPS and often sharing or mediating the functions of LPS [19].
Materials and Methods
Double-labeling fluorescent in-situ hybridization (FISH) and immunofluorescent histochemistry (IHC)
As approved by the Institutional Animal Care and Use Committee, adult Long-Evan's rats of 3 month-old were anesthetized by intraperitoneal inactin and perfused intracardially with 200 ml of normal saline, followed by 500 ml of 4 % paraformaldehyde (PFA). The brain was postfixed in 4 % PFA and cryoprotected in 30 % sucrose. Coronal sections of 20 μm thickness across the hypothalamus were obtained with a sliding microtome, and mounted on slides. The slides were air-dried overnight, and briefly (< 3 min) placed in an oven at 80 °C to facilitate firm attachment of the sections to the slides. The slides were then stored in a slide box with desiccant at −80 °C until use. To prevent contamination of the RNase, the solutions were prepared with DEPC-treated water. The slides, instruments, and bench area were treated with RNaseZap (Ambion, Inc., Austin, TX).
After removal from the freezer, the slides were allowed to return to room temperature before the initiation of FISH staining. The staining procedure followed instructions of the HybriProbeTM custom design kit that accompanied the ObR probes (Accession No: RNU52966/AF304191, Biognostik, Göttingen, Germany) with some modifications. In brief, the sections were rinsed 3 times with phosphate-buffered saline (PBS) followed by 5 min incubations with 0.25 % and then 0.5 % (v/v) acetic anhydride, (Fisher Scientific, Pittsburgh, PA) at room temperature. After being rinsed twice with 1x SSC (Ambion), the sections were incubated with proteinase K (200 μg/ml prepared in DEPC water, Ambion) at 39 °C for 30 min, and followed by 1 min wash with glycine (2 mg/ml in PBS) and subsequently with two PBS washes. The sections were exposed to prehybridization buffer at 45 °C for 2 h. After two rinses with PBS, the sections were hybridized with 2 ObR probes (Table 1) that were custom labeled with digoxigenin at the 5’ end (Biognostik) and dissolved in hybridization buffer at the concentration of 4 units/100 μl/section (1 unit = 3 pmol) in a humidified chamber at 45 °C over night. Another 2 ObR probes designed based on the sense mRNA sequence were used as negative controls (Table 1). After 2 quick rinses and then a 5 min wash with 1x SSC, the sections were incubated in 0.5x SSC twice at 39 °C (15 min each). The sections were blocked with 5 % sheep serum at room temperature for 1 h followed by incubation in PBS containing rhodamine conjugated anti-digoxin antibody (1:200, Jackson ImmunoResearch Laboratories, West Grove, PA), and then incubated at 39 °C for 2 h.
Table 1.
Rat ObR probes for FISH
| Anti-sense probes | Sense probes (negative control) | |
|---|---|---|
|
Probe 1 |
CGGTACAATGACATACAGCCCTGCATCATT |
GCTGACTACGACCAGACAAAGTACCATTTG |
| Probe 2 | TAAGTCCTTGTGCCCAGGAACAATTCTTGG | TCCTCAGTGTCTCTGTACGTCAGGTCAAT |
After 3 PBS washes and blocking with 10 % normal donkey serum at room temperature for 1 h, the slides were incubated with antibody against GFAP (Chemicon, AB5804, rabbit polyclonal, 1:500) at 4 °C overnight and then Alexa488-labeled secondary antibody (Invitrogen, Eugene, OR) at room temperature for 1 h, with thorough washes in between each step. The sections were coverslipped with DAPI-containing mounting medium, and imaged with an Olympus FV1000 confocal microscopy for potential colocalization of ObR mRNA with the GFAP immunoreactivity within the same cells.
For double-labeling IHC, we used the M-18 antibody (sc-1834; Santa Cruz Biotechnology, Santa Cruz, CA) that recognizes the membrane juxtapositional cytoplasmic domain (aa 877-894) of ObR. Anti-GFAP or anti-neuronal nuclei (anti-NeuN, MAB377B, 1:100; Chemicon) primary antibodies were also used in the double-labeling process. The detailed procedures were the same as described previously [8,14]. After overnight incubation at 4 °C, the sections were incubated with Alexa488 or Alexa594-labeled secondary antibodies (Invitrogen) at room temperature for 1 h.
Quantitative PCR to measure ObRa and ObRb mRNA in C6 cells after LPS treatment
The C6 astrocytoma cells (American Type Culture Collection, ATCC, Manassas, VA) were seeded on 12-well plate and cultured with medium containing Dulbecco's Modified Eagle Medium (DMEM), 10 % fetal bovine serum (FBS) and penicillin/streptomycin. When the cells reached 90 % confluency, they were starved by culture in DMEM only. Twenty-four h later, the cells were treated with LPS (0, 5, 10, or 20 μg/ml) (Sigma, St. Louise, MO) in DMEM and 10 % FBS (n = 2 /group), with the 0 group receiving medium only. Six h later, the cells were rinsed with prewarmed PBS and collected in RNA lysis buffer containing β-mercaptoethanol. Total RNA was extracted with an Absolutely RNA Miniprep Kit (Stratagene, La Jolla, CA). Reverse transcription of the total RNA to cDNA was achieved with a High Capacity cDNA Transcription Kit (Applied Biosystems, Foster City, CA). The quantitative PCR amplification of ObRa and ObRb was performed with the Power SYBR Green PCR Master Mix on a 7900HT Fast Real-Time PCR System (Applied Biosystems). ANOVA was used to compare the differences in the amount of ObR mRNA between groups.
Western blotting to analyze ObR expression in C6 after TNF or LPS treatment
C6 cells were treated after 24 h of serum starvation at their confluency as described above. TNF (Biosource, Camarillo, CA) was used at final concentrations of 2.5, 5, or 10 ng/ml. LPS was used at 10 or 20 μg/ml. The control group was incubated with medium only. Six h later, the cells were collected by scraping and lysed in Radioimmunoprecipitation Assay (RIPA) buffer in the presence of complete protease inhibitor cocktail (Pierce, Rockford, IL) at 4 °C. Protein concentration was determined with a Micro BCATM Protein Assay Kit (Pierce). Forty μg of protein was electrophoresed on 10 % SDS-PAGE, transferred to cellulose membrane, blocked, and probed with anti-ObR antibody (M-18, Santa Cruz). The expression of β-actin was also determined as a loading control. After further incubation with horseradish peroxidase-conjugated secondary antibodies, the signals were developed with enhanced chemiluminence agent (Pierce). The signal intensity was determined by use of the NIH Image J program.
Results
1. Colocalization of ObR mRNA and GFAP immunoreactivity
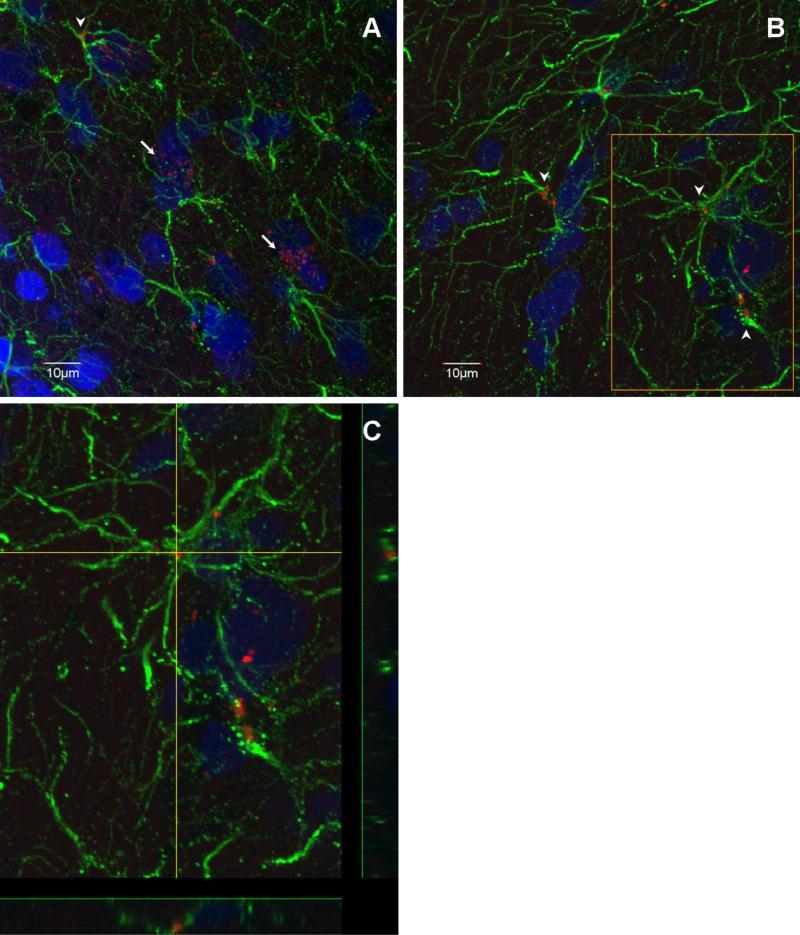
In rat hypothalamus, most of the ObR mRNA was present in large nucleated cells, suggesting neuronal localization. The specificity of the detection of ObR mRNA was supported by the lack of FISH signal in the negative control sections hybridized with sense ObR probes (Fig.1). In addition to the neuronal type of localization of ObR mRNA (arrows in figure 2A), there was a substantial amount of ObR mRNA signal in GFAP immunopositive cells (arrowheads in figure 2A-B). The fibrous processes of GFAP fluorescence indicate that they are astrocytes, rather than GFAP (+) neural progenitor cells (Fig.2C).
Fig. 1.
The specificity of ObR mRNA by FISH is shown (A) by the absence of signal in the negative control where the sense ObR probes were applied and (B) by ObR mRNA in the perinuclear region (red, shown by the arrow) in the presence of the ObR probes. The nuclei are shown by DAPI staining (blue). Scale bar = 10 μm.
Fig. 2.
ObR FISH and GFAP IHC double-labeling. (A) Most of the ObR mRNA signal (red) is seen in or around nuclei (blue) (arrows), representing a neuronal pattern. (B) Some GFAP (+) cells (green) also expressed ObR mRNA (arrow heads). (C) Higher magnification image of the demarcated area in (B), showing the presence of ObR mRNA within a GFAP (+) cell. Scale bar = 10 μm.
2. ObR immunofluorescence was colocalized with either GFAP or NeuN
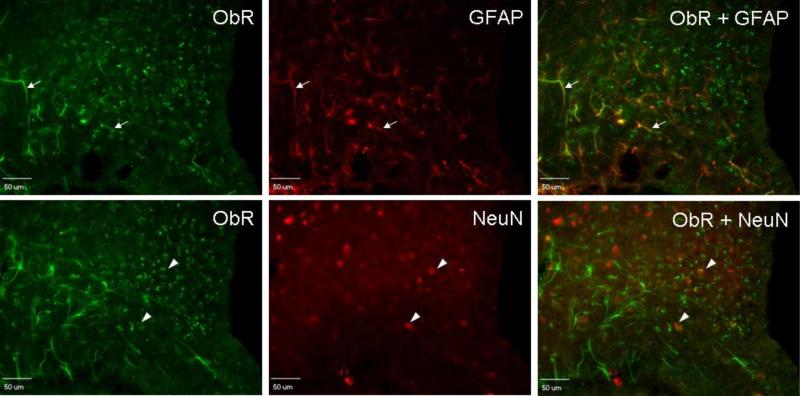
The arcuate nucleus of the rat hypothalamus showed strong immunoreactivity to the M18 antibody. Colocalization ObR with both GFAP and NeuN was seen in different cells (Fig.3). Thus, both astrocytes and neurons in the rat hypothalamus express ObR, similar to that shown in B6 and Avy mice [8,14].
Fig. 3.
Double-labeling IHC showing astrocytic expression of ObR in rat hypothalamus. Astrocytes were immunostained with anti-GFAP (red, arrows), whereas neurons were immunostained with anti-NeuN (red, arrow heads). Yellow coloration indicates colocalization. Scale bar = 50 μm.
3. Lack of effect of LPS treatment on ObR mRNA expression in C6 astrocytoma cells
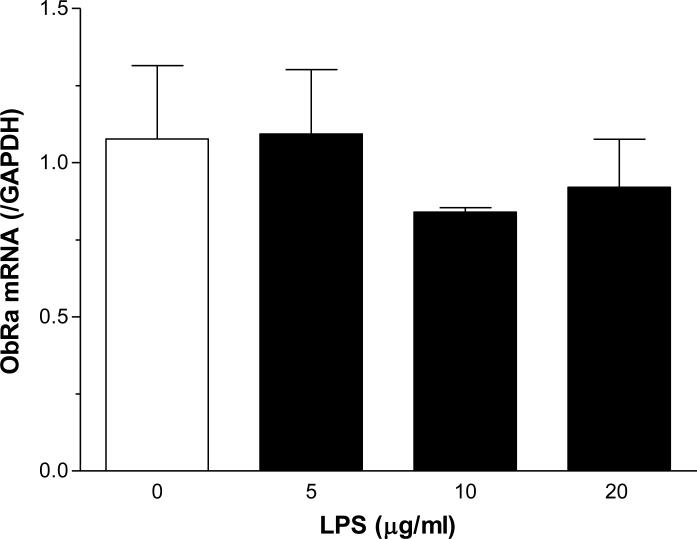
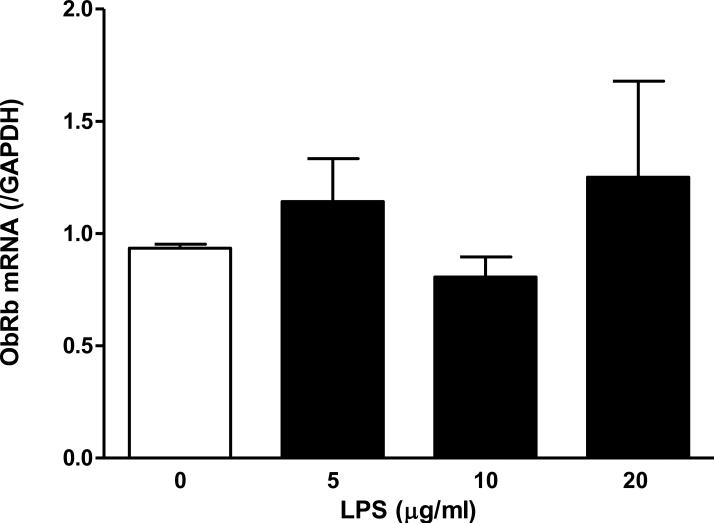
The ObR probes available to perform FISH target a shared region for ObRa and ObRb, so that it was not possible to determine the receptor isoforms. The M18 antibody also recognizes both short and long forms, although it has higher affinity for the short forms than for ObRb. Thus, we performed quantitative PCR to further determine the presence and regulation of ObRa and ObRb in C6 rat astrocytoma cells. At 6 h after LPS treatment at doses 5, 10, or 20 μg/ml, neither ObRa (F(3,7) = 0.49, P = 0.71, Fig.4A) nor ObRb (F(3,7) = 0.71, P = 0.60, Fig.4B) showed a significant change from the basal level of mRNA expression.
Fig. 4.
ObR mRNA expression in C6 cells 6 h after LPS treatment. There was no significant change in either ObRa (A) or ObRb (B) at the doses of LPS tested.
4. ObRa showed upregulation at the level of protein expression in response to both LPS and TNF
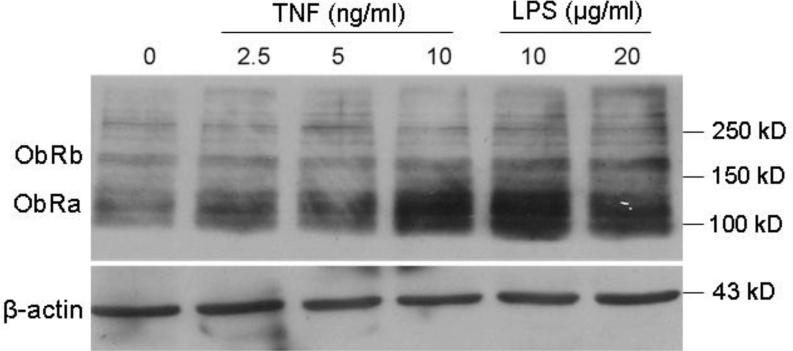
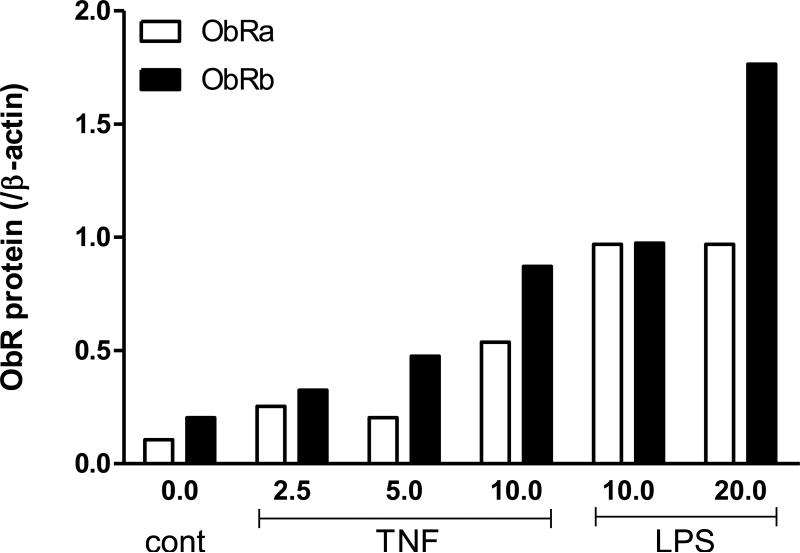
It is not uncommon that regulatory changes in protein expression can occur independent from transcriptional changes. Western blotting was performed to determine whether LPS and TNF (a proinflammatory cytokine increased by LPS in many types of cells) affect the level of ObR protein expression. TNF and LPS induced dose-dependent increases of ObRa and ObRb proteins (Fig. 5A-B). This is in contrast with the lack of effect of LPS on ObR mRNA expression shown above in figure 4.
Fig. 5.
ObR protein expression in C6 cells 6 h after TNF or LPS treatment. (A) Both TNF and LPS induced dose-dependent increases of ObRa (120 kD) and ObRb (180 kD). Densitometry analysis showed that the highest levels of increase occurred at 10 ng/ml for the TNF-treated cells and 20 μg/ml for the LPS-treated cells.
Discussion
In this study we show for the first time imaging evidence of the presence of ObR mRNA in astrocytes, and illustrate regulatory changes of ObR protein expression by proinflammatory stimuli in cultured C6 astrocytoma cells. Although we have reported that astrocytes can express ObR and upregulate ObR in mouse models of adult-onset obesity [8,14], skepticism that ObR can ever be present in astrocytes has been a major hurdle. While this is not unusual since many novel concepts encounter resistance, particularly in the peptide field [9,11,17], the dogma that neurons are the main responsive cells within the CNS has become an apparent obstacle in attempts to move the field forward.
In regards to the specificity of polyclonal antibodies, the absence of immunostaining in knockout mice has been considered a golden standard. However, there is no knockout strain available with complete absence of all isoforms of the leptin receptor. One misconception is that db/db mice should be devoid of ObR immunostaining. However, db/db mice only lack ObRb whereas other ObR isoforms are still present. Nonetheless, we have performed a series of studies to show the presence of ObR at both protein and mRNA levels, and showed the lack of signal in all negative controls currently available. In mice we have demonstrated (a) the lack of ObR signals in preabsorption controls, (b) the presence of immunostaining by use of multiple ObR antibodies, (c) the presence of ObRa, ObRb, ObRc, and ObRe mRNA in primary astrocytes, and (d) the signaling response of primary astrocytes in response to leptin by calcium imaging. Since some reviewers continue to refuse to be convinced of the presence of astrocytic ObR, we provide additional evidence here by double-labeling FISH and astrocytic ObR upregulation induced by neuroinflammation.
A major advantage of FISH is that we were able to perform confocal colocalization studies. The ObR mRNA was visualized after incubation of the tissue sections with the digoxigenin-labeled ObR probe and a rhodamine-labeled anti-digoxin antibody. The location of GFAP was shown by immunostaining with an anti-GFAP primary antibody and the respective Alexa488-labeled secondary antibody. The fibrous morphology of the GFAP (+) cells encompassing the ObR mRNA signal clearly indicates the presence of astrocytic ObR mRNA.
At the protein level, co-staining of ObR and GFAP also show that a substantial number of ObR (+) cells are astrocytes. We used a polyclonal antibody that recognizes the membrane juxtapositional cytoplasmic domain (aa 877-894) of ObR. The antibody is reactive to all membrane-bound ObR isoforms, although the short isoforms (ObRa, ObRc in mice or ObRd in rats) show greater affinity than the long isoform ObRb. The reason we were able to identify both astrocytic and neuronal staining is probably because (a) we performed double-labeling with astrocytic markers, and (b) the M18 antibody recognizes short isoforms of ObR in addition to the ObRb isoform targeted by antibodies used in rats in the past.
The distribution of long-form ObRb mRNA in rat brain has been shown by in-situ hybridization with a 32P-labeled probe [7]. The results showed that the arcuate, dorsomedial, ventromedial, and ventral premammillary nuclei had the most dense signals of ObRb. The distribution of all isoforms, shown by use of a probe recognizing all known forms, is even wider, and includes intense labeling in the choroid plexus, meninges, and also surrounding blood vessels. ObRb is more prevalent in neurons, whereas the short form ObRa has a higher level of expression in BBB microvessels, shown by quantitative RT-PCR as well as in-situ hybridization [3]. The lack of attention to astrocytic ObR probably resulted from the lack of phenotypic characterization in the initial radioprobe used in the in-situ hybridization studies, and by the higher level of ObR expression in neurons than in astrocytes in the basal state in many brain regions. Nonetheless, we have shown by quantitative PCR that primary mouse astrocytes have a high level of ObRa, a low amount of ObRb, the short isoform ObRc, and the soluble receptor ObRe [8]. The observation that astrocytic ObR immunoreactivity has robust upregulation in mouse models of adult-onset obesity in the hypothalamus suggests an important role of astrocytes in regulating leptin signaling.
Although we were the first to show the involvement of astrocytes in obesity, there are several reports of the presence of ObR on astrocytes [4-6,13]. The presence of ObR in C6 rat astrocytoma cells enabled us to further determine the potential regulatory changes of ObR in neuroinflammation. Whereas neither ObRa nor ObRb mRNA showed a significant change 6 h after LPS challenge, the protein expression of both isoforms showed a major increase in response to LPS. TNF, a mediator of many of the actions of LPS, also increased ObRa and ObRb in a dose-dependent manner. Although it is also possible that mRNA was increased earlier than the duration of study (6 h), we have seen situations in which regulatory changes occur predominantly at the protein level. Specifically, TNF downregulates the gp190 receptor for leukemia inhibitory factor [20] and activates the protein expression of interleukin-15 before altering its mRNA level in RBE4 cerebral endothelial cells [18]. This probably represents an immediate need of the cells to mount an acute response to inflammatory stimuli.
In summary, we show by double-labeling FISH and IHC that both ObR mRNA and protein are produced by astrocytes in the rat hypothalamus. Astrocytes in culture can also respond to proinflammatory stimuli (LPS and TNF) by elevation of ObRa and ObRb protein expression within 6 h. The results suggest that astrocytic ObR may play a regulatory role in neuroinflammation.
Table 2.
Rat primers for quantitative PCR
| 5’ primer | 3’ primer | |
|---|---|---|
| ObRa | TGAAGTATCTCATGACCACTACAGATGA | GTTTGCTTCCTTCCTTCAAAATGT |
|
ObRb |
GCATGCAGAATCAGTGATATTTGG |
CAAGCTGTATCGACACTGATTTCTTC |
| GAPDH | TGTGTCCGTCGTGGATCTGA | CCTGCTTCACCACCTTCTTGA |
Acknowledgement
Supported by NIH (DK54880 to AJK, NS62291 and NS45751 to WP). We appreciate the help of Dr. Richard Rogers, Dr. Gerlinda Hermann, and Ms. Montina J. Van Meter in PBRC.
Footnotes
Publisher's Disclaimer: This is a PDF file of an unedited manuscript that has been accepted for publication. As a service to our customers we are providing this early version of the manuscript. The manuscript will undergo copyediting, typesetting, and review of the resulting proof before it is published in its final citable form. Please note that during the production process errors may be discovered which could affect the content, and all legal disclaimers that apply to the journal pertain.
References
- 1.Banks WA, Altmann J, Sapolsky RM, Phllips-Conroy JE, Morley JE. Serum leptin levels as a marker for a Syndrome X-like condition in wild baboons. J Clin Endocrinol Metab. 2003;88:1234–1240. doi: 10.1210/jc.2002-021695. [DOI] [PubMed] [Google Scholar]
- 2.Banks WA, Farrell CL. Impaired transport of leptin across the blood-brain barrier in obesity is acquired and reversible. Am J Physiol. 2003;285:E10–E15. doi: 10.1152/ajpendo.00468.2002. [DOI] [PubMed] [Google Scholar]
- 3.Bjørbæk C, Elmquist JK, Michl P, Ahima RS, van Bueren A, McCall AL, Flier JS. Expression of leptin receptor isoforms in rat brain microvessels. Endocrinology. 1998;139:3485–3491. doi: 10.1210/endo.139.8.6154. [DOI] [PubMed] [Google Scholar]
- 4.Cheunsuang O, Morris R. Astrocytes in the arcuate nucleus and median eminence that take up a fluorescent dye from the circulation express leptin receptors and neuropeptide Y Y1 receptors. Glia. 2005;52:228–233. doi: 10.1002/glia.20239. [DOI] [PubMed] [Google Scholar]
- 5.Dall'Aglio C, Ceccarelli P, Pascucci L, Brecchia G, Boiti C. Receptors for leptin and estrogen in the subcommissural organ of rabbits are differentially modulated by fasting. Brain Res. 2006;1124:62–69. doi: 10.1016/j.brainres.2006.09.091. [DOI] [PubMed] [Google Scholar]
- 6.Dallaporta M, Pecchi E, Pio J, Jean A, Horner KC, Troadec JD. Expression of leptin receptors by glial cells of the nucleus tractus solitarius: possible involvement in energy homeostasis. J Neuroendocrinol. 2009;21:57–67. doi: 10.1111/j.1365-2826.2008.01799.x. [DOI] [PubMed] [Google Scholar]
- 7.Elmquist JK, Bjorbaek C, Ahima RS, Flier JS, Saper CB. Distributions of leptin receptor mRNA isoforms in the rat brain. J Comp Neurol. 1998;395:535–547. [PubMed] [Google Scholar]
- 8.Hsuchou H, He Y, Kastin AJ, Tu H, Markadakis EN, Rogers RC, Fossier PB, Pan W. Obesity induces functional astrocytic leptin receptors in hypothalamus. Brain. 2009;132:889–902. doi: 10.1093/brain/awp029. [DOI] [PMC free article] [PubMed] [Google Scholar]
- 9.Kastin AJ, Banks WA, Olson RD, Zadina JE. Novel concepts from novel peptides. Ann NY Acad Sci. 1994;739:1–10. doi: 10.1111/j.1749-6632.1994.tb19802.x. [DOI] [PubMed] [Google Scholar]
- 10.Kastin AJ, Pan W. Dynamic regulation of leptin entry into brain by the blood-brain barrier. Regul Peptides. 2000;92:37–43. doi: 10.1016/s0167-0115(00)00147-6. [DOI] [PubMed] [Google Scholar]
- 11.Kastin AJ, Zadina JE, Banks WA, Graf MV. Misleading concepts in the field of brain peptides. Peptides. 1984;5(Suppl 1):249–253. doi: 10.1016/0196-9781(84)90283-3. [DOI] [PubMed] [Google Scholar]
- 12.Kurrimbux D, Gaffen Z, Farrell CL, Martin D, Thomas SA. The involvement of the blood-brain and the blood-cerebrospinal fluid barriers in the distribution of leptin into and out of the rat brain. Neuroscience. 2004;123:527–536. doi: 10.1016/j.neuroscience.2003.08.061. [DOI] [PubMed] [Google Scholar]
- 13.Morash B, Johnstone J, Leopold C, Li A, Murphy P, Ur E, Wilkinson M. The regulation of leptin gene expression in the C6 glioblastoma cell line. Mol Cell Endocrinol. 2000;165:97–105. doi: 10.1016/s0303-7207(00)00259-8. [DOI] [PubMed] [Google Scholar]
- 14.Pan W, Hsuchou H, He Y, Sakharkar A, Cain C, Yu C, Kastin AJ. Astrocyte Leptin Receptor (ObR) and Leptin Transport in Adult-Onset Obese Mice. Endocrinology. 2008;149:2798–2806. doi: 10.1210/en.2007-1673. [DOI] [PMC free article] [PubMed] [Google Scholar]
- 15.Pan W, Hsuchou H, Tu H, Kastin AJ. Developmental changes of leptin receptors in cerebral microvessels: unexpected relation to leptin transport. Endocrinology. 2008;149:877–885. doi: 10.1210/en.2007-0893. [DOI] [PMC free article] [PubMed] [Google Scholar]
- 16.Pan W, Kastin AJ. Adipokines and the blood-brain barrier. Peptides. 2007;28:1317–1330. doi: 10.1016/j.peptides.2007.04.023. [DOI] [PMC free article] [PubMed] [Google Scholar]
- 17.Pan W, Kastin AJ. Evolution of neuropeptide concepts illustrated by MIF-1 and MSH. In: Shioda S, Homma I, Kato N, editors. Transmitters and modulators in health and disease. Springer; Tokyo: 2009. pp. 3–17. [Google Scholar]
- 18.Pan W, Yu C, Hsuhou H, Khan RS, Kastin AJ. Cerebral microvascular IL15 is a novel mediator of TNF action. J Neurochem. 2009 doi: 10.1111/j.1471-4159.2009.06371.x. Forthcoming. [DOI] [PMC free article] [PubMed] [Google Scholar]
- 19.Yu C, Kastin AJ, Ding Y, Pan W. Gamma glutamyl transpeptidase is a dynamic indicator of endothelial response to stroke. Exp Neurol. 2007;203:116–122. doi: 10.1016/j.expneurol.2006.07.023. [DOI] [PubMed] [Google Scholar]
- 20.Yu C, Kastin AJ, Tu H, Pan W. Opposing effects of proteasomes and lysosomes on LIFR: modulation by TNF. J Mol Neurosci. 2007;32:80–89. doi: 10.1007/s12031-007-0017-4. [DOI] [PubMed] [Google Scholar]
- 21.Zlokovic BV, Jovanovic S, Miao W, Samara S, Verma S, Farrell CL. Differential regulation of leptin transport by the choroid plexus and blood-brain barrier and high affinity transport systems for entry into hypothalamus and across the blood-cerebrospinal fluid barrier. Endocrinol. 2000;141:1434–1441. doi: 10.1210/endo.141.4.7435. [DOI] [PubMed] [Google Scholar]


