

Abstract
We present a combined experimental and modeling study of organic ligand molecules binding to a slightly polar engineered cavity site in T4 lysozyme (L99A/M102Q). For modeling, we computed alchemical absolute binding free energies. These were blind tests performed prospectively on 13 diverse, previously untested candidate ligand molecules. We predicted that eight compounds would bind to the cavity and five would not; 11 of 13 predictions were correct at this level. The RMS error to the measurable absolute binding energies was 1.8 kcal/mol. In addition, we computed relative binding free energies for six phenol derivatives starting from two known ligands: phenol and catechol. The average RMS error in the relative free energy prediction was 2.5 (phenol) and 1.1 (catechol) kcal/mol. To understand these results at atomic resolution, we obtained x-ray co-complex structures for nine of the diverse ligands and for all six phenol analogs. The average RMSD of the predicted pose to the experiment was 2.0Å (diverse set), 1.8Å (phenol derived predictions) and 1.2Å (catechol derived predictions). We found that to predict accurate affinities and rank-orderings required near-native starting orientations of the ligand in the binding site. Unanticipated binding modes, multiple ligand binding, and protein conformational change all proved challenging for the free energy methods. We believe these results can help guide future improvements in physics-based absolute binding free energy methods.
Keywords: Alchemical free energy, free energy calculation, T4 lysozyme, model cavity site, hydrophobic and polar
Introduction
A longstanding goal in structure based drug discovery is to predict ligand binding free energies accurately. The most sophisticated simulation-based methods, such as free energy perturbation (FEP) and thermodynamic integration (TI), calculate the binding free energy of small molecules to proteins using a thermodynamic cycle. These approaches step through a series of non-physical (alchemical) overlapping states from free ligand + protein to the protein-ligand bound complex. Nearly all such approaches, with few exceptions 1–3, require a bound structure as input. The calculations are time consuming, due in part to the explicit treatment of solvent, as well as the need for many intermediate states. Also, each step of the transformation requires equilibration of the system. Finally, the many degrees of freedom in these systems make it difficult to achieve convergence of the free energy estimate.
Despite these concerns, investigators have been able to correlate calculated absolute and relative binding free energies of small molecules with experimental results, some to within 1–2 kcal/mol in retrospective studies 1,3–19. There are far fewer examples of prospective predictions, a more rigorous test for any computational method. Most successful prospective tests to date have involved relative free energies, where a ligand’s affinity is predicted based on the measured affinity of a similar ligand. An example of such prospective prediction is the work of Jorgensen & colleagues, who used relative free energy calculations for lead optimization of potent non-nucleoside HIV-1 reverse transcriptase inhibitors 20. In this case, knowledge of the affinities and structural information for a set of ligands was leveraged to systematically improve potency relative to the starting compounds. A more ambitious goal is to predict absolute binding free energies: these calculations would not require knowledge of other ligands already tested.
In a previous study, we used a simple model cavity to explore the strengths and weaknesses of alchemical free energy methods. Owing to their simplicity, tractability, and the many untested plausible ligands, it is possible to test prospective predictions and analyze both successes and failures in detail for such sites. We therefore predicted the absolute binding free energy of five unknown compounds to the hydrophobic model binding site T4 lysozyme L99A 2. The simplicity of the site made it possible to isolate errors due to convergence and force field issues that might otherwise have been masked by pKa shifts, complex protein motions, and other factors. In the hydrophobic cavity, free energy methods correctly separated ligands from non-binders, rank-ordered and accurately calculated the new ligand affinities, and predicted the correct binding geometries.
Still, the simplicity of this site and the few compounds tested left several questions unanswered, specifically how alchemical free energy methods would perform with the introduction of polarity into the binding site and with the corresponding increase in the diversity of ligands that would then bind. To explore these questions we turned to a second model binding site in T4 lysozyme L99A/M102Q, essentially the same hydrophobic cavity but with polarity and the potential for hydrogen bonding introduced by the Met102→ Gln substitution (Fig. 1.A). As in the apolar L99A cavity, this site binds small aromatic molecules (benzene, toluene etc), but it also binds more polar molecules such as phenol. Not all polar molecules bind, for example whereas catechol is a ligand, the isosteric 2-aminophenol does not bind detectably. The balance between the solvation free energy of the ligand and the requirement of correctly orienting molecules for hydrogen bonding to Gln102 introduces complexities absent from the apolar cavity, without abandoning the essential simplicity of the cavity. And, like the original site, the L99A/M102Q model system lends itself to prospective studies, with both experimental assays and protein crystallization conditions well established 21–23. Also – and this is a key point – because the cavity is so small (~150Å3) there are many hundreds of likely ligands to be found within commercially available libraries that are easy to acquire and test.
Fig. 1.

A. T4 Lysozyme L99A/M102Q binding site shown in complex with phenol and one ordered water molecule 23. B. Unwinding of Helix-F upon binding of certain ligands (cyan) yields an enlarged binding site relative to apo (orange).
Results
Retrospective analysis of ligands and decoys
To begin this study, seven known ligands and two related non-binders were selected for retrospective free energy calculations. Results from the previous study in the hydrophobic cavity, L99A, suggested that accurate prediction of ΔGb required forced umbrella sampling of Val111 sidechain rotamers (Fig. 1 Supplementary Material)2,24. This movement had been observed to occur with ligand binding, sometimes coupled with a motion of helix F, residues 108–114 (Fig 1.B), enlarging the cavity to accommodate bigger ligands. For the polar cavity, L99A/M102Q, alternate rotamers of Leu118 and Val103 were also observed in the complex crystal structures with catechol and 3-chlorophenol (PDB IDs 1XEP, 1LI3); we therefore sampled all these rotamers explicitly in this study using umbrella sampling (Fig 2 Supplementary Material) 24. Also, unlike common approaches that use bound structures as inputs, we attempt to predict the actual binding mode by sampling many possibilities. Because different possible orientations and conformations can be separated by large kinetic barriers, we sample each “pose”, corresponding to a kinetically stable orientation, separately.
The retrospective absolute free energy calculations for the seven ligands and two decoys had an RMS error of 1.2 kcal/mol relative to experiment (Table 1 Supplementary Material) 23. Six of the seven ligands were correctly identified as measurable binders (Kd values < 10mM) and one of the two non-binders was also correctly identified as such. There were two failures in this set: 2-aminophenol and 4-vinylpyridine. 2-aminophenol is a non-binder that was calculated to have a ΔGb of −3.93 kcal/mol, indicating a weak but measurable affinity (Kd ≈ 1mM), while 4-vinylpyridine is also a non-binder with a calculated ΔGb of −3.39 kcal/mol (very weakly binding, Kd ≈ 3mM). The prediction of the binding geometries for this retrospective set was satisfactory. Most ligand orientations were predicted to within 2Å of the crystallographic binding mode. Despite the small size of the test set, these results suggested that prospective tests for this site would be feasible.
Prospective predictions: Absolute binding free energy
To choose candidate, previously untested, ligands for L99A/M102Q we docked a large library of organic small molecules and selected compounds, keeping in mind that we wanted a range of affinities, from non-binders to those with good ligand efficiencies. Thirteen compounds were chosen, encompassing both compounds we believed might be too polar or too large for the cavity to those that we (SEB & BKS) expected to bind. The experiment was set up in a blind fashion; the calculation of the absolute binding free energies was performed independently (DLM, KAD) without knowledge of the experimental results, whereas the measurement of Kd values (by ITC) and the determination of x-ray structures (both in the Shoichet lab) were done before the predictions were made known.
Of the 13 compounds, five were not detected to bind and eight were ligands (Table 1). Of the eight new ligands, three had weak to moderate affinity: nitrosobenzene, 4-chloro-1H-pyrazole, and 2-ethoxy-3,4-dihydropyran; binding was only detected at concentrations higher than 1mM by thermal denaturation upshift (ΔTm). Due to this and to solubility limitations, the actual binding affinity could not be measured for these ligands and was instead estimated to be between 1–10mM (−3.88 to −2.59 kcal/mol). Of the remaining five new ligands, the binding free energies, determined by ITC, ranged from −4.48 kcal/mol (benzylacetate) to −5.52 kcal/mol (n-phenylglycinonitrile), placing this last ligand among the best known for this cavity (Fig 2).
Table 1.
Prospective test: Absolute binding free energy predictions
| Structure | ΔGb,exp (Kcal/mol) a | ΔG b,calc (Kcal/mol) b | RMSD (Å) c | PDB ID | |
|---|---|---|---|---|---|
| n-phenylglycinonitrile |  |
−5.52 ± 0.18 | −5.63 ± 0.38 | 0.87 | 2RBO |
| 2-nitrothiophene | 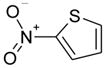 |
−4.85 ± 0.25 | −5.73 ± 0.13 | 1.09(A); 2.86(B) | 2RBN |
| thieno[3,2-b]thiophene | 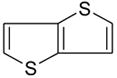 |
−4.67 ± 0.17 | −6.8 ± 0.23 | 0.73(A) 0.44(B) | 3HUQ |
| 4,5,6,7-tetrahydroindole | 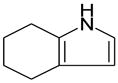 |
−4.61 ± 0.09 | −5.4 ± 0.45 | 0.66 & 1.78** | 3HUA |
| benzyl acetate | 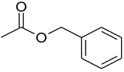 |
−4.48 ± 0.16 | −1.31 ± 0.44 | >10 | 3HUK |
| nitrosobenzene | 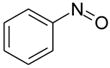 |
weak | −5.55 ± 0.23 | 3.24(A), 3.22(B) | 3HU9 |
| 2-ethoxy-3,4-dihydro-2h-pyran | 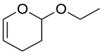 |
weak | −3.8 ± 0.18 | 4.35 | 3HTG |
| 4-chloro-1h-pyrazole |  |
weak | −7.86 ± 0.12 | 2.07 | 3HTF |
| (E)-thiophene-2-carboxaldoxime | NB | −2.30 ± 0.09 | --- | --- | |
| 1-phenylsemicarbazide | 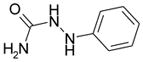 |
NB | 0.45 ± 0.24 | --- | --- |
| o-benzylhydroxylamine | 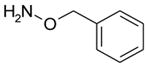 |
NB | −2.58 ± 0.13 | --- | --- |
| 1-2-hydroxyethylpyrrole |  |
NB | −5.72 ± 0.12 | --- | --- |
| phenylhydrazine |  |
NB | −2.51 ± 0.44 | --- | --- |
Compound names of mispredictions are in bold italics.
Free energy of binding determined by ITC at 10°C. For ligands designated weak binding was established by Tm upshift but ΔGb could not be determined; NB = nonbinder, ΔTm ≈ 0°C at concentrations between 1–10mM.
Calculated free energy of binding.
RMSD of predicted ligand geometry to experimentally observed crystal pose. If multiple ligand orientations were present in the crystal (designated A and B) only the best RMSD to the prediction is reported.
indicates RMSD for one crystal pose calculated to two predictions.
Fig. 2.

Representative isothermal titration calorimetry measurements and fit: n-phenylglycinonitrile titration (stock concentration 1.4mM) into L99A/M102Q (initial concentration 42.5μM). An initial injection of 2μL was followed by 29 ×10μL injections of ligand to a final ligand concentration in the reaction cell of 237.9μM.
Complex crystal structures of the ligands bound to L99A/M102Q were determined for all eight new ligands, with resolutions between 1.26Å and 1.85Å (Fig. 3.A–R, Table 2 Supplementary Material). Three structures had multiple binding modes: benzylacetate, thieno[3,2-b]thiophene and 2-nitrothiophene. Two others had adopted geometries in the site dissimilar to all previously known ligands. Thiophene-2-carboxaldoxime, purchased as the 98% pure E isomer, was not observed to bind in the CD assay at 5mM, but electron density for the Z isomer was observed at a crystal soak concentration of 50mM (PDB entry 3HTD). Apparently the Z isomer was present as an impurity, making (Z)-thiophene-2-carboxaldoxime the ninth new ligand discovered in this study. The other compound, 4-chloro-1H-pyrazole, had two molecules present in the cavity, both at 100% occupancy. This is unprecedented for this site. To accommodate this, helix F unwinds from residue 108 to 114. This enlarges the cavity more than observed with any other ligand and opens it to bulk solvent. The new water channel that results interacts with both the helix F backbone and with one molecule of 4-chloro-1H-pyrazole.
Fig. 3. Comparison of predicted to experimental binding modes for the absolute binding free energy predictions.

A. & B. Two conformations of benzylacetate: A. X-ray result, 25:25 occupancy. 2Fo−Fc electron density map displayed at 1.0σ. B. Overlay of x-ray result (gray) with predicted geometry (green). C. & D. Two conformations of thiophene-2-carboxaldoxime: A. X-ray result, 50:50 occupancy. 2Fo−Fc electron density map displayed at 1.5σ. B. Overlay of x-ray result (gray) with predicted geometry (green).E. & F. Two conformations of thieno[3,2-b]thiophene: A. X-ray result, 50:50 occupancy. 2Fo−Fc electron density map displayed at 1.5σ. B. Overlay of x-ray result (gray) with predicted geometries (green & cyan).G. & H. Two conformations of 2-nitrothiophene: A. X-ray result, 50:50 occupancy. 2Fo−Fc electron density map displayed at 1.5σ. B. Overlay of x-ray result (gray) with predicted geometries (green & cyan). I. & J. Two molecules of 4-chloro-1H-pyrazole: A. X-ray result, two molecules (A & B) bound at 100% occupancy with two ordered water molecules. 2Fo−Fc electron density map displayed at 1.5σ. B. Overlay of x-ray result (gray) with predicted geometry (green). K. & L. N-phenylglycinonitrile: A. X-ray result, 100% occupancy. 2Fo−Fc electron density map displayed at 1.5σ. B. Overlay of x-ray result (gray) with predicted geometry (green). M. & N. 4,5,6,7-tetrahydroindole: A. X-ray result, 50% occupancy. 2Fo−Fc electron density map displayed at 1.0σ. B. Overlay of x-ray result (gray) with predicted geometries (green & cyan). O. & P. Two conformations of nitrosobenzene: A. X-ray result, 25:25 occupancy. 2Fo−Fc electron density map displayed at 1.0σ. B. Overlay of x-ray result (gray) with predicted geometry (green). Q. & R. 2-ethoxy-3,4-dihydro-2h-pyran: A. X-ray result, 25% occupancy. 2Fo−Fc electron density map displayed at 0.5σ. B. Overlay of x-ray result (gray) with predicted geometry (green).
Movement of helix F was observed in all of the complex structures with only one exception, n-phenylglycinonitrile (Fig. 3.K–L). This movement displaces the Val111 sidechain, allowing larger ligands to fit in the cavity. Conversely, few alternate sidechain rotamers were observed on ligand binding. The only example for Val111 was the 2-nitrothiophene bound structure, in which an alternate rotamer conformation was observed in addition to the apo rotamer. Val103 had two alternate conformations in the benzylacetate and 2-ethoxy-3,4-dihydro-2h-pyran structures. Leu118 had alternate rotamer conformations in two structures: 4,5,6,7-tetrahydroindole and (Z)-thiophene-2-carboxaldoxime. All other rotamers observed corresponded to the apo conformation (Table 3 Supplementary Material).
Comparing Prediction to Experiment
The criteria we use to assess the accuracy of the predictions are as follows: 1) whether the free energy methods correctly distinguish ligands from non-binders, 2) whether the predictions are accurate (RMS error to experimental ΔGb) and whether the compounds can be rank-ordered by affinity, 3) RMSD of the predicted pose(s) to the experimentally determined binding mode. In this system, the free energy approach was unable to rank-order the compounds by affinity. For seven of the 13 compounds, the affinity is overestimated, and even when the ligand was correctly predicted as a binder the affinity was overestimated six out of nine times (Table 1). Three compounds were completely mispredicted (either as a binder or non-binder when the reverse was true): 1,2-hydroxyethylpyrrole, benzylacetate and n-phenylglycinonitrile. In the last of these, a trivial error led to incorrect partial charges. With the corrected result for n-phenylglycinonitrile, the overall RMS error in the predicted absolute binding free energies was 1.8 kcal/mol for the five compounds with measurable affinities (by ITC). If we estimate the affinity of the 3 weak ligands based on the concentration where significant Tm upshift was observed (nitrosobenzene ≈ 1mM, 4-chloro-1h-pyrazole ≈ 5mM, 2-ethoxy-3,4-dihydro-2h-pyran ≈ 10mM), the overall RMS error is 2.3 kcal/mol. Of the two remaining mispredictions, 1,2-hydroxyethylpyrrole is a non-binder, but it is predicted to be a low micromolar binder, with ΔGb,calc = −5.72 kcal/mol. Benzylacetate is a ligand for this site, yet the predicted ΔGb is unfavorable.
Comparing the predicted ligand poses to the experimentally determined binding modes, the overall average RMSD to the crystallographic results was 2.0Å. In six of the nine structures the RMSD was less than 2Å, thieno[3,2-b]thiophene, 4,5,6,7-tetrahydropyran, 2-nitrothiophene, thiophene-2-carboxaldoxime, 4-chloro-1H-pyrazole, and n-phenylglycinonitrile. The predictions that corresponded most closely to the experimental results were thieno[3,2-b]thiophene, 2-nitrothiophene and 4,5,6,7-tetrahydropyran. For these three ligands, not only did the free energy methods accurately predict the affinity, the binding pose prediction was also accurate (Table 1). Two equally contributing orientations were predicted for all 3 compounds, although for 4,5,6,7-tetrahydropyran only one binding mode was observed crystallographically (Fig. 3.M–L). All three ligands induced a slight conformational change in helix F, as observed in the ligand-protein complex structure, but this was not observed in the predicted structure. Instead, alternate rotamers of Val111 and Leu118 were predicted in order to avoid a steric clash with the sidechain atoms. These rotamer predictions did not agree with the experimental result, with the exception of Val111 for 2-nitrothiophene (Table 3 Supplementary Material). Despite this, we count these three cases as successes for pose prediction.
Although thiophene-2-carboxaldoxime was purchased as the E isomer, the Z isomer is the actual ligand observed to bind in the x-ray complex structure. The prediction agreed with the experimental result for both isomers for binding and predicted orientation; the E isomer was predicted to be a non-binder, ΔGb,calc = −2.30 kcal/mol and the Z isomer a binder, ΔGb,calc = −7.13 kcal/mol. Although the RMSD of the prediction was satisfactory to both observed binding modes, 1.9Å for each, the predicted structure was the mirror image (Fig. 3.C–D); however, the hydrogen bond to Gln102 is maintained in spite of this. Additionally, an alternate rotamer was predicted for Leu118 for (Z)-thiophene-2-carboxaldoxime, which corresponded with the experimental result (Table 3 Supplementary Material).
4-chloro-1H-pyrazole was also a partial success, due to the presence of two ligands bound simultaneously at 100% occupancy in the binding site; predicting both molecules is an impossible case for the free energy methods. Admittedly, the calculated ΔGb was greatly overestimated for even one molecule, yet it was still correctly predicted to bind. Also, when we compare the prediction to the molecule bound in the canonical L99A/M102Q binding site (pose A) the RMSD is 2.1Å, which seems high, but the key interactions are captured (Table 1, Fig. 3.I–J). However, the helix F conformation change is not predicted, although it is the largest movement seen for this set of compounds. Instead, alternate rotamers of Val111 and Leu118 are predicted, inconsistent with the experimental result (Table 3 Supplementary Material).
There are three cases, 2-ethoxy-3,4-dihydro-2h-pyran, nitrosobenzene, and benzylacetate, in which the RMSD is greater than 3Å. In all three, the ligand clearly cannot fit in the binding site unless helix F moves out of the way, enlarging the cavity. For example, the prediction for nitrosobenzene occupies the same overall location in the cavity as the crystallographically observed ligand, but is flipped over in the binding site relative to the actual binding mode to avoid a steric clash with the Val111 sidechain atoms (Fig. 3.O–P). This allows the ligand to fit in the cavity with what is essentially the apo conformation of the helix F, but the interaction between the nitroso substituent and Gln102 is missed. Benzylacetate and 2-ethoxy-3,4-dihydro-2h-pyran are more extreme cases in which the ligand itself occupies space normally taken by the Val111 sidechain and helix F backbone atoms in the apo conformation (Fig. 3.A–B, Q–R, respectively). Neither predicted binding pose is accurate, because in both helix F remains in its apo conformation, leaving no space for the ligand. Consequently, benzylacetate starts in an unfavorable orientation and over the course of the simulations actually leaves the binding site, which explains why it was predicted to be a non-binder.
Although the predicted orientation(s) of 2-ethoxy-3,4-dihydro-2h-pyran and nitrosobenzene are incorrect, both were correctly predicted to be ligands for the cavity and are therefore not complete failures. Benzylacetate, on the other hand, is a hard failure. Both predicted pose and affinity are incorrect, owing to its departure from the cavity during the simulation. The last ligand, n-phenylglycinonitrile, is also a failure, albeit due to a scripting error. Although the RMSD to the crystal pose was 0.9Å, the key hydrogen bond to Gln102 is missed, and it was predicted to be a non-binder, yet experimentally it has the highest affinity of all the ligands. This was determined to be the result of incorrect partial atomic charges in the ligand parameter file for one portion of the initial calculation. Correction of the parameter file led to the recovery of the ligand, with a predicted affinity ΔGb = −5.63 ± 0.38 kcal/mol.
Analysis of the predictions after the experiments
As noted, some failures can be explained by errors in the calculations. After we learned the results of the affinity and crystallographic experiments, we re-analyzed the initial prospective calculations and uncovered problems with several. These were:
A bug in GROMACS caused long range dispersion corrections to be calculated incorrectly, introducing errors in the range of 0–3 kcal/mol for all calculations.
A bug in Antechamber caused some partial charges to be computed incorrectly, introducing errors of up to 1 kcal/mol for some more polar molecules
A scripting error led to jumbled partial charges for atoms in some parameter files (for example for n-phenylglycinonitrile), introducing errors up to 3 kcal/mol.
To fix these errors, we (1) recomputed the long-range dispersion correction, which is always applied in a post-processsing step. For problems (2)–(3), we performed a set of calculations where we computed the free energy of switching the ligand partial charges to the correct set for each ligand and orientation. In the case of (2), because Antechamber gave incorrect partial charges (see Supplementary Material) we obtained AM1-BCC partial charges directly from Christopher Bayly25.
For the corrected results on the prospective compounds, the RMS error was 1.6 kcal/mol; a full table of corrected results for the prospective compounds is available in the Supplementary Material (Table S4). To preserve the prospective nature of the test, we have not changed the results presented in the tables and figures discussing prospective data (Table 1–2, Fig 3–4) to reflect these corrections. However, both the results for the retrospective set (Table S1 Supplementary Material) and the calculations from the holo structure, discussed below, include these corrections.
Table 2.
Experimentally determined binding free energy for phenol derivatives
| catechol | phenol | |||
|---|---|---|---|---|
| Phenol analogs | ΔGb,exp (Kcal/mol) | ΔGb,calc (Kcal/mol) | ΔGb,calc(Kcal/mol) | PDB IDs |
| 2-propylphenol | −5.33 ± 0.05 | −6.13 | −3.05 | 3HTB |
| phenol | −5.24 | – | – | 1LI2 |
| 5-chloro-2-methylphenol | −5.04 ± 0.07 | −7.54 | −1.32 | 3HT8 |
| 2-ethylphenol | −4.57 ± 0.11 | −5.15 | −1.14 | 3HT7 |
| 2-methylphenol | −4.44 ± 0.11 | −4.31 | −2.55 | 3HT6 |
| catechol | −4.16 ± 0.03 | – | −4.88† | 1XEP |
| 2-ethoxyphenol | −4.02 ± 0.03 | −4.16 | −4.25 | 3HU8 |
| 2-methoxyphenol | > −2.0* | −2.76 | −3.84 | 3HT9 |
Reference ligands are in italics. Free energy of binding determined by ITC at 10°C;
indicates the binding free energy was estimated as ΔGb ≥ −2.0. The binding free energies for the six phenol derivatives are shown; for each compound ΔGb,calc was calculated from the predicted relative binding free energy and the experimentally determined ΔGb of the reference compounds catechol or phenol.
The corrected retrospective result for the phenol to catechol transformation is given (described in Results: Analysis of predictions).
Fig 4. Comparison of predicted to experimental binding modes for the relative binding free energy predictions starting from reference compounds catechol & phenol.

A. & B. Two conformations of 2-methoxyphenol: A. X-ray result, 50:50 occupancy. 2Fo−Fc electron density map displayed at 1.0σ. B. Overlay of x-ray result (gray), prediction from catechol (green & cyan), RMSD 0.52 and 0.85Å, and prediction from phenol (magenta), RMSD 0.65 Å. C. & D. 2-ethoxyphenol: C. X-ray result,100% occupancy. 2Fo−Fc electron density map displayed at 1.5σ. D. Overlay of x-ray result (gray) and prediction from catechol (green & cyan), RMSD 0.58 and 0.76Å, and prediction from phenol (magenta), RMSD 0.86Å. E. & F. Two conformations of 2-methylphenol: E. X-ray result, 50:50 occupancy. 2Fo−Fc electron density map displayed at 1.0σ. F. Overlay of x-ray result (gray) and prediction from catechol (green), RMSD 1.02Å, and prediction from phenol (magenta), RMSD 2.03Å. G. & H. 2-propylphenol: G. X-ray result,100% occupancy. 2Fo−Fc electron density map displayed at 1.5σ. H. Overlay of x-ray result (gray) and prediction from catechol (green & cyan), RMSD 0.40 and 1.08Å, and prediction from phenol (magenta), RMSD 2.23Å. I. & J. 2-ethylphenol: I. X-ray result, 100% occupancy. 2Fo−Fc electron density map displayed at 1.5σ. J. Overlay of x-ray result (gray) and prediction from catechol (green, cyan, yellow), RMSD 0.64Å, 3.10Å, 3.08Å and prediction from phenol (magenta), RMSD 2.25Å. K. & L. 5-chloro-2-methylphenol: K. X-ray result, 100% occupancy. 2Fo−Fc electron density map displayed at 1.5σ. L. Overlay of x-ray result (gray) and prediction from catechol (green), RMSD 0.87Å, and prediction from phenol (magenta), RMSD 0.66Å.
Absolute binding free energy calculations from the holo structure
For ligands that induce some degree of unwinding in helix F we saw two distinct trends, the predicted free energy was far too favorable in most cases and the protein conformational change in helix F was not predicted. We were concerned that the original calculations had not converged and to investigate this we restarted the free energy calculations using the holo structures of the 9 ligands from the prospective study. It is important to mention here that we would expect the energies to be even more favorable if the movement of helix F had been accounted for in the original calculation; therefore, although not relevant to true predictions – a major goal of this study – the holo calculations are useful to understand where the predictions go awry, a point to which we will return later.
The RMS error of the holo result from the experimental results was 3.0 kcal/mol for the five ligands with measurable affinities (compared to 1.6 kcal/mol for apo); with estimated affinities for the weak ligands (see Results: Comparing prediction to experiment) the RMS error was 2.6 and 1.8 kcal/mol for the holo and apo results, respectively. The high RMS error in the holo result was due to one compound whose affinity was grossly overestimated, 2-nitrothiophene. Discounting this outlier, the RMS error calculations decreased to 1.4 kcal/mol. Additionally, compared to the experimental result the affinity from the holo structures was only overestimated in two out of the nine ligands. Indeed, the holo structure calculations overestimated the affinity less frequently than the apo structure calculations. This observation was initially perplexing to us, but may be reconciled by several sources of convergence problems discovered during the calculations. This a point to which we will return (Discussion).
The RMSD of the predicted pose(s) to the crystallographic binding modes was greatly improved over the apo calculation (Table 4 Supplementary Material). Of particular note, the prediction for benzylacetate, which left the binding site when starting from the apo structure, was found with an RMSD < 1Å to the experimental binding mode (orientation A). The only exception was the prediction for 2-ethoxy-3,4-dihydro-2h-pyran, which did not improve over the apo result.
Predicting the relative binding free energy
One might hope that comparing relative binding strengths of related inhibitors, starting from one or more ligands with known affinities and structures, would be a less challenging computational problem. We selected six previously untested derivatives of the ligand phenol to predict affinities for: 2-methylphenol, 2-ethylphenol, 2-propylphenol, 2-methoxyphenol, 2-ethoxyphenol and 5-chloro-2-methylphenol. For all the compounds there is one substituent ortho to the hydroxyl group and, in many cases, the difference between one compound and the next is only one heavy atom. The binding free energy of each ligand was then calculated relative to two previously known reference ligands, phenol and catechol.
The affinity and ΔGb for the six unknowns and for catechol were determined by ITC and ranged from −5.51 kcal/mol to −4.02 kcal/mol (Table 2). Due to limited solubility and low affinity the full binding isotherm for 2-methoxyphenol could not be measured, but was estimated from the incomplete ITC curve to be −2 kcal/mol, making this an extremely weak ligand for this cavity. X-ray crystal structures of each ligand in complex with the protein were also determined, with resolutions between 1.59Å and 2.02Å (Table 2, Fig. 4.A–L, Table 5 Supplementary Material). The structures reveal two important and unanticipated results; all ligands induce movement in helix F, and two of the more polar ligands, 2-methoxyphenol and 2-ethoxyphenol, have intramolecular hydrogen bonds with the ether oxygen (Fig. 4.A, C, respectively). For all other compounds and one orientation of 2-methoxyphenol, the hydroxyl group hydrogen bonds with Gln102, as do the reference compounds phenol and catechol.
Two of the six ligands have multiple binding modes in the crystal structures: 2-methylphenol and 2-methoxyphenol (Fig. 4.E, A). In the complex structure with 2-methoxyphenol, the two binding modes are related by a rotation around the C2 axis of the ortho substituent, pointing the hydroxyl away from helix F and Gln102. In this second mode there appears to be an intramolecular hydrogen bond for the ligand. Only one orientation of 2-ethoxyphenol is observed, but the hydroxyl is oriented away from Gln102 similar to the alternate orientation observed for 2-methoxyphenol. This is the only ligand for which there appears to be no hydrogen bond with Gln102. Indeed this represents one of the few high quality x-ray structures for which an H-bond group is clearly left unfulfilled 26.
The predictions correlated well with the experimental results for the relative calculations starting from catechol, but less well for those beginning from phenol (Table 2, Fig. 5). For the transformations from phenol, the direction of the change in the binding free energy was correctly predicted for five of six compounds, but the magnitude was overestimated (Table 2, Fig. 5.B), with an RMS error in ΔGb,calc = 2.51 kcal/mol. The transformation of phenol to the other reference ligand catechol resulted in a relative ΔGb,calc = 0.36 kcal/mol,. For the catechol transformations, all ΔGb,calc were in the correct direction. Also, the predictions from catechol are correctly rank-ordered by ΔGb,calc, with the exception of 5-chloro-2-methylphenol, and the overall RMS error between experiment and prediction was 1.1 kcal/mol (Table 2, Fig. 5.A). It must be mentioned that the same dispersion correction errors that affected the absolute free energy calculations (discussed previously in Retrospective analysis of predictions) also affected the relative free energy calculations. However, recalculating the relative energies did not change the results significantly except for the catechol to phenol transformation (Table 6 Supplementary Material).
Fig. 5. Relative binding free energy predictions from reference compounds Catechol & Phenol.

The experimental free energy of binding was determined by ITC at 10°C for each compound; the relative binding free energy for each ligand to the experiment is shown in gray. The calculated relative free energy of binding relative to the reference compound catechol is shown in green and to phenol in magenta.
The average RMSD for the predicted poses to the crystallographic result was 1.8Å and 1.2Å beginning from phenol and catechol, respectively (Table 2, Fig 4). Consistent with the quality of the binding energy predictions, the predicted poses for catechol are typically accurate. Four of the six new ligands were predicted to have two or more contributing orientations to the overall relative ΔGb,calc: 2-ethoxyphenol, 2-ethylphenol, 2-propylphenol, and 2-methoxyphenol. However, only 2-methoxyphenol had multiple orientations observed crystallographically (Fig 4). For 2-methylphenol, only one of the experimentally observed poses is predicted. The alternate crystallographic orientation, a rotation around the hydroxyl of the ligand, which correlates with the experimentally observed Val103 alternate rotamer configuration, is missed.
2-methoxy- and 2-ethoxyphenol are interesting cases because they make intramolecular hydrogen bonds instead of contacting Gln102. This is something that we were initially surprised by, and we anticipated that the free energy calculations would miss this. However, for 2-methoxyphenol both orientations of the ligand are correctly predicted, and for the structure where the hydroxyl points away from Gln102 it makes an intramolecular hydrogen bond, as observed experimentally. For 2-ethoxyphenol the intramolecular hydrogen bond is indicated in both predicted orientations, as Gln102 has moved away from the ligand in the simulation.
Overall, the results from the catechol relative free energy calculations are more accurate in both prediction of relative free energy and rank-ordering of the ligands, by comparison to the phenol transformations and also the absolute free energy calculations for the same model system, which did not perform nearly so well. Possible reasons for the success of the relative calculations with respect to the absolute free energy calculations, and what can be learned from this study will be discussed in the following section.
Discussion
There are two novel aspects to our study. First, prospective tests were undertaken with 20 new molecules not previously measured for this site. We calculated absolute binding free energies for 14 of them (including a fortuitous impurity) and relative binding free energies for six. As far as we know, this exceeds the sum total of all prospective tests of these methods in the literature over the last 20 years. Second, these experiments are conducted in a simple cavity site, where we can hope to learn systematically from successes and especially failures of the method by detailed comparisons of prediction to experiment.
To understand what we may learn from this model system, it is useful to summarize how well the calculations corresponded to experiment. We used three criteria, each successively more stringent, to assess the predictions. 1) Did the free energy methods distinguish ligands from non-binders? 2) Were the free energy predictions accurate and can the compounds be rank-ordered by affinity? 3) Are the crystallographic binding modes, and possible alternate ligand orientations, predicted? From the initial prospective calculations, predicting ligand versus non-binder was successful in 10 of 13 cases. Including thiophene-2-carboxaldoxime, for which there were, as we discovered, two relevant isomers to consider, raises these numbers to 11 of 14 correct. Including n-phenylglycinonitrile, for which a trivial error led to the assignment of the wrong partial charges, raises the number to 12 correct predictions out of 14 total at the binder/non-binder level. At the more stringent level of energetic accuracy, the RMS error in ΔGb,calc was 1.8 kcal/mol (1.6 kcal/mol after bugfixes described above). This number does not include the four weakly binding ligands whose affinity could not be measured; if we include estimates of affinity of these weak ligands compared to the calculated energies, the RMS error rises 2.3 kcal/mol (see Results). Although not entirely wrong, these predicted energies are too inaccurate for affinity progression in congeneric series, for instance. Rank-ordering of the entire test set by affinity was certainly unsuccessful. Finally, the lack of energetic accuracy was due in large part to the substantially overestimated affinities, which in turn can be traced to problems with convergence and to an error in the long range van der Waals correction energy (below). The predictions of ligand orientations and alternate conformations were mixed; six of the nine ligands had a predicted pose with an RMSD of ~2Å or better, but three predictions were entirely wrong. Interestingly, eight of the nine ligands induced a protein conformational change in helix F that was not predicted, because of a failure to sample relevant protein motions.
These discrepancies between the theoretical predictions and the experimental results may have three sources, putting aside the chance that the experiments themselves may be wrong (for this study, based as it is on full binding affinity measurements and crystallography, the experimental observables seem reliable). The first sort of error is purely mechanical, relating to improper working of the computational methods or incorrect user choices. These are rarely observed in retrospective studies, as they can be caught and fixed before they are communicated, but in prospective studies, of the sort described here, they can appear; indeed, their occurrence can reflect how easily a method is, in practice, to perform. Second, there can be problems with the sampling of relevant states in the simulation, such as a particular ligand orientation or protein conformation, and convergence to the proper equilibrium distribution among these states, as defined by the force field (we distinguish between “sampling” and “convergence” for this reason). Third, the force field itself is an approximation, and even once the simulation has converged to free energy estimates that are “correct” according to the force field, these may still disagree with experiment. Force field errors can only be detected after results are converged, so before considering force field errors we assess the quality of convergence.
As it happens, technical and scripting problems, such as the bugs in scripts and simulation packages and tools, or even the choice of the wrong stereo-isomer from the initial poses calculated by DOCK 6 27, had a substantial impact; each led to specific failures (n-phenylglycinonitrile, thiophene-2-carboxaldoxime). An error in the calculation of the long range van der Waals forces also resulted in too favorable binding free energies, in some cases by as much as 2–3 kcal/mol. Another avoidable error occurred during the calculation of ligand restraining energies; this is an involved, if technically important point, and so we take a short detour to explain it here.
Distance and orientational restraints are used to maintain the ligand inside the binding site as its interactions with the protein are decoupled in the free energy simulation. The first step in the alchemical transformation is to compute the free energy cost of applying these restraints, which owes to the loss of translational and rotational freedom (Methods & Supplemental Material). The cost of applying these restraints is calculated in steps of increasing restoring forces, the integration of which amounts to the total restraining free energy. For some calculations, the free energy of restraining the ligand to a single orientation (typically 1–2 kcal/mol) was unusually large (4–12 kcal/mol). Upon examining these simulations retrospectively, we found that particular ligands (for example 2-ethoxy-3,4-dihydro-2h-pyran) had erroneously begun their restraining simulations in an unfavorable, kinetically trapped orientation that was different from the target orientation of the restraints. Given the length of the simulations, this can present a serious convergence problem. The ligand may remain in that unfavorable orientation at steps in the restraining process where the restraints are not strong enough to pull the ligand across the kinetic barrier into the target orientation. As long as the ligand remains trapped, the restoring forces are being integrated, at ever increasing levels, into the overall restraining energy. When the barrier is significant, a large restraining energy is thus calculated. Thus by misidentifying an unfavorable trap as a favorable thermodynamic state, these unconverged restraining energies ultimately make binding appear artificially too favorable, since they are added back to the ligands net free energy of binding, to “repay” the system for the cost of artificially restraining the ligand.
Taken together, these errors give some indication of how intricate these calculations remain, with many opportunities for the introduction of essentially trivial human error. Aggravating as this is, these errors can be traced to their origin and results typically improve when the errors are fixed.
In principle, an algorithmic origin of error comes from the calculation of ligand solvation energy, which might typically be laid at the door of the force field since sampling is less of a concern here. However, recent tests on computed hydration free energies of tens to hundreds of small molecules gave RMS errors to experiment that were typically in the 1.0 to 1.8 kcal/mol range, depending on compound polarity 13,28–30. For example, phenol, one of the ligands here, had a computed hydration free energy that differed by only 0.9 kcal/mol to that observed experimentally. This leads us to believe modeling of ligand interactions with bulk solvent is probably not the dominant source of error in this study. 29 Of course, force field errors may also play a role in ligand-protein interaction energies, but as we will argue in the following sections, these errors, to the extent that they occurred, were largely obscured by what we believe to be problems with sampling and convergence.
Protein Conformational Change, Sampling Protein Motions & Convergence of the Calculations
Rerunning the calculations starting with the holo structures was an attempt to determine whether or not the simulations reached convergence and if under-sampling of helix F led to errors in the predicted ΔGb values. Several scenarios may be considered. When apo and holo results agree, it suggests that either there is no convergence problem or there is a cancellation of errors. When they disagree, and the holo result is more favorable, it suggests a sampling problem in the apo state, possibly related to protein conformational changes on binding, as these will typically make binding appear more favorable 2,24. The case where the apo result is more favorable than the holo is counter-intuitive, but owing to poor choices in initial ligand orientations, and consequent convergence problems in the restraining energies (see above), this did in fact occur.
Because we knew that the helix motion had not been sampled over the course of the apo calculation, we assumed that the second case would predominate, that is, the holo result would be more favorable for the eight ligands that induced protein conformational change upon binding. Instead, the opposite was true, with the holo result less favorable than the apo result in nearly every case (Table 4 Supplementary Material). This suggests that under-sampling of helix F in the apo calculation was not the dominant cause of errors observed in the ΔGb values; instead several other sources of convergence problems, including ligand restraints discussed above, were responsible for these errors (Fig. 3 Supplementary Material). Still, since F-helix closure was rarely observed in the course of the holo simulations following ligand decoupling as well, the energetic costs associated with breaking the helix during binding were poorly accounted for in these computed free energies; had it been, the holo results might have even been less favorable.
Despite being on the whole less favorable than the apo predictions, the holo results are less frequently overestimated, and are therefore in better overall agreement with the experimental binding free energies. Also, two of the ligands with the highest RMSD values to the crystallographic binding mode beginning from the apo prediction, nitrosobenzene and benzylacetate, were correctly predicted starting from the holo structure. This improvement reflects the prediction of a near-native orientation in the holo vs. an incorrect one in the apo pose prediction, and is consistent with large kinetic barriers separating different ligand binding modes 3,24. For 2-ethoxy-3,4-dihydro-2h-pyran, however, even starting from the holo structure, the correct ligand orientation was not generated during the setup stage of the calculation (discussed in detail in Methods), and therefore was never sampled in the simulation. The end result is that the prediction for this ligand does not improve relative to the absolute binding free energy calculation from the apo structure.
Sampling the Ligand: Starting with the Wrong Orientation
Previously we had shown that decomposing configuration space by orientation, i.e. generating multiple starting orientations by docking and using simulations beginning from these to identify candidate binding modes, which we then consider separately, would allow adequate sampling (and also convergence) of ligand states separated by large kinetic barriers 3. But this approach requires that docking generate candidate starting orientations which are close enough to the true binding mode that it can be found on nanosecond timescales. However, in L99A/M102Q a protein conformational change alters the size of the small binding site to allow larger ligands to bind and, in some cases, adversely affects the quality of the docking poses. This presents a problem for the alchemical free energy methods, which rely on having starting orientations that are reasonable. This proved to be the key to several of the mispredicted ligands in the apo calculations, most notably benzylacetate, which cannot be docked into the apo binding site with a good initial orientation (Fig. 3.A–B) and is a hard failure, both predicted pose and affinity are incorrect.
Relative Free Energy Calculations
We examined a different problem, looking for prediction of relative affinities within a congeneric series of phenol derivatives. Since we already knew affinity and structures for two such ligands, phenol and catechol, we began relative binding free energy calculations for six others beginning with both of these two, separately. We further simplified the experiment by restricting the starting orientations of the ligands to symmetric binding modes about the ligand hydroxyl group that contacts Gln102. Starting from catechol, these calculations did well (Table 2, Fig 5.A) for all six compounds. For the same six compounds, performance diminished when we began with phenol. How can these results be reconciled?
For the relative free energy predictions, it was necessary to generate one or more starting orientations of each new ligand. In the absolute calculations, we consider many candidate binding modes for each ligand, but this is not a typical for relative free energy calculations. We therefore assumed that the position of the hydroxyl would typically be preserved, but we were unsure of the location for additional substituents. For example, for 2-methylphenol overlaid onto phenol, the methyl group could be on the left or right side of the binding site while preserving the hydroxyl position. Because of kinetic barriers to rotation of ligands within the binding site we considered both (see Material & Methods).
The results of the relative calculations reflect this initial sampling of the ligand orientation. There are only two potential ligand starting orientations for phenol. Also, because of the restriction of the hydroxyl position, phenol starts with only one position for the hydroxyl group (Fig. 6). If the simulations could be run long enough to sample all ligand orientations, the starting orientations would not substantially affect the results. But timescales for interconversion of orientations in this binding site are slow, so the choice of starting orientations affects the results. Indeed, it happens that the position of the hydroxyl position in the derivatives is not conserved, in several cases adopting the ortho hydroxyl position in catechol, (Fig 6, B). Hence, for phenol the prospective predictions of the relative affinity are little better than random (Table 2).
Fig. 6.

Crystallographic orientations of the reference ligands phenol (orange, PDB ID 1LI2) and catechol (cyan, PDB ID 1XEP) overlayed on the apo reference structure (gray, PDB ID 1LGU). The two alternate hydroxyl positions are labeled A & B.
By the same logic, the performance of the catechol transformation is substantially better. Catechol has two hydroxyl groups, which translates to four starting orientations for the ligand, two reflections around each hydroxyl axis. Relative to phenol, the sampling of the hydroxyl position and, consequently, the ortho substituent, is better. The result is that one starts with reasonable sampling of ligand orientations, improving the predictions. Besides accurately predicting the relative free energy change (RMS error 1.1 kcal/mol), the compounds are also correctly rank-ordered, with the exception of 5-chloro-2-methylphenol. Pose fidelity to the crystallographic binding mode is high, and in three cases alternate orientations were correctly predicted. 5-chloro-2-methylphenol is the caveat to this set of transformations; its pose is accurately predicted (RMSD of 0.9Å), but the relative free energy is overestimated, possibly due to force field issues. For this ligand, and indeed all the free energy results, a good starting orientation is necessary but not sufficient for accurate prediction of both affinity and pose.
Conclusion
Predicting the absolute free energy of binding remains challenging, even in a simple model system. There were several technical issues that arose during the study (incorrectly assigned ligand parameters, unconverged restraining energies, errors with the calculation of long range dispersion forces) due to either the complexities of the calculations, bugs, or human error, highlighting the difficulty of this work. Still these sorts of errors are entirely avoidable. Conversely, problems with convergence and sampling of ligand and receptor configurations present more fundamental problems for the field, and in this study prevented even rank ordering of ligands by affinity.
Both the absolute and the relative results highlight the importance of predicting a near-native orientation for the ligand in advance, rather than expecting the ligand to find its optimal orientation through dynamics. The additional polarity in this binding site appears to have introduced additional roughness to the energy landscape, relative to the apolar cavity, exacerbating this problem. The need to start with a near-native orientation may have contributed to the improvement in relative results using catechol as a reference instead of phenol. In absolute calculations, better algorithms are needed to define unique ligand orientations to avoid convergence problems in restraining calculations and overestimation of binding affinities. This may be addressable in the future through kinetics-based partitioning of ligand orientations.
Undersampling of protein conformational changes also caused several failures. The energy barriers to these changes proved too large to be overcome on timescales reasonable for alchemical calculations, and at times the protein reacted to oversized ligands by forcing them out of the binding site rather than expanding to accommodate them. In principle, these conformational changes can be sampled using our confine-and-release approach that has been successful in sampling side-chain rotations. However, this requires that the range of possible backbone motions be identified in advance, and sampling these is much more difficult than side chain torsions. Addressing this will be a goal of future work as well.
What emerges are results that, even for simple ligands in a simple binding site, are less convincing than what might have been hoped for based on our initial study with the apolar cavity 2 and also based on over 20 years of development of these techniques. Still, the method also had substantial successes: 11 of 14 compounds were correctly predicted from the absolute binding free energy calculations, the geometries of all but three of the ligands from this set were predicted better than ~2Å, subtle contributions to the binding free energy were correctly predicted – multiple binding modes and internal hydrogen bonding, and when the right configurations are captured, as was the case for relative affinities based on catechol, true rank ordering can be achieved. We therefore believe that substantial progress can be made with alchemical free energy methods. To show that these methods are pragmatic, and to illuminate opportunities for their optimization, it remains important to couple theoretical developments with genuine prospective prediction, in sites that allow detailed experiment and analysis on multiple ligands.
Material & Methods
Software
In simulations and setup, we drew on several different software packages; we specify the versions here and refer to them simply by name later. We used version 3.3.1 of GROMACS 31,32. We also used version 1.2.7 of the Antechamber package 33. We used version 6.0 of the DOCK software package 34 for docking. We also used OpenEye’s OEChem toolkit (Python implementation), version 1.3.33.
Protein/system preparation and simulation parameters/protocols
System preparation and parameters always followed the same procedure, although several starting structures were used. Unless otherwise specified, the starting protein structure was the apo conformation of L99A/M102Q (PDB: 1LGU) 23. Setup began with the protein PDB structure and the protein setup procedure was the same regardless of the starting structure. Our setup procedure for the protein and the simulation parameters/protocols were essentially identical to our previous study (see Supplementary Methods)2.
Docking
We used DOCK 6.2 to generate candidate bound orientations for each potential ligand for absolute free energy calculations 27. Docking was done on protein structures that had been pre-equilibrated in water for 1 ns as discussed above, after then stripping hydrogens and waters. Docking poses were clustered by RMSD by DOCK. We manually examined the resulting clusters and retained non-redundant orientations in the binding site for further simulations. Symmetric orientations were not retained, nor were clusters that placed the ligand outside of the cavity. For simulations beginning with the holo protein structure, we used docking to generate ligand orientations, but manually selected the one that best corresponded to the crystallographic ligand orientation
Absolute free energy calculations
Basic strategy
Absolute binding free energy calculations were done beginning from both the unbound structure (1LGU) and a variety of different holo structures as described previously2; these calculations followed unrestrained simulations to identify reference orientations for restraints (details given in Supplementary Material).
Unrestrained simulations and selecting reference orientations
Prior to performing binding free energy studies, candidate ligand orientations were identified in the binding site. For the absolute binding free energy studies, potential bound orientations resulting from docking were used as input for unrestrained simulations 2,3. This number ranged from two to seven different potential orientations. One unrestrained simulation was run beginning from each of these (see Supplementary Material).
After the unrestrained simulations, the value for each of the six degrees of freedom at every stored snapshot over the course of the simulation was computed (snapshots were stored every 1 ps), and histograms of each degree of freedom were made, as well as plots of the timeseries of each degree of freedom. To select reference orientations for restraint, we manually examined the histograms and timeseries. For orientations that did not interconvert, we defined the reference orientation by restraining each degree of freedom to its peak histogram value; redundant orientations were discarded. When a ligand interconverted between several orientations over the course of the simulation, the most populated orientation was retained. Other orientations were retained only if they rarely interconverted with the most populated orientation (i.e. less than three times over the course of the simulation). In a few cases two (slowly interconverting) orientations were identified from a single unrestrained simulation. This procedure resulted in one or more reference orientations to restrain each ligand to (typically 2–4).
Long Range Dispersion Corrections
Long-range dispersion interactions between ligands and proteins can contribute to the binding affinity, even at distances larger than 0.7 to 0.9 nm 35. For lysozyme ligands this contribution is typically in the 0.4 to 1.0 kcal/mol range, though it can be larger with larger ligands. Though a contribution of 0.4 to 1.0 kcal/mol is not that large, including these corrections is also important to ensure consistency across research groups using different protocols35. Therefore, we used a reweighting strategy as in our previous study 2,35. Initially, we used the WHAM-LR approach 35, but occasionally this gave large uncertainties or otherwise questionable results; in these instances we also applied the EXP-LR approach and checked for consistency, using the value that appeared more reasonable. Following the predictions, we discovered that a bug in GROMACS resulted in incorrect LR corrections for the WHAM-LR approach, and a scripting error resulted in a sign error for the EXP-LR approach. All of the LR corrections were recalculated and EXP-LR was used throughout, except for 3-chlorophenol, where WHAM-LR was used instead.
In some systems, very long range electrostatic interactions can also play an important role 36, but these are unlikely to be important for these largely apolar ligands in this predominantly apolar cavity.
Orientational decomposition
In the absolute binding free energy calculations, we computed contributions of different metastable orientations for ligands separately, and then combined the effective binding free energies for these different orientations into a total binding free energy as described previously (see Supplementary Material)2,3.
Confine-and-Release Approach
The contribution to the binding free energy of slow sidechain conformational changes in the binding site was calculated using the confine-and-release approach, as described previously 2,24. Here we included three rotamers for umbrella sampling and the confine-and-release approach, Val111, Val103 and Leu118 (see Supplementary Material). The sidechains of these residues are reasonably distant from one another, so we assumed that couplings between the sidechains conformations were negligible and performed umbrella sampling simulations for each sidechain independently, in the presence and absence of each ligand. These results were used in simulations beginning from the apo structures.
Data analysis
Data analysis and plots were done with custom Python scripts based on the matplotlib and Numarray libraries. Free energies were computed using the Bennett Acceptance Ratio (BAR) 37,38 approach as done previously 2,3,24. Uncertainties were computed using the block bootstrap method – breaking the simulations up into blocks the length of the autocorrelation time of the potential energy, selecting random blocks and composing new timeseries of the same length as the original, and computing a new estimated free energy. We repeated this process 40 times and took the uncertainty as the standard error over these trials, as in our previous work 2. Long range dispersion corrections were analyzed as described previously 2,35.
Water removal
To address the possibility that waters might occupy the cavity in the absence of ligand, we used absolute binding free energy techniques to compute the free energy of removing waters from the binding site (Supplementary Material). The results indicated that removal of water was always favorable; thus, it was unnecessary to include a free energy correction for desolvation of the binding site.
Relative free energy calculations
We performed two sets of relative free energy calculations calculations, one using phenol and one using catechol, to calculate differences in binding free energies between a reference compound and a series of phenol derivatives. Mutations were also done between catechol and phenol. This provided redundant information to use in assessing error.
The calculations began using the unbound (1LGU) protein structure, with the reference ligand (catechol or phenol) in an orientation roughly corresponding to that in the co-crystal structure (Fig 6). This was a simulation snapshot from an unrestrained simulation of the ligand in the binding site and was manually compared with the crystal structure.
To set up the relative free energy calculations, we used a maximal common substructure search to identify common atoms between the reference and target ligands. Deletion of atoms is the most difficult part of the transition, so to minimize the number of deletions we mutated both the reference and target ligand into a scaffold resembling the maximal common substructure rather than directly into one another. The scaffold had the same atoms as the maximal common substructure; for example, the maximal common substructure for the transformation of phenol to catechol is phenol, with one hydrogen atom removed. In the scaffold, partial charges on shared atoms are taken to be the average of those for the overlaid shared atoms. After this averaging, an equal adjustment is applied to all shared atoms to ensure net neutrality of the ligand. A similar averaging approach is applied for bonded and Lennard-Jones interactions involving shared atoms.
Free energy calculations for the transition of each ligand to the scaffold are carried out in two steps. First, there is a charging calculation, where charges on all deleted atoms are turned to zero, and charges on shared atoms are mutated to match those in the scaffold. This is followed by a van der Waals calculation, where any atoms being deleted are turned into dummy atoms (with Lennard-Jones interactions turned to zero) and adjustments are made to Lennard-Jones parameters for shared atoms. In this step the bonded interactions are modified to match the scaffold. Soft core potentials are used for the van der Waals calculation but not the charging calculation, and the two calculations are done separately for the reasons discussed elsewhere (http://www.alchemistry.org). Each relative binding free energy calculation involves mutating each ligand to the scaffold once in the protein and once in the binding site (Fig. 2 Supplementary Material).
To generate potential bound structures, we began with the structure of the reference ligand bound, and then overlaid the target ligand onto the reference ligand manually in Pymol; consequently, the aromatic ring remains in-plane For simplicity, we chose to preserve the position of the hydroxyl (which hydrogen bonds with the protein). For the transition from phenol this still left two possible starting orientations, and for catechol four possible orientations (two for each hydroxyl group).
Since we began with one bound structure for each reference ligand, and 2–4 for each target ligand, each relative free energy calculation involved mutating the reference ligand to the scaffold just once, and each target ligand to the scaffold once per orientation. In the results section, we report a single relative free energy for each reference-to-target transformation. For this value, we combine the contributions of different orientations as we did previously in absolute free energy calculations 3, but without any discarding of snapshots (see Supplementary Material). The van der Waals and charging components of the relative free energy calculations were done using the same protocol, but unlike the absolute calculations, these used no restraints.
Experimental measurements of ligand affinity
Binding detection by Tm-upshift monitoring folded to unfolded CD spectra
The thermal denaturation experiments, using a Jasco J-715 spectropolarimeter with a Jasco PTC-348WI Peltier-effect in-cell temperature control device and in-cell stirring, were performed as described 2,39. Transition from folded to unfolded protein in the presence of ligand was monitored by circular dichroism at a wavelength of 223 to 233.5nm, depending on the absorbance of the ligand in the same region of interest. Whereas 233.5 is far from the helical maximum, helicity may still be measured reliably here. The Tm and van’t hoff ΔH were analyzed using the program EXAM 40. Compounds were assayed in their neutral form at concentrations ranging from 0.5 to 10mM, solubility permitting. Nitrosobenzene, n-phenylglycinonitrile, 2-nitrothiophene, 4-chloro-1H-pyrazole, 4, 5, 6, 7-tetrahydroindole, 2-ethoxy-3,4-dihydro-2h-pyran, 1–2-hydroxyethylpyrrole, 2-ethoxyphenol, 2-ethylphenol and 5-chloro-2-methylphenol were assayed at pH 3.07 in a 17mM KH2PO4, 25mM KCl, 2.9mM phosphoric acid buffer 39. Benzylacetate, 1-phenylsemicarbazide, o-benzylhydroxylamine hydrochloride, thiophene-2-carboxaldoxime and thieno[3,2-b]thiophene were assayed at pH 6.8 in a 50mM KPi, 200mM KCl, 38% ethylene glycol buffer 39. Phenylhydrazine and benzylacetate were also assayed at pH 5.4 in a 8.6mM sodium acetate, 100mM NaCl, 1.6mM acetic acid buffer 39.
ITC measurements
Isothermal titration calorimetry data was obtained using a Microcal VP-ITC model calorimeter 41. Experiments were performed at 10°C 2. Ligands were assayed at pH 6.8 in a 50mM KPi, 200mM KCl buffer. Protein concentrations ranged from 0.03mM to 0.06mM.
Protein production and Structure determination
T4 lysozyme L99A/M102Q was overexpressed and purified as previously described 42. Crystals belonging to space group P3221 were grown at pH 6.5 in a 2.4M potassium phosphate buffer. Compounds were soaked into crystals for 1 hour to 2 days. Thiophene-2-carboxaldoxime and 4-chloro-1h-pyrazole were soaked at 50mM. 2-methylphenol was soaked at 20mM; 2-propylphenol and 2-ethylphenol at ~1mM. 2-methoxyphenol, 5-chloro-2-methylpheno and 2-ethoxyphenol were soaked at saturating conditions (<50mM). Benzylacetate was soaked at 100mM for 2 days. Due to insolubility in aqueous buffer, the following ligand soaks were performed at a concentration of 50mM in the cryoprotectant mixture of 50:50 mineral oil to Paratone-N (Hampton Research, Aliso Viejo, CA): thieno[3,2-b]thiophene, nitrosobenzene, 4,5,6,7-tetrahydroindole, 2-ethoxy-3,4-dihydro-2h-pyran and 1,2-hydroxyethylpyrrole. X-ray diffraction data was measured at 100K with an ADSC-CCD detector on Beamline 8.3.1 of the Advanced Light Source (ALS) at Lawrence Berkley National Laboratory. The data were processed using the HKL 43 software package with the exception of 3HTF, 3HTD, 3HTG, 3HUQ, 3HTB, 3HU8, 3HT9, which were processed with XDS 44. Complex structure refinement was performed with Refmac5 45. Model building and placement of waters was done using Coot 46. Ligand parameters were generated using PRODRG 47.
Supplementary Material
Acknowledgments
We thank Michael Mysinger for reading the manuscript. This work was supported by NIH grants GM59957 (to BKS) and GM034993 & GM063592 (to KAD), an award from the Sandler Family Trust (to KAD), and by the Louisiana Optical Network Initiative Institute (DLM), supported by the Louisiana Board of Regents Post-Katrina Support Fund Initiative grant LEQSF(2007-12)-ENH-PKSFI-PRS-01. This work was performed in part with the UCSF QB3 Shared Computing Facility.
Footnotes
ACCESSION NUMBERS: Coordinates and structure factors have been deposited in the Protein Data Bank with accession numbers: 3HUQ, 3HUA, 3HUK, 3HU9, 3HTG, 3HTF, 3HTB, 3HT8, 3HT7, 3HT6, 3HU8, 3HT9, 3HTD.
Publisher's Disclaimer: This is a PDF file of an unedited manuscript that has been accepted for publication. As a service to our customers we are providing this early version of the manuscript. The manuscript will undergo copyediting, typesetting, and review of the resulting proof before it is published in its final citable form. Please note that during the production process errors may be discovered which could affect the content, and all legal disclaimers that apply to the journal pertain.
References
- 1.Jayachandran G, Shirts MR, Park S, Pande VS. Parallelized-over-parts computation of absolute binding free energy with docking and molecular dynamics. J Chem Phys. 2006;125:084901. doi: 10.1063/1.2221680. [DOI] [PubMed] [Google Scholar]
- 2.Mobley DL, Graves AP, Chodera JD, McReynolds AC, Shoichet BK, Dill KA. Predicting absolute ligand binding free energies to a simple model site. J Mol Biol. 2007;371:1118–1134. doi: 10.1016/j.jmb.2007.06.002. [DOI] [PMC free article] [PubMed] [Google Scholar]
- 3.Mobley DL, Chodera JD, Dill KA. On the use of orientational restraints and symmetry corrections in alchemical free energy calculations. J Chem Phys. 2006;125:084902. doi: 10.1063/1.2221683. [DOI] [PMC free article] [PubMed] [Google Scholar]
- 4.Warshel A, Sussman F, King G. Free energy of charges in solvated proteins: microscopic calculations using a reversible charging process. Biochemistry. 1986;25:8368–8372. doi: 10.1021/bi00374a006. ISSN 0006-2960, 1986. [DOI] [PubMed] [Google Scholar]
- 5.Deng Y, Roux B. Calculation of standard binding free energies: Aromatic molecules in the T4 lysozyme L99A mutant. J Chem Theory Comput. 2006;5:1255–1273. doi: 10.1021/ct060037v. [DOI] [PubMed] [Google Scholar]
- 6.Wang J, Deng Y, Roux B. Absolute Binding Free Energy Calculations Using Molecular Dynamics Simulations with Restraining Potentials. Biophysical Journal. 2006;91:2798–814. doi: 10.1529/biophysj.106.084301. [DOI] [PMC free article] [PubMed] [Google Scholar]
- 7.Bash PA, Singh UC, Brown FK, Langridge R, Kollman PA. Calculation of the Relative Change in Binding Free Energy of a Protein-Inhibitor Complex. Science. 1986;235:574–576. doi: 10.1126/science.3810157. [DOI] [PubMed] [Google Scholar]
- 8.Wong CF, McCammon AJ. Dynamics and design of enzymes and inhibitors. J Am Chem Soc. 1986;108:3830–3832. [Google Scholar]
- 9.Hermans J, Subramaniam S. The Free Energy of Xenon Binding to Myoglobin from Molecular Dynamics Simulation. Isr J Chem. 1986;27:225–227. [Google Scholar]
- 10.Chang CE, Gilson MK. Free energy, entropy, and induced fit in host-guest recognition: calculations with the second-generation mining minima algorithm. J Am Chem Soc. 2004;126:13156–64. doi: 10.1021/ja047115d. [DOI] [PubMed] [Google Scholar]
- 11.Rekharsky MV, Mori T, Yang C, Ko YH, Selvapalam N, Kim H, Sobransingh D, Kaifer AE, Liu S, Isaacs L, Chen W, Moghaddam S, Gilson MK, Kim K, Inoue Y. A synthetic host-guest system achieves avidin-biotin affinity by overcoming enthalpy-entropy compensation. Proc Natl Acad Sci U S A. 2007;104:20737–42. doi: 10.1073/pnas.0706407105. [DOI] [PMC free article] [PubMed] [Google Scholar]
- 12.Moghaddam S, Inoue Y, Gilson MK. Host-guest complexes with protein-ligand-like affinities: computational analysis and design. J Am Chem Soc. 2009;131:4012–21. doi: 10.1021/ja808175m. [DOI] [PMC free article] [PubMed] [Google Scholar]
- 13.Nicholls A, Mobley DL, Guthrie PJ, Chodera JD, Pande VS. Predicting Small-Molecule Solvation Free Energies: An Informal Blind Test for Computational Chemistry. J Med Chem. 2008 doi: 10.1021/jm070549+. [DOI] [PubMed] [Google Scholar]
- 14.Kamerlin SC, Haranczyk M, Warshel A. Are mixed explicit/implicit solvation models reliable for studying phosphate hydrolysis? A comparative study of continuum, explicit and mixed solvation models. Chem Phys Chem. 2009;10:1125–34. doi: 10.1002/cphc.200800753. [DOI] [PubMed] [Google Scholar]
- 15.Lee FS, Chu ZT, Bolger MB, Warshel A. Calculations of antibody-antigen interactions: microscopic and semi-microscopic evaluation of the free energies of binding of phosphorylcholine analogs to McPC603. Protein Eng. 1992;5:215–28. doi: 10.1093/protein/5.3.215. [DOI] [PubMed] [Google Scholar]
- 16.Rosta E, Haranczyk M, Chu ZT, Warshel A. Accelerating QM/MM free energy calculations: representing the surroundings by an updated mean charge distribution. 2008;112:5680–92. doi: 10.1021/jp711496y. [DOI] [PMC free article] [PubMed] [Google Scholar]
- 17.Hermans J, Wang L. Inclusion of the Loss of Translational and Rotational Freedom in Theoretical Estimates of Free Energies of Binding. Application to a Complex of Benzene and Mutant {T4 Lysozyme} J Am Chem Soc. 1997;119:2707–2714. [Google Scholar]
- 18.Mann G, Hermans J. Modeling Protein-small Molecule Interactions: Structure and Thermodynamics of Noble Gases Binding in a Cavity in Mutant Phage T4 Lysozyme L99A. J Mol Biol. 2000;302:979–989. doi: 10.1006/jmbi.2000.4064. [DOI] [PubMed] [Google Scholar]
- 19.Warshel A, Sharma P, Chu Z, Aqvist J. Electrostatic Contributions to Binding of Transition State Analogues Can Be Very Different from the Corresponding Contributions to Catalysis: Phenolates Binding to the Oxyanion Hole of Ketosteroid Isomerase. Biochemistry. 2007;46:1466–1476. doi: 10.1021/bi061752u. [DOI] [PubMed] [Google Scholar]
- 20.Kim JT, Hamilton AD, Bailey CM, Domoal RA, Wang L, Anderson KS, Jorgensen WL. FEP-guided selection of bicyclic heterocycles in lead optimization for non-nucleoside inhibitors of HIV-1 reverse transcriptase. J Am Chem Soc. 2006;128:15372–15373. doi: 10.1021/ja066472g. [DOI] [PubMed] [Google Scholar]
- 21.Graves AP, Brenk R, Shoichet BK. Decoys for Docking. J Med Chem. 2005;48:3714–372. doi: 10.1021/jm0491187. [DOI] [PMC free article] [PubMed] [Google Scholar]
- 22.Wei BQ, Weaver L, Ferrari AM, Matthews BM, Shoichet BK. Testing a flexible-receptor docking algorithm in a model binding site. J Mol Biol. 2004;337:1161–82. doi: 10.1016/j.jmb.2004.02.015. [DOI] [PubMed] [Google Scholar]
- 23.Wei BQ, Baase WA, Weaver LH, Matthews BW, Shoichet BK. A model binding site for testing scoring functions in molecular docking. J Mol Biol. 2002;322:339–355. doi: 10.1016/s0022-2836(02)00777-5. [DOI] [PubMed] [Google Scholar]
- 24.Mobley DL, Chodera JD, Dill KA. Confine-and-release method: Obtaining correct binding free energies in the presence of protein conformational change. J Chem Theory Comput. 2007;3:1231–1235. doi: 10.1021/ct700032n. [DOI] [PMC free article] [PubMed] [Google Scholar]
- 25.Bayly CI. In: Mobley D, editor. 2009. [Google Scholar]
- 26.Hann MM, Leach AR, Harper G. Molecular Complexity and Its Impact on the Probablility of Finding Leads for Drug Discovery. J Chem Inf Comput Sci. 2001;41:856–864. doi: 10.1021/ci000403i. [DOI] [PubMed] [Google Scholar]
- 27.Lang PT, Brozell SR, Mukherjee S, Pettersen EF, Meng EC, Thomas V, Rizzo RC, Case DA, James TL, Kuntz ID. DOCK 6: Combining techniques to model RNA-small molecule complexes. RNA. 2009:15. doi: 10.1261/rna.1563609. [DOI] [PMC free article] [PubMed] [Google Scholar]
- 28.Mobley DL, Bayly CI, Cooper MD, Dill KA. Predictions of hydration free energies from all-atom molecular dynamics simulations. J Phys Chem B. 2009;113:4533–4537. doi: 10.1021/jp806838b. [DOI] [PMC free article] [PubMed] [Google Scholar]
- 29.Mobley DL, Bayly CI, Cooper MD, Shirts MR, Dill KA. Small molecule hydration free energies in explicit solvent: An extensive test of fixed-charge atomistic simulations. J Chem Theory Comput. 2009 doi: 10.1021/ct800409d. [DOI] [PMC free article] [PubMed] [Google Scholar]
- 30.Mobley DL, Dumont l, Chodera JD, Dill KA. Comparison of charge models for fixed-charge force fields: Small-molecule hydration free energies in explicit solvent. J Phys Chem B. 2007;111:2242–2254. doi: 10.1021/jp0667442. [DOI] [PubMed] [Google Scholar]
- 31.van der Spoel D, Lindahl E, Hess B, Groenhof G, Mark AE, Berendsen HJC. GROMACS: Fast, flexible, and free. J Comp Chem. 2005;26:1701–1718. doi: 10.1002/jcc.20291. [DOI] [PubMed] [Google Scholar]
- 32.Lindahl E, Hess B, van der Spoel D. GROMACS 3.0: A Package for Molecular Simulation and Trajectory Analysis. J Mol Modeling. 2001;7:306–317. [Google Scholar]
- 33.Wang J, Wang W, Kollman PA, Case DA. Automatic atom type and bond type perception in molecular mechanical calculations. J Mol Graphics Model. 2006;25:247–260. doi: 10.1016/j.jmgm.2005.12.005. [DOI] [PubMed] [Google Scholar]
- 34.Moustakas DT, Lang PT, Pegg S, Pettersen E, Kuntz ID, Brooijmans N, Rizzo RC. Development and validation of a modular, extensible docking program: DOCK 5. J Comput Aided Mol Des. 2006;20:601–619. doi: 10.1007/s10822-006-9060-4. [DOI] [PubMed] [Google Scholar]
- 35.Shirts MR, Mobley DL, Chodera JD, Pande VS. Accurate and Efficient Corrections for Missing Dispersion Interactions in Molecular Simulations. J Phys Chem B. 2007;111:13052–13063. doi: 10.1021/jp0735987. [DOI] [PubMed] [Google Scholar]
- 36.Warshel A, Sharma P, Kato M, Parson W. Modeling electrostatic effects in proteins. Biochim Biophys Acta. 2006;1764:1647–76. doi: 10.1016/j.bbapap.2006.08.007. [DOI] [PubMed] [Google Scholar]
- 37.Bennett CH. Efficient Estimation of Free Energy Differences from Monte Carlo Data. J Comp Phys. 1976;22:245–268. [Google Scholar]
- 38.Shirts MR, Bair E, Hooker G, Pande VS. Equilibrium free energies from nonequilibrium measurements using maximum-likelihood methods. Phys Rev Letters. 2003;91:140601. doi: 10.1103/PhysRevLett.91.140601. [DOI] [PubMed] [Google Scholar]
- 39.Morton A, Matthews BW. Specificity of ligand binding in a buried non-polar cavity of T4 lysozyme: linkage of dynamics and structural plasticity. Biochemistry. 1995;34:8576–8588. doi: 10.1021/bi00027a007. [DOI] [PubMed] [Google Scholar]
- 40.Kirchhoff W. NIST. Gaithersburg; Maryland: 1993. EXAM: A Two-State Thermodynamic Analysis Program. [Google Scholar]
- 41.Plotnikov VV, Brandts JF, Lin LN. A new ultrasensitive scanning calorimeter. Anal Biochem. 1997;250:237–244. doi: 10.1006/abio.1997.2236. [DOI] [PubMed] [Google Scholar]
- 42.Poteete AR, Dao-Pin S, Nicholson H, Matthews BW. Second-site revertants of an inactive t4 lysozyme mutant restore activity by restructuring the active site cleft. Biochemistry. 1991;30:1425–1432. doi: 10.1021/bi00219a037. [DOI] [PubMed] [Google Scholar]
- 43.Otwinowski Z, Minor W. Processing of X-ray diffraction data collected in oscillation mode. Methods Enzymol. 1997;276:307–326. doi: 10.1016/S0076-6879(97)76066-X. [DOI] [PubMed] [Google Scholar]
- 44.Kabsch W. Automatic processing of rotation diffraction data from crystals of initially unknown symmetry and cell constants. J Appl Cryst. 1993;26:795–800. [Google Scholar]
- 45.Murshudov GN, Vagin AA, Dobson EJ. Refinement of macromolecular structures by the maximum-likelihood method. Acta Crystallogr, D Biol Crystallogr. 1997;53:240–255. doi: 10.1107/S0907444996012255. [DOI] [PubMed] [Google Scholar]
- 46.Emsley P, Cowtan K. Coot: model-building tools for molecular graphics. Acta Crystallogr, D Biol Crystallogr. 2004;60:2126–2132. doi: 10.1107/S0907444904019158. [DOI] [PubMed] [Google Scholar]
- 47.Schuettelkopf AW, van Aalten DMF. PRODRG - a tool for high-throughput crystallography of protein-ligand complexes. Acta Crystallographica. 2004;D60:1355–1363. doi: 10.1107/S0907444904011679. [DOI] [PubMed] [Google Scholar]
Associated Data
This section collects any data citations, data availability statements, or supplementary materials included in this article.