

Abstract
Background/Objectives
Validation-study data were analyzed to investigate the effect of retention interval (time between the to-be-reported meal and interview) on accuracy of children's school-breakfast reports and school-lunch reports in 24-hour recalls, and to compare accuracy of children's school-breakfast reports for two breakfast locations (classroom; cafeteria).
Subjects/Methods
Each of 374 fourth-grade children was interviewed to obtain a 24-hour recall using one of six conditions from crossing two target periods (prior 24 hours; previous day) with three interview times (morning; afternoon; evening). Each condition had 62 or 64 children (half boys). A recall's target period included one school breakfast and one school lunch, for which the child had been observed. Food-item variables (observed number; reported number; omission rate; intrusion rate) and energy variables (observed; reported; report rate; correspondence rate; inflation ratio) were calculated for each child for school breakfast and school lunch separately.
Results
Accuracy for school-breakfast reports and school-lunch reports was inversely related to retention interval. Specifically, as indicated by smaller omission rates, smaller intrusion rates, larger correspondence rates, and smaller inflation ratios, accuracy for school-breakfast reports was best for prior-24-hour recalls in the morning, and accuracy for school-lunch reports was best for prior-24-hour recalls in the afternoon. For neither school meal was a significant sex effect found for any variable. For school-breakfast reports, there was no significant school-breakfast location effect for any variable.
Conclusions
By shortening the retention interval, accuracy can be improved for school-breakfast reports and school-lunch reports in children's 24-hour recalls.
Keywords: validation study, school meals, retention interval
Introduction
Many domestic and foreign studies have focused on school breakfast and/or school lunch programs (e.g., Crepinsek et al, 2006; Gordon, Cohen et al, 2009; Story et al, 2003; Tapper et al, 2007). Childhood nutrition interventions often target schools because large numbers of children attend school and eat one or two meals there each school day. School-breakfast participation rates in are higher when breakfast is in the classroom rather than in the cafeteria (Bernstein et al, 2004), so the within-school location of breakfast has implications for research studies. Because parents are not present when children eat meals at school, many school-based studies have obtained dietary recalls from children (e.g., Gordon, Cohen et al, 2009; Himes et al, 2003; Luepker et al, 1996; Moore et al, 2008). To collect dietary information from elementary-school children (approximately five to eleven years old), dietary recalls are especially appropriate because they are unlikely to alter intake (Buzzard, 1998), and do not require certain cognitive skills (e.g., averaging) which are necessary to complete food frequency questionnaires (Baranowski et al, 1997; Domel et al, 1994). Although methodological research concerning errors in children's dietary recalls has provided insight for improving children's accuracy (Baxter, 2009), continued efforts are essential to maximize reporting accuracy by school-aged children (Gordon, Crepinsek et al, 2009).
A large dietary-reporting validation study recently investigated the effects of retention interval (elapsed time between to-be-reported meals and the interview) on children's accuracy for reporting school-meal intake during 24-hour recalls (Baxter et al, 2009). For that study, children were observed eating school breakfast and school lunch, and interviewed to obtain a 24-hour recall using one of six conditions from crossing two target periods (prior 24 hours [24 hours immediately preceding the interview]; previous day [midnight to midnight of the day before the interview]) with three interview times (morning; afternoon; evening). Children's accuracy for reporting food items and energy consumed at both school meals combined was significantly better when the retention interval was minimized; specifically, accuracy was better for prior-24-hour recalls than previous-day recalls, with accuracy best for prior-24-hour recalls in the afternoon and evening, and worst for previous-day recalls in the afternoon and evening (Baxter et al, submitted; Baxter et al, 2009).
The primary purpose of analyses in this article was to extend results for the retention-interval validation study (Baxter et al, 2009) to accuracy of children's school-breakfast reports and school-lunch reports in 24-hour recalls. The secondary purpose was to compare accuracy of children's reports for school breakfast eaten in two locations (classroom; cafeteria). Accuracy was not investigated previously for school-breakfast reports, school-lunch reports, or school-breakfast reports by breakfast location.
For school-breakfast reports, accuracy should be best for prior-24-hour recalls in the morning because no meals intervened between the to-be-reported breakfast and the interview, and because the retention interval between eating breakfast and the interview was the shortest of the six conditions. Similarly, for school-lunch reports, accuracy should be best for prior-24-hour recalls in the afternoon because no meals intervened between the to-be-reported lunch and the interview, and because the retention interval between eating lunch and the interview was the shortest of the six conditions.
Materials/Subjects and Method
The appropriate institutional review board approved the project. Written child assent and parental consent were obtained. The sample and data collection methods have been described in detail elsewhere (Baxter et al, 2009). Data collection protocols, quality control, criteria to be considered school meals, classification of items (as matches, omissions, or intrusions), assignment of numeric values to qualitative labels for amounts, and meal-component weighting of food items were based on previously-used procedures (Baxter, Smith et al, 2003; Baxter et al, 2006; Baxter et al, 2004; Baxter et al, 2002; Baxter, Thompson, Litaker et al, 2003; Baxter, Thompson, Smith et al, 2003).
Sample and Design
Data were collected in schools in one district during three school years. In 2004-2005, 17 schools participated. In 2005-2006, 16 of the same schools participated along with an additional school, for a total of 17. In 2006-2007, data collection needs were less; eight schools participated that had each participated in the first two school years. For the three respective school years, six, six, and seven of the schools had breakfast in the classroom; the others had breakfast in the cafeteria. Of 2,391 fourth-grade children invited to participate, 1,780 (74%) agreed. Each of 374 randomly selected children (96% Black; mean±SD age=10.00±0.88 years when interviewed) was observed eating school breakfast and school lunch, and interviewed to obtain a 24-hour recall using one of the six target-period by interview-time conditions described in the Introduction. Assignment to condition was random with the constraint that each condition in the final sample had 62 or 64 children (half boys) (Baxter et al, 2009). Figures 1A and 2A illustrate retention-interval lengths in hours from shortest to longest for each of the six conditions, for school-breakfast reports and school-lunch reports, respectively.
Figure 1A–F.
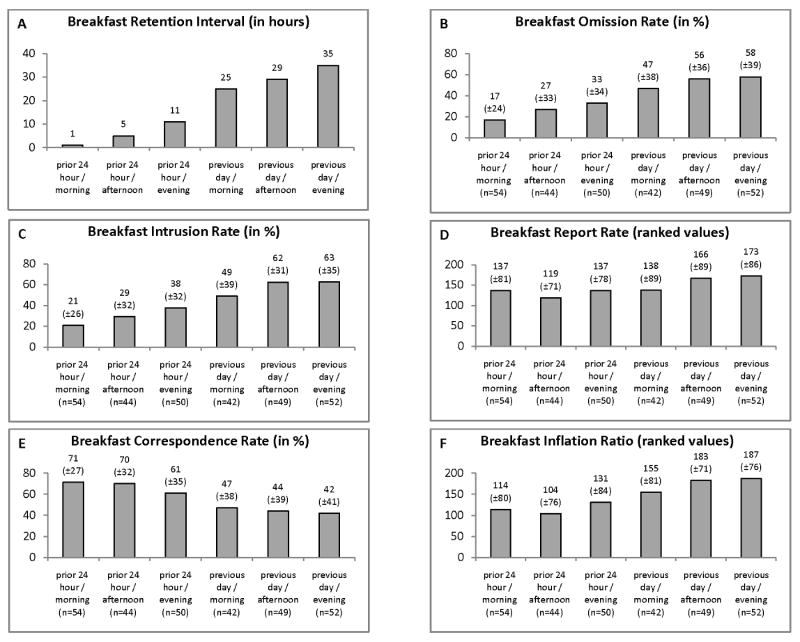
Information by condition about retention interval lengths1, omission rates2, intrusion rates3, report rates4, correspondence rates5, and inflation ratios6 for school-breakfast reports
1 Retention interval is the elapsed time between the to-be-reported meal and the interview. The six conditions were created by crossing two target periods (prior 24 hours [the 24 hours immediately preceding the interview]; previous day [midnight to midnight of the day before the interview]) with three interview times (morning, afternoon, evening). In Figure 1A–F, Figure 2A–F, and Table 2, the six conditions are labeled and defined as (a) prior 24 hour / morning — recall about the prior-24-hour target period obtained in the morning; (b) prior 24 hour / afternoon — recall about the prior-24-hour target period obtained in the afternoon; (c) prior 24 hour / evening — recall about the prior-24-hour target period obtained in the evening; (d) previous day / morning — recall about the previous-day target period obtained in the morning; (e) previous day / afternoon — recall about the previous-day target period obtained in the afternoon; and (f) previous day / evening — recall about the previous-day target period obtained in the evening. In graphs B–F, mean and standard deviation are shown above the bar for each condition, and sample size is shown in parentheses below the label for each bar.
2 Omission rates (defined in Table 1) for school-breakfast reports were better for prior-24-hour recalls in the morning than previous-day recalls in the morning, afternoon, and evening; for prior-24-hour recalls in the afternoon than previous-day recalls in the afternoon and evening; and for prior-24-hour recalls in the evening than previous-day recalls in the evening (six p-values<0.0003).
3 Intrusion rates (defined in Table 1) for school-breakfast reports were better for prior-24-hour recalls in the morning than previous-day recalls in the morning, afternoon, and evening; for prior 24-hour recalls in the afternoon than previous-day recalls in the afternoon and evening; and for prior-24-hour recalls in the evening than previous-day recalls in the evening (six p-values <0.0001).
4 Report rates (defined in Table 1) for school-breakfast reports did not differ significantly across the six conditions. Because rank-transformed values are shown in Figure 1D for report rate and in Figure 1F for inflation ratio, the means shown in Figure 1E for correspondence rate and in Figure 1F for inflation ratio do not sum to the means shown in Figure 1D for report rate.
5 Correspondence rates (defined in Table 1) for school-breakfast reports were better for prior-24-hour recalls in the morning than previous-day recalls in the morning, afternoon, and evening; and for prior-24-hour recalls in the afternoon than previous-day recalls in the afternoon and evening (five p-values <0.0018).
6 Inflation ratios (defined in Table 1) for school-breakfast reports were better for prior-24-hour recalls in the morning than previous-day recalls in the afternoon and evening; for prior 24-hour recalls in the afternoon than previous-day recalls in the afternoon and evening; and for prior-24-hour recalls in the evening than previous-day recalls in the evening (five p-values <0.0005). Because rank-transformed values are shown in Figure 1D for report rate and in Figure 1F for inflation ratio, the means shown in Figure 1E for correspondence rate and in Figure 1F for inflation ratio do not sum to the means shown in Figure 1D for report rate.
Figure 2A–F.
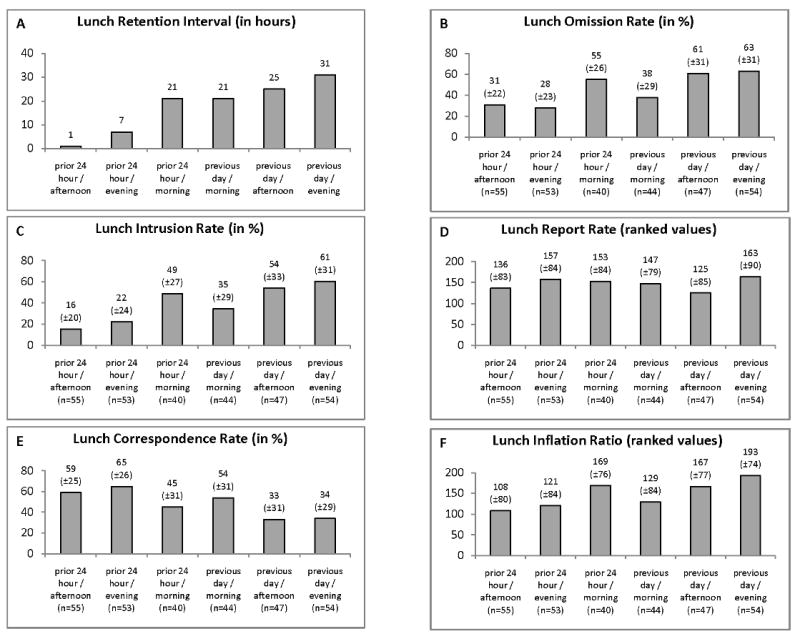
Information by condition about retention interval lengths1, omission rates2, intrusion rates3, report rates4, correspondence rates5, and inflation ratios6 for school-lunch reports
1 Definitions for retention interval and the six conditions (along with labels for the six conditions) are provided in Figure 1, footnote 1. In graphs B–F, mean and standard deviation are shown above the bar for each condition, and sample size is shown in parentheses below the label for each bar.
2 Omission rates (defined in Table 1) for school-lunch reports were better for prior-24-hour recalls in the afternoon than prior-24-hour recalls in the morning and previous-day recalls in the afternoon and evening; for prior-24-hour recalls in the evening than prior-24-hour recalls in the morning and previous-day recalls in the afternoon and evening; and for previous-day recalls in the morning than previous-day recalls in the afternoon (seven p-values <0.0004).
3 Intrusion rates (defined in Table 1) for school-lunch reports were better for prior-24-hour recalls in the afternoon than prior-24-hour recalls in the morning and previous-day recalls in the morning, afternoon and evening; for prior-24-hour recalls in the evening than prior-24-hour recalls in the morning and previous-day recalls in the afternoon and evening; and for previous-day recalls in the morning than previous-day recalls in the afternoon and evening (nine p-values <0.0021).
4 Report rates (defined in Table 1) for school-lunch reports did not differ significantly across the six conditions. Because rank-transformed values are shown in Figure 2D for report rate and in Figure 2F for inflation ratio, the means shown in Figure 2E for correspondence rate and in Figure 2F for inflation ratio do not sum to the means shown in Figure 2D for report rate.
5 Correspondence rates (defined in Table 1) for school-lunch reports were better for prior-24-hour recalls in the afternoon than previous-day recalls in the afternoon and evening; for prior-24-hour recalls in the evening than previous-day recalls in the afternoon and evening; and for previous-day recalls in the morning than previous-day recalls in the afternoon (five p-values <0.0021).
6 Inflation ratios (defined in Table 1) for school-lunch reports were better for prior-24-hour recalls in the afternoon than prior-24-hour recalls in the morning and previous-day recalls in the afternoon and evening; and for prior-24-hour recalls in the evening than previous-day recalls in the evening (four p values <0.0002). Because rank-transformed values are shown in Figure 2D for report rate and in Figure 2F for inflation ratio, the means shown in Figure 2E for correspondence rate and in Figure 2F for inflation ratio do not sum to the means shown in Figure 2D for report rate.
Observations
To conduct school-meal observations, research staff followed a written protocol. Each observer watched one to three children simultaneously and noted food items and amounts eaten in servings of standardized school-meal portions. Entire, regular meal periods were observed to note food trades (Baxter et al, 2001; Crawford et al, 1994; Simons-Morton & Baranowski, 1991). For meals in the cafeteria, children sat according to their school's typical arrangement. For breakfast in the classroom, children ate at their desks. Interobserver reliability was assessed regularly throughout data collection using established procedures (Baglio et al, 2004); results (Baxter et al, 2009) were satisfactory (Baranowski et al, 1986; Simons-Morton & Baranowski, 1991). For children randomized to prior-24-hour recalls in the morning, lunch was observed on one day and breakfast on the next day; for children in the other five conditions, breakfast and lunch were observed on the same day.
Interviews
To conduct 24-hour recalls, non-observing research staff interviewed children (without parental assistance) in person in private at school in the morning and afternoon after breakfast and lunch, respectively, and by telephone in the evening between 6:30 and 9:00 p.m. [Previously, no significant differences were found between in-person and telephone dietary recalls in fourth-grade children's accuracy (Baxter, Thompson, Litaker et al, 2003).] Written interview protocols, described elsewhere (Baxter et al, 2009), were modeled on the Nutrition Data System for Research (NDSR) protocol (Nutrition Coordinating Center, University of Minnesota, Minneapolis, MN). Interviewers used paper forms instead of NDSR software to note information reported by children. Interviews were audio-recorded and transcribed. Established procedures (Shaffer et al, 2004) were used to assess quality control for each interview; only interviews that passed quality control were analyzed (Baxter et al, 2009).
Analyses
Analyses were restricted to school meals because only these meals were observed. Meals in children's 24-hour recalls were treated as school-meal reports if children identified “school” as the location, referred to breakfast as “school breakfast” or “breakfast”, referred to lunch as “school lunch” or “lunch”, and reported mealtimes to within one hour of observed mealtimes. Of 374 children, these criteria were not met for school breakfast by 83 children (38 prior-24-hour recalls [8 morning, 18 afternoon, 12 evening]; 45 previous-day recalls [20 morning, 13 afternoon, 12 evening]) and for school lunch by 81 children (38 prior-24-hour recalls [7 afternoon, 9 evening, 22 morning]; 43 previous-day recalls [18 morning, 15 afternoon, 10 evening]).
For each of the two school meals per child, food items were classified as matches if they were both observed and reported, omissions if they were only observed, and intrusions if they were only reported (Smith, 1991; Smith et al, 1991). Reported items were classified as matches unless it was clear that children had not described items observed.
Amounts eaten were observed, reported, and scored in servings of standardized school-meal portions as none=0.00, taste=0.10, little bit=0.25, half=0.50, most=0.75, all=1.00, and the actual number of servings if >1.00 serving was observed and/or reported eaten. For observed and/or reported items, information about energy (in kilocalories) for standardized school-meal portions was obtained primarily from the NDSR database, but sometimes from the school district's nutrition program. For observed items, quantified servings were multiplied by per-serving energy values and summed across items for each meal per child; a similar process was used for reported items.
Nine outcome variables were calculated for each child for each of school breakfast and school lunch; Table 1 defines these variables and explains interpretation of their values. Four food-item variables (number of items observed; number of items reported; omission rate; intrusion rate) were calculated after assigning a meal-component weight to each item (see Table 1, footnote 1). Five energy variables (observed; reported; report rate; correspondence rate; inflation ratio) were calculated.
Table 1.
Four food-item outcome variables (listed alphabetically) and five energy outcome variables (listed alphabetically) calculated for each child for each of school breakfast and school lunch
| Outcome variable | Definition |
|---|---|
| Food-item variables1 | |
| Intrusion rate | This is a measure of reporting error. It is the percentage of items reported eaten that was not observed eaten. It was calculated for each child as: (sum of weighted intrusions / [sum of weighted intrusions + sum of weighted matches]) × 100. It has a lower bound of 0%, which indicates that all items reported eaten were observed eaten. It has an upper bound of 100%, which indicates that none of the items reported eaten were observed eaten. Smaller values indicate better reporting accuracy. |
| Number of items observed | This is the sum of weighted numbers of items observed eaten in any non-zero amount per child. |
| Number of items reported | This is the sum of weighted numbers of items reported eaten in any non-zero amount per child. |
| Omission rate | This is a measure of reporting error. It is the percentage of items observed eaten that was not reported eaten. It was calculated for each child as: (sum of weighted omissions / [sum of weighted omissions + sum of weighted matches]) × 100. It has a lower bound of 0%, which indicates that all items observed eaten were reported eaten. It has an upper bound of 100%, which indicates that no items observed eaten were reported eaten. Smaller values indicate better reporting accuracy. |
| Energy variables2 | |
| Correspondence rate | This is a measure of reporting accuracy that is sensitive to reporting errors. It is the percentage of the total observed amount of energy that was reported correctly. It was calculated for each child as: (sum of corresponding amounts from matches / sum of observed amounts) × 100. [The corresponding amount from a match is the smaller of the reported and observed amounts, or the reported amount if it equals the observed amount.] It has a lower bound of 0%, which indicates that no observed items were reported eaten. It has an upper bound of 100%, which indicates that all observed items and amounts were reported correctly. Larger values indicate better reporting accuracy. |
| Inflation ratio | This is a measure of reporting error. It is a non-negative augmentation to correctly reported information but which is based on inaccurate reporting. An inflation ratio was calculated for energy for each child as: {[(sum of overreported amounts from matches) + (sum of overreported amounts from intrusions)] / (sum of observed amounts)} × 100. It has a lower bound of 0%, which indicates that there were no intrusions and that no amounts of matches were overreported. It has no upper bound because there is no limit on what a person can report. Smaller inflation ratios indicate better reporting accuracy. The sum of inflation ratio plus correspondence rate equals report rate. |
| Observed energy | For a child, this is the sum of kilocalories from amounts of items observed eaten. |
| Report rate | This is a conventional measure of reporting accuracy which disregards reporting errors. It is the reported percentage of the observed amount. It was calculated for each child as: ([sum of reported amounts] / [sum of observed amounts]) × 100. Report rate has a lower bound of 0% but no upper bound. Traditional interpretation is that values close to 100%, less than 100%, and greater than 100% indicate high reporting accuracy, underreporting, and overreporting, respectively (Reynolds et al, 1990; Samuelson, 1970; Todd & Kretsch, 1986). However, a report rate misrepresents reporting accuracy because report rate is equal to correspondence rate plus inflation ratio. |
| Reported energy | For a child, this is the sum of kilocalories from amounts of items reported eaten. |
For each of the four food-item variables, a weight was assigned to each food item observed eaten and/or reported eaten according to meal component (beverage, bread/grain, breakfast meat, combination entrée [i.e., combination main], condiment, dessert, entrée [i.e., main], fruit, miscellaneous, vegetable) with combination entrée (e.g., hamburger on bun)=2, condiment (e.g., mustard, jam)=0.33, and remaining meal components=1, so that errors for combination entrées counted more than errors for condiments and remaining meal components.
For each of the five energy variables, amounts eaten were observed, reported, and scored in servings of standardized school-meal portions as none=0.00, taste=0.10, little bit=0.25, half=0.50, most=0.75, all=1.00, and the actual number of servings if >1 serving was observed and/or reported eaten. For observed items and for reported items, information about energy for standardized school-meal portions was obtained primarily from the Nutrition Data System for Research database, but sometimes from the school district's nutrition program. For observed items, quantified servings were multiplied by per-serving energy values and summed across items for each meal per child; a similar process was used for reported items.
A mixed-model analysis of variance was conducted for each outcome variable for breakfast and lunch separately. Due to departures from normality, rank-transformed report rates and inflation ratios were analyzed. Each model included the six conditions and sex. Breakfast models also included school-breakfast location (classroom; cafeteria). For each model, results were adjusted for school year and interviewer. For each analysis, a full model was estimated, all non-significant groups of terms (condition, sex, school year, interviewer) were removed if none of the terms were significant (i.e., p-values >0.05), and the model was re-estimated. Means for each of the 15 pairs of six conditions were compared using a Bonferroni-adjusted significance criterion of 0.0033 (0.05/15). Analyses were conducted using Stata 10.0 (Stata, Inc., College Station, TX) and SAS 9.0 (SAS Institute, Inc., Cary, NC).
Results
Results presented are for 291 children for school-breakfast reports (school-breakfast location: 169 classroom, 122 cafeteria) and 293 children for school-lunch reports. Children who failed to meet criteria for reporting school breakfast (n=83) or school lunch (n=81) were excluded because the value zero would have had to be assigned for each variable except observed amounts, but such zeros would have been qualitatively different from true zeros.
Table 2 shows information about mean numbers of items and energy observed and reported, for school breakfast (overall and by location) and school lunch, by condition. For school breakfast, neither observed nor reported intake (number of items or energy) varied significantly by condition, sex, or location. For school lunch, neither observed nor reported intake varied significantly by sex. For school-lunch reports, more items and energy were reported for previous-day recalls in the morning than previous-day recalls in the afternoon (two p-values ≤0.0025), and more items were reported for previous-day recalls in the morning than prior-24-hour recalls in the morning (p=0.0010).
Table 2.
Information about mean numbers of items and energy observed and reported by fourth-grade children, for school breakfast (overall and by school-breakfast location) and school lunch, by condition1
| Prior 24 hour / morning | Prior 24 hour / afternoon | Prior 24 hour / evening | Previous day / morning | Previous day / afternoon | Previous day / evening | |
|---|---|---|---|---|---|---|
 Mean Mean
| ||||||
 (Standard Deviation) (Standard Deviation)
| ||||||
| School breakfast (overall) | ||||||
| number of children (291 total) | 54 | 44 | 50 | 42 | 49 | 52 |
| girls (143 total) | 25 | 20 | 25 | 18 | 27 | 28 |
| boys (148 total) | 29 | 24 | 25 | 24 | 22 | 24 |
| number of items observed2 | 2.81 (0.78) |
2.87 (0.56) |
2.70 (0.83) |
2.76 (0.73) |
2.64 (0.86) |
2.77 (0.73) |
| number of items reported3 | 3.06 (0.81) |
3.03 (0.85) |
2.98 (0.89) |
3.06 (0.66) |
3.08 (0.98) |
3.26 (1.09) |
| energy observed4 | 282 (110) |
315 (102) |
267 (127) |
260 (122) |
262 (127) |
266 (135) |
| energy reported5 | 289 (126) |
309 (128) |
282 (127) |
281 (140) |
315 (171) |
337 (176) |
| School breakfast (in the classroom) | ||||||
| number of children (169 total) | 34 | 27 | 26 | 23 | 25 | 34 |
| girls (83 total) | 16 | 12 | 13 | 9 | 14 | 19 |
| boys (86 total) | 18 | 15 | 13 | 14 | 11 | 15 |
| number of items observed2 | 2.82 (0.83) |
2.89 (0.51) |
2.46 (0.86) |
2.65 (0.65) |
2.76 (0.78) |
2.65 (0.65) |
| number of items reported3 | 2.97 (0.83) |
2.89 (0.94) |
2.81 (0.94) |
3.01 (0.68) |
3.09 (1.06) |
3.04 (1.23) |
| energy observed4 | 281 (109) |
329 (106) |
255 (134) |
289 (139) |
288 (120) |
270 (121) |
| energy reported5 | 270 (114) |
322 (133) |
253 (127) |
331 (147) |
330 (154) |
342 (206) |
| School breakfast (in the cafeteria) | ||||||
| number of children (122 total) | 20 | 17 | 24 | 19 | 24 | 18 |
| girls (60 total) | 9 | 8 | 12 | 9 | 13 | 9 |
| boys (62 total) | 11 | 9 | 12 | 10 | 11 | 9 |
| number of items observed2 | 2.80 (0.70) |
2.84 (0.65) |
2.96 (0.74) |
2.89 (0.81) |
2.51 (0.94) |
3.00 (0.84) |
| number of items reported3 | 3.20 (0.77) |
3.25 (0.66) |
3.17 (0.80) |
3.11 (0.66) |
3.07 (0.89) |
3.67 (0.61) |
| energy observed4 | 284 (115) |
294 (94) |
280 (120) |
226 (89) |
234 (130) |
258 (161) |
| energy reported5 | 321 (141) |
287 (119) |
313 (122) |
221 (106) |
300 (189) |
328 (104) |
| School lunch | ||||||
| number of children (293 total) | 40 | 55 | 53 | 44 | 47 | 54 |
| girls (149 total) | 21 | 30 | 27 | 20 | 25 | 26 |
| boys (144 total) | 19 | 25 | 26 | 24 | 22 | 28 |
| number of items observed2 | 4.78 (1.25) |
5.29 (1.52) |
5.12 (1.43) |
5.35 (1.45) |
4.98 (1.41) |
4.88 (1.36) |
| number of items reported3 | 4.02 (1.47) |
4.40 (1.50) |
4.68 (1.25) |
5.05 (1.40) |
4.01 (1.15) |
4.54 (1.27) |
| energy observed4 | 467 (185) |
566 (263) |
520 (220) |
603 (249) |
500 (148) |
496 (226) |
| energy reported5 | 410 (195) |
444 (234) |
444 (173) |
495 (223) |
370 (147) |
430 (173) |
Definitions for the six conditions and their labels are provided in footnote 1 of the legend for Figure 1.
Number of items observed (defined in Table 1): For school breakfast, analysis of variance (ANOVA) found no significant effects of condition, sex, or breakfast location. For school lunch, ANOVA found no significant effects of condition or sex.
Number of items reported (defined in Table 1): For school breakfast, ANOVA found no significant effects of condition, sex, or breakfast location. For school lunch, ANOVA found no significant effect of sex, but more items were reported for previous-day recalls in the morning than previous-day recalls in the afternoon and prior 24-hour recalls in the morning (two p-values ≤0.0010).
Energy observed (in kilocalories; defined in Table 1): For school breakfast, ANOVA found no significant effects of condition, sex, or breakfast location. For school lunch, ANOVA found no significant effects of condition or sex.
Energy reported (in kilocalories; defined in Table 1): For school breakfast, ANOVA found no significant effects of condition, sex, or breakfast location. For school lunch, ANOVA found no significant effect of sex, but more energy was reported for previous-day recalls in the morning than previous-day recalls in the afternoon (p=0.0025).
Concerning school-breakfast reports, Figure 1B–F illustrates information about five reporting-accuracy variables; each panel shows the conditions from shortest to longest retention interval. Omission rates and intrusion rates (indicating reporting error for food items) were smaller (better) for prior-24-hour recalls in the morning than previous-day recalls in the morning, afternoon, and evening; for prior-24-hour recalls in the afternoon than previous-day recalls in the afternoon and evening; and for prior-24-hour recalls in the evening than previous-day recalls in the evening (12 p-values <0.0003). Correspondence rates (indicating reporting accuracy for energy) were larger (better) for prior-24-hour recalls in the morning than previous-day recalls in the morning, afternoon, and evening; and for prior-24-hour recalls in the afternoon than previous-day recalls in the afternoon and evening (five p-values <0.0018). Inflation ratios (indicating reporting error for energy) were smaller (better) for prior-24-hour recalls in the morning than previous-day recalls in the afternoon and evening; for prior-24-hour recalls in the afternoon than previous-day recalls in the afternoon and evening; and for prior-24-hour recalls in the evening than previous-day recalls in the evening (five p-values <0.0005). Report rates (indicating energy reported relative to energy observed) did not differ significantly across the six conditions. There were no significant effects of school-breakfast location or sex for any of the five reporting-accuracy variables for school-breakfast reports.
Concerning school-lunch reports, Figure 2B–F illustrates information about five reporting-accuracy variables; each panel shows the conditions from shortest to longest retention interval. Omission rates and intrusion rates were better for prior-24-hour recalls in the afternoon than prior-24-hour recalls in the morning and previous-day recalls in the afternoon and evening; for prior-24-hour recalls in the evening than prior-24-hour recalls in the morning and previous-day recalls in the afternoon and evening; and for previous-day recalls in the morning than previous-day recalls in the afternoon (14 p-values <0.0011). Also, intrusion rates were better for prior-24-hour recalls in the afternoon than previous-day recalls in the morning; and for previous-day recalls in the morning than previous-day recalls in the evening (two p-values <0.0021). Correspondence rates were better for prior-24-hour recalls in the afternoon than previous-day recalls in the afternoon and evening; for prior-24-hour recalls in the evening than previous-day recalls in the afternoon and evening; and for previous-day recalls in the morning than previous-day recalls in the afternoon (five p-values <0.0021). Inflation ratios were better for prior-24-hour recalls in the afternoon than prior-24-hour recalls in the morning and previous-day recalls in the afternoon and evening; and for prior-24-hour recalls in the evening than previous-day recalls in the evening (four p-values <0.0002). Report rates did not differ significantly across the six conditions. There was no significant sex effect for any of the five reporting-accuracy variables for school-lunch reports.
Discussion
Children's accuracy for school-breakfast reports and for school-lunch reports in 24-hour recalls was best when retention intervals were shortest, with accuracy deteriorating as retention intervals increased. Specifically, as indicated by smaller omission rates, smaller intrusion rates, larger correspondence rates, and smaller inflation ratios, accuracy for school-breakfast reports was best for prior-24-hour recalls in the morning, and accuracy for school-lunch reports was best for prior-24-hour recalls in the afternoon. Also, fewer recalls failed to meet criteria for meals to be treated as referring to the respective school meal when the retention interval was shortest—with prior-24-hour recalls in the morning for school-breakfast reports, and with prior-24-hour recalls in the afternoon for school-lunch reports.
Concerning school-lunch reports, retention-interval lengths were identical for prior-24-hour recalls in the morning and previous-day recalls in the morning (see Figure 2A), with lunch eaten on the day before the interview. However, as indicated by smaller omission rates, smaller intrusion rates, larger correspondence rates, and smaller inflation ratios, accuracy tended to be better for school-lunch reports for previous-day recalls in the morning than prior-24-hour recalls in the morning, although differences between these two conditions were not significant at p<0.0033 (the Bonferroni-adjusted criterion). Better accuracy for school-lunch reports for previous-day recalls in the morning than prior-24-hour recalls in the morning suggests that children's accuracy for school-lunch reports was better when recalls concerned all meals eaten on the day before the interview, instead of some meals eaten on the interview day and other meals eaten on the day before. However, this could be due to the reporting-order prompts used in the retention-interval validation study. For previous-day recalls, forward-order prompts were used to ask children to report the previous day's intake starting with when they awoke, and going forward through the day. For prior-24-hour recalls, a segmented forward-order prompting approach was used to ask children to report intake for the interview day starting with when they awoke and going forward until the time of the interview, followed by the previous day's intake beginning 24 hours before the interview start time and going forward to cover the rest of that day.
It is possible that reverse-order prompts have a stronger positive influence on accuracy for prior-24-hour recalls than previous-day recalls. Although one dietary-reporting validation study with children has investigated forward- versus reverse-order prompts during previous-day recalls (Baxter, Thompson, Smith et al, 2003), to our knowledge, no validation study has investigated forward- versus reverse-order prompts during prior-24-hour recalls.
For school-breakfast reports and for school-lunch reports, analyses of report rates did not indicate significant differences across the six conditions that were evident with analyses of omission rates, intrusion rates, correspondence rates, and inflation ratios. These results add to a growing body of research which raises concerns about using report rates in dietary-reporting validation studies (Baxter et al, submitted; Baxter et al, 2007a, 2007b; Smith et al, 2007). In other words, simply dividing “reported energy” by “observed energy” without examining which items or amounts were reported correctly provides little insight into reporting accuracy.
Concerning school-breakfast location, an earlier study (Bernstein et al, 2004) found that, for the target day, a larger share of children with breakfast in the classroom reported having eaten two or more breakfasts (at school and at home) than children without breakfast in the classroom, and children with breakfast in the classroom reported higher intakes of energy at breakfast (but not over 24 hours) than children without breakfast in the classroom. (For children without breakfast in the classroom, the primary location for school breakfast was the cafeteria.) In contrast, analyses for the current article found no significant differences by school-breakfast location (classroom; cafeteria) in reported intake, and no significant location effect for any of the five reporting-accuracy variables. There was a one-sixth SD difference in mean observed energy by location (higher in the classroom). This was not significant in ANOVA models, but a test of medians (χ2=6.27, p=0.012) indicated there may be a systematic difference with higher observed energy in the classroom. A future study should investigate this.
There are limitations to the data analyzed for the current article, primarily due to aspects of the original validation study's design which included only fourth-grade children from one school district. No attempt was made to balance the selection of schools (within school year) by school-breakfast location. Analyses were restricted to school meals in children's 24-hour recalls. Qualitative terms were converted to quantitative terms for amounts of standardized school-meal portions.
There are several strengths. The validation method consisted of observation—the gold standard for validation (Mertz, 1992)—conducted in an environment and manner that minimized reactivity and captured food trades. Quality control was assessed throughout data collection for observations and interviews.
There is an increased need for more accurate information about children's school-meal intake due to concerns about whether school meals promote children's health and well-being (Ralston et al, 2008; Story et al, 2008). Results in this article illustrate that by shortening the retention interval, children's accuracy can be improved for school-breakfast reports and school-lunch reports obtained in 24-hour recalls.
Acknowledgments
This research was supported by the National Heart, Lung, and Blood Institute of the National Institutes of Health (grant R01 HL074358 to SD Baxter). The content of this article is solely the responsibility of the authors and does not necessarily represent the official views of the National Heart, Lung, and Blood Institute or the National Institutes of Health.
The authors appreciate the cooperation of children, faculty, and staff of elementary schools, and staff of Student Nutrition Services, of the Richland One School District (Columbia, SC).
The authors give tribute to Amy F. Joye, MS, RD; Amy was Project Director for this grant until she suffered severe brain damage due to a medical tragedy at age 36. The Amy Joye Memorial Research Fund has been established through the American Dietetic Association Foundation to award nutrition research grants on an annual basis in Amy's memory.
Footnotes
Conflict of Interest statement: This research was supported by the National Heart, Lung, and Blood Institute of the National Institutes of Health (grant R01 HL074358 to SD Baxter). SD Baxter has received other competitive research grants from the National Institutes of Health and from the Food Assistance and Nutrition Research Program of the Economic Research Service of the US Department of Agriculture. SD Baxter has also received consulting fees for reviewing grant applications for the National Institutes of Health.
References
- Baglio ML, Baxter SD, Guinn CH, Thompson WO, Shaffer NM, Frye FHA. Assessment of interobserver reliability in nutrition studies that use direct observation of school meals. J Am Diet Assoc. 2004;104:1385–1393. doi: 10.1016/j.jada.2004.06.019. [DOI] [PMC free article] [PubMed] [Google Scholar]
- Baranowski T, Dworkin R, Henske JC, Clearman DR, Dunn JK, Nader PR, et al. The accuracy of children's self-reports of diet: Family Health Project. J Am Diet Assoc. 1986;86:1381–1385. [PubMed] [Google Scholar]
- Baranowski T, Smith M, Baranowski J, Wang DT, Doyle C, Lin LS, et al. Low validity of a seven-item fruit and vegetable food frequency questionnaire among third-grade students. J Am Diet Assoc. 1997;97:66–68. doi: 10.1016/S0002-8223(97)00022-9. [DOI] [PubMed] [Google Scholar]
- Baxter SD. Cognitive processes in children's dietary recalls: insight from methodological validation studies. Eur J Clin Nutr. 2009;63(Suppl):S19–S32. doi: 10.1038/ejcn.2008.61. [DOI] [PMC free article] [PubMed] [Google Scholar]
- Baxter SD, Guinn CH, Royer JA, Hardin JW, Mackelprang AJ, Smith AF. Retention interval and fourth-grade children's accuracy for reporting energy intake at school meals submitted. [Google Scholar]
- Baxter SD, Hardin JW, Guinn CH, Royer JA, Mackelprang AJ, Smith AF. Fourth-grade children's dietary recall accuracy is influenced by retention interval (target period and interview time) J Am Diet Assoc. 2009;109:846–856. doi: 10.1016/j.jada.2009.02.015. [DOI] [PMC free article] [PubMed] [Google Scholar]
- Baxter SD, Smith AF, Guinn CH, Thompson WO, Litaker MS, Baglio ML, et al. Interview format influences the accuracy of children's dietary recalls validated with observations. Nutr Res. 2003;23:1537–1546. [Google Scholar]
- Baxter SD, Smith AF, Hardin JW, Nichols MN. Conclusions about children's reporting accuracy for energy and macronutrients over multiple interviews depend on the analytic approach for comparing reported information to reference information. J Am Diet Assoc. 2007a;107:595–604. doi: 10.1016/j.jada.2007.01.007. [DOI] [PMC free article] [PubMed] [Google Scholar]
- Baxter SD, Smith AF, Hardin JW, Nichols MN. Conventional energy and macronutrient variables distort the accuracy of children's dietary reports: Illustrative data from a validation study of effect of order prompts. Prev Med. 2007b;44:34–41. doi: 10.1016/j.ypmed.2006.07.011. [DOI] [PMC free article] [PubMed] [Google Scholar]
- Baxter SD, Smith AF, Litaker MS, Guinn CH, Nichols MN, Miller PH, et al. Body mass index, sex, interview protocol, and children's accuracy for reporting kilocalories observed eaten at school meals. J Am Diet Assoc. 2006;106:1656–1662. doi: 10.1016/j.jada.2006.07.013. [DOI] [PMC free article] [PubMed] [Google Scholar]
- Baxter SD, Smith AF, Litaker MS, Guinn CH, Shaffer NM, Baglio ML, et al. Recency affects reporting accuracy of children's dietary recalls. Ann Epidemiol. 2004;14:385–390. doi: 10.1016/j.annepidem.2003.07.003. [DOI] [PubMed] [Google Scholar]
- Baxter SD, Thompson WO, Davis HC. Trading of food during school lunch by first- and fourth-grade children. Nutr Res. 2001;21:499–503. [Google Scholar]
- Baxter SD, Thompson WO, Litaker MS, Frye FHA, Guinn CH. Low accuracy and low consistency of fourth-graders' school breakfast and school lunch recalls. J Am Diet Assoc. 2002;102:386–395. doi: 10.1016/s0002-8223(02)90089-1. [DOI] [PMC free article] [PubMed] [Google Scholar]
- Baxter SD, Thompson WO, Litaker MS, Guinn CH, Frye FHA, Baglio ML, et al. Accuracy of fourth-graders' dietary recalls of school breakfast and school lunch validated with observations: In-person versus telephone interviews. J Nutr Educ Behav. 2003;35:124–134. doi: 10.1016/s1499-4046(06)60196-6. [DOI] [PMC free article] [PubMed] [Google Scholar]
- Baxter SD, Thompson WO, Smith AF, Litaker MS, Yin Z, Frye FHA, et al. Reverse versus forward order reporting and the accuracy of fourth-graders' recalls of school breakfast and school lunch. Prev Med. 2003;36:601–614. doi: 10.1016/s0091-7435(02)00030-0. [DOI] [PubMed] [Google Scholar]
- Bernstein LS, McLaughlin JE, Crepinsek MK, Daft LM. Alexandria, VA: 2004. [July 7, 2009]. Evaluation of the School Breakfast Program Pilot Project: Final Report. Nutrition Assistance Program Report Series, No. CN-04-SBP. Project Officer: Anita Singh. http://www.fns.usda.gov/oane/MENU/published/CNP/FILES/SBPPFinal.pdf. [Google Scholar]
- Buzzard M. 24-hour dietary recall and food record methods. In: Willett W, editor. Nutritional Epidemiology. 2nd. New York, NY: Oxford University Press; 1998. pp. 50–73. [Google Scholar]
- Crawford PB, Obarzanek E, Morrison J, Sabry ZI. Comparative advantage of 3-day food records over 24-hour recall and 5-day food frequency validated by observation of 9- and 10-year-old girls. J Am Diet Assoc. 1994;94:626–630. doi: 10.1016/0002-8223(94)90158-9. [DOI] [PubMed] [Google Scholar]
- Crepinsek MK, Singh A, Bernstein LS, McLaughlin JE. Dietary effects of universal-free school breakfast: Findings from the Evaluation of the School Breakfast Program Pilot Project. J Am Diet Assoc. 2006;106:1796–1803. doi: 10.1016/j.jada.2006.08.013. [DOI] [PubMed] [Google Scholar]
- Domel SB, Baranowski T, Davis HC, Leonard SB, Riley P, Baranowski J. Fruit and vegetable food frequencies by fourth and fifth grade students: Validity and reliability. J Am Coll Nutr. 1994;13:33–39. doi: 10.1080/07315724.1994.10718368. [DOI] [PubMed] [Google Scholar]
- Gordon AR, Cohen R, Crepinsek MK, Fox MK, Hall J, Zeidman E. The Third School Nutrition Dietary Assessment Study: Background and study design. J Am Diet Assoc. 2009;109(Suppl):S20–S30. doi: 10.1016/j.jada.2008.10.057. [DOI] [PubMed] [Google Scholar]
- Gordon AR, Crepinsek MK, Briefel RR, Clark MA, Fox MK. The Third School Nutrition Dietary Assessment Study: Summary and implications. J Am Diet Assoc. 2009;109(Suppl):S129–S135. doi: 10.1016/j.jada.2008.10.066. [DOI] [PubMed] [Google Scholar]
- Himes JH, Ring K, Gittelsohn J, Cunningham-Sabo L, Weber J, Thompson JK, et al. Impact of the Pathways intervention on dietary intakes of American Indian schoolchildren. Prev Med. 2003;37(Suppl):S55–S61. doi: 10.1016/j.ypmed.2003.08.003. [DOI] [PubMed] [Google Scholar]
- Luepker RV, Perry CL, McKinlay SM, Nader PR, Parcel GS, Stone EJ, et al. Outcomes of a field trial to improve children's dietary patterns and physical activity: The Child and Adolescent Trial for Cardiovascular Health (CATCH) JAMA. 1996;275:768–776. doi: 10.1001/jama.1996.03530340032026. [DOI] [PubMed] [Google Scholar]
- Mertz W. Food intake measurements: Is there a “gold standard”? J Am Diet Assoc. 1992;92:1463–1465. [PubMed] [Google Scholar]
- Moore HJ, Ells LJ, McLure SA, Crooks S, Cumbor D, Summerbell CD, et al. The development and evaluation of a novel computer program to assess previous-day dietary and physical activity behaviours in school children: The Synchronised Nutrition and Activity Program™ (SNAP™) Br J Nutr. 2008;99:1266–1274. doi: 10.1017/S0007114507862428. [DOI] [PubMed] [Google Scholar]
- Ralston K, Newman C, Clauson A, Guthrie J, Buzby J. US Department of Agriculture, Economic Research Service; 2008. [July 7, 2009]. The National School Lunch Program: Background, Trends, and Issues. Economic Research Report No. EER-61. http://www.ers.usda.gov/Publications/ERR61/ [Google Scholar]
- Reynolds LA, Johnson SB, Silverstein J. Assessing daily diabetes management by 24-hour recall interview: The validity of children's reports. J Pediatr Psychol. 1990;15:493–509. doi: 10.1093/jpepsy/15.4.493. [DOI] [PubMed] [Google Scholar]
- Samuelson G. An epidemiological study of child health and nutrition in a northern Swedish county. II. Methodological study of the recall technique. Nutr Metab. 1970;12:321–340. doi: 10.1159/000175306. [DOI] [PubMed] [Google Scholar]
- Shaffer NM, Baxter SD, Thompson WO, Baglio ML, Guinn CH, Frye FHA. Quality control for interviews to obtain dietary recalls from children for research studies. J Am Diet Assoc. 2004;104:1577–1585. doi: 10.1016/j.jada.2004.07.027. [DOI] [PMC free article] [PubMed] [Google Scholar]
- Simons-Morton BG, Baranowski T. Observation in assessment of children's dietary practices. J Sch Health. 1991;61:204–207. doi: 10.1111/j.1746-1561.1991.tb06012.x. [DOI] [PubMed] [Google Scholar]
- Smith AF. Cognitive Processes in Long-term Dietary Recall. 4 Hyattsville, MD: National Center for Health Statistics, Vital and Health Statistics; 1991. (6). [Google Scholar]
- Smith AF, Baxter SD, Hardin JW, Nichols MN. Conventional analyses of data from dietary validation studies may misestimate reporting accuracy: Illustration from a study of the effect of interview modality on children's reporting accuracy. Public Health Nutr. 2007;10:1247–1256. doi: 10.1017/S136898000768714X. [DOI] [PMC free article] [PubMed] [Google Scholar]
- Smith AF, Jobe JB, Mingay DJ. Retrieval from memory of dietary information. Appl Cognit Psychol. 1991;5:269–296. [Google Scholar]
- Story M, Kaphingst KM, Robinson-O'Brien R, Glanz K. Creating healthy food and eating environments: Policy and environmental approaches. Annu Rev Public Health. 2008;29:253–272. doi: 10.1146/annurev.publhealth.29.020907.090926. [DOI] [PubMed] [Google Scholar]
- Story M, Snyder MP, Anliker J, Weber JL, Cunningham-Sabo L, Stone EJ, et al. Changes in the nutrient content of school lunches: results from the Pathways study. Prev Med. 2003;37(Suppl):S35–S45. doi: 10.1016/j.ypmed.2003.08.009. [DOI] [PubMed] [Google Scholar]
- Tapper K, Murphy S, Moore L, Lynch R, Clark R. Evaluating the free school breakfast initiative in Wales: methodological issues. Br Food J. 2007;109:206–215. [Google Scholar]
- Todd KS, Kretsch MJ. Accuracy of the self-reported dietary recall of new immigrant and refugee children. Nutr Res. 1986;6:1031–1043. [Google Scholar]