

Abstract
Background
Borderline personality disorder (BPD) is often associated with symptoms of impulsive aggression, which pose a threat to patients themselves and to others. Preclinical studies show that orbital frontal cortex (OFC) plays a role in regulating impulsive aggression. Prior work has found OFC dysfunction in BPD.
Methods
We employed a task to provoke aggressive behavior, the Point Subtraction Aggression Paradigm (PSAP), which has never previously been used during functional brain imaging. Thirty-eight BPD patients with impulsive aggression (BPD-IED) and 36 age-matched healthy controls (HC) received 18FDG-PET on two occasions with a provocation and non-provocation version of the PSAP. For each participant, we measured mean relative glucose metabolism in cortical Brodmann areas (BAs) in each hemisphere; difference scores (Provoked–Non-provoked) were calculated. A whole brain exploratory analysis for the double difference of BPD-IED–HC for Provoked–Non-provoked was also conducted.
Results
BPD-IED patients were significantly more aggressive than HC on the PSAP. BPD-IED patients also increased relative glucose metabolic rate (rGMR) in OFC and amygdala when provoked, while HC decreased rGMR in these areas. However, HC increased rGMR in anterior, medial, and dorsolateral prefrontal regions during provocation more than BPD-IED patients.
Conclusions
Patients responded aggressively and showed heightened rGMR in emotional brain areas, including amygdala and OFC in response to provocation, but not in more dorsal brain regions associated with cognitive control of aggression. In contrast, HC increased rGMR in dorsal regions of PFC during aggression provocation, brain regions involved in top-down cognitive control of aggression and, more broadly, of emotion.
Keywords: brain imaging, Point Subtraction Aggression Paradigm, PSAP, emotion
Introduction
Borderline personality disorder (BPD) is associated with elevated risk of violence(1). While BPD’s symptoms traverse a number of domains, behavioral disinhibition, including aggression, is common(2,3). The present study used 18fluoro-deoxyglucose positron emission tomography (18FDG-PET) to examine brain activity changes during a behavioral aggression provocation task in healthy individuals and in BPD patients selected for serious impulsive aggression.
Behavioral Disinhibition in BPD
BPD brain imaging studies have shown disruption of the neural circuitry implicated in impulsive aggression, leading to the hypothesis that abnormal frontal inhibition of limbic regions may underlie BPD pathology. For example, anatomical MRI studies using manual tracing show volume reduction in BPD in frontal regions, including right anterior cingulate gyrus (ACG)(4), especially in gray matter volume(5), and decreased activity in ACG in response to a serotonergic probe(6,7). A recent study showed decreased gray matter volume in right orbital frontal cortex (OFC) in BPD adolescents(8). A resting 18FDG-PET study in BPD revealed an inverse correlation between lifetime aggression and OFC metabolism(9). Subsequent 18FDG-PET scans conducted in a resting state confirmed hypometabolism in BPD patients in OFC(10) and ACG(10,11). Together, these studies suggest that BPD patients have abnormal frontal modulation of limbic regions.
Functional imaging studies employing tasks to explore regional brain activity associated with specific emotional states have shown that in response to individualized abandonment scripts, BPD patients showed higher activation in anteromedial prefrontal cortex (PFC) compared to controls(12,13). Our recent fMRI study showed greater amygdala activation and attenuated activation in dorsal ACG and dorsal PFC to fearful in BPD compared to controls(14). Similarly, personality disorder patients with impulsive aggression show exaggerated amygdala reactivity and diminished OFC activation to angry faces(15). A recent BPD fMRI study showed a similar pattern of greater-than-normal activity in the amygdala and decreased ventromedial PFC activity during negative emotion provocation(16). Finally, correlational and connectivity studies have shown disruption of the PFC-amygdala network in BPD(17). Together, these studies provide support for a BPD model of diminished frontal inhibition of amygdala during emotion provocation.
Neuroanatomy of Violence
The brain regions shown to be dysfunctional in BPD have also been implicated more broadly in the control of aggression. In non-human primates, ablation of posterior OFC resulted in hyperactivity and aggression(18). Subsequent studies showed that after OFC lesions, rhesus monkeys exhibited decreased aggression(19). However, in high-dominance monkeys, increased aggression with loss of the dominance role was observed following OFC lesions(20). Very selective lesions of OFC in rhesus monkeys resulted in modest decreases in affiliative and increases in threat behaviors; however, other forms of aggression (e.g., intruder aggression) decreased(21). These studies point to a role for OFC in modulating aggression, but also highlight the complexity of that role and the importance of social context to behavioral sequelae of OFC damage.
Human studies show that damage to anterior and medial OFC and ACG results in impulsive(22) and aggressive behavior(23,24). While this suggests that OFC may have a role in constraining impulsivity(25), the role of OFC is complex and may increase or decrease the likelihood of aggressive outbursts as a function of social cues and context(26).
Resting functional imaging studies have shown decreased metabolism in medial cortex/OFC in murderers(27,28), and in perpetrators of domestic violence(29). Two functional imaging studies of anger induction showed activation of OFC in healthy men (30,31). The only brain imaging study of aggression provocation to date, showed that healthy men deactivate OFC during imagined aggression(32).
The present study is the first to gather functional brain imaging data during aggression provocation in both HC and impulsive-aggressive BPD patients. An 18FDG-PET scan was obtained on two separate days with the Point Subtraction Aggression Paradigm (PSAP), a task in which subjects play a game for points (later translated into money) with a putative other player(33). On one scan day, the task involved an aggression provocation, while on the other scan day, no provocation was used. We chose to study of subset of BPD patients, selecting those with clinically significant impulsive aggression (meeting criteria for IED-R)(34) to find a homogeneous group of subjects with aggressive symptoms. We hypothesized amygdala would be more activated by aggression provocation in the BPD-IED than the control group and that top-down control regions of PFC would be less active in the BPD-IED than the control group.
Methods
Subjects
Thirty-eight patients meeting DSM-IV criteria for BPD and IED-R (22M/16F, age: 30.5, SD=8.5yrs) and thirty-six HC (18M/18F, age: 28.4, SD=7.1yrs) with no personal or first-degree family history of psychiatric disorders completed the study. There was no significant group difference in sex distribution (χ2=(1,n=74)= 0.46, p=ns), nor in mean age between groups (F(1,72)=1.4, p=n.s and no group×sex interaction ((F(1,72)=1.3, p=n.s). Subjects were recruited through local newspaper advertisements and clinical referral. All subjects were medically healthy as assessed by history, physical exam and standard laboratory tests. All subjects were free of psychiatric medication for at least two months. Subjects were excluded for substance abuse or dependence in the prior six-months. Two subjects were excluded because they did not believe the task deception (1-HC, 1-BPD-IED). Subjects had a negative urine toxicology screen, and females a negative pregnancy test on each scan day. One subject was excluded for a positive pregnancy test (BPD-IED) and three for positive urine toxicology screen (1-HC, 2-BPD-IED) on the scan day. Participants provided written informed consent in accordance with IRB guidelines. See Table 1 for patient characteristics.
Table 1.
Demographics/Clinical Information
| Group | Healthy (n=36) | BPD-IED (n=38) |
|---|---|---|
| Mean Age (yrs) | Men: n=18, 27.9 (6.0) Women: n=18, 28.9 (8.1) range: 19–55 |
Men: n=22, 31.7 (8.6) Women: n=16, 28.8 (8.3) range: 18–48 |
| Race | 4H, 3AA, 4C, 1A, 2O | 4H, 6AA, 5C, |
| Sex | 18M/18F | 22M/16F |
| Handedness | 32(right-handed), 2(left-handed), 2(mixed) | 32(right-handed), 4(left-handed), 2(mixed) |
| ALS | 0.4 (0.4) M: 0.4(0.3) F:0.3(0.4) |
1.7 (.5)** M: 1.7(0.5) F:1.7(0.6) |
| BIS | 50.2 (25.0) M: 51.6(24.8) F:48.8(25.9) |
77.1(29.7) ** M: 83.8(34.6) F:65.3(12.0) |
| tBUSS | 41.3 (6.9) M: 41.2(7.8) F:41.4(6.3) |
76.6 (8.7) ** M: 75.8(9.8) F:78.1(6.2) |
| STAXI-trait | 13.9 (3.3) M: 13.9(3.1) F:13.9(3.7) |
27.0(6.9) ** M: 26.1(7.2) F:28.6(6.1) |
| OAS-M | ||
| agg | 1.2 (2.9) M: 1.8 (4.0) F: 0.7 (1.0) |
20.6 (17.6)** M: 19.0(18.7) F:22.8(16.3) |
| irr | 1.3 (1.1) M: 1.4 (1.2) F: 1.2 (0.9) |
6.3 (2.1)** M: 5.9 (2.1) F: 6.8 (1.9) |
| sui | 0.0 (0.0) M: 0.0 (0.0) F: 0.0 (0.0) |
0.4 (0.7)* M: 0.3 (0.7) F: 0.5 (0.6) |
| BDI | 1.3 (2.1) M: 1.1 (1.9) F: 1.4 (2.3) |
16.7 (8.1)* M: 17.4 (6.6) F: 15.6 (10.2) |
Data shown as Mean (SD).
p<.001,
p<.01. Race is self-identified race. ALS=Affective Lability Scale, BIS=Barratt Impulsivity Scale-7b, t-BUSS=composite of BDHI and BPAQ, BDI=Beck Depression Inventory, STAXI=State-Trait Anger Expression Inventory. No clinical measures showed a main effect of sex or a diagnosis by sex interaction that was significant.
Diagnostics
Diagnoses were made by a psychologist, using the Structured Clinical Interview for DSM-IV Axis I(35) and the Structured Interview for DSM-IV Personality Disorders(36) (BPD:κ=0.88). Final diagnoses were confirmed by consensus meeting. Subjects were excluded for schizophrenia, schizophrenia-related psychotic disorders or bipolar I. BPD-IED patients may have had major depressive disorder (MDD) in the past, as depression is frequently co-morbid with BPD, but patients with current MDD were excluded. Patients with PTSD were accepted into the study, as a high rate of PTSD in BPD has been reported(37). (See Tables S1 & S2 in Supplement 1 for full diagnoses and medication histories). We explored the effect of PTSD and MDD on outcome measures, as the same neural circuits implicated in BPD may also function abnormally in PTSD(38) and MDD(39). IED-R diagnosis was made with the “Module for Intermittent Explosive Disorder-Revised”(34) (IED-R:κ=0.92). We employed this research diagnosis because of limitations in the DSM-IV diagnosis of IED, including the absence of a requirement for functional impairment resulting from aggressive acts, the exclusion of subjects in whom the aggressive acts are not “better accounted for” by personality disorders, and because it does not count verbal aggression(40). The diagnosis of IED-R addresses these deficits, expanding the DSM-IV definition(34,41). Subjects completed the: Barratt Impulsivity Scale (BIS-11)(42); Affective Lability Scale (ALS)(43); Beck Depression Inventory (BDI)(44); State-Trait Anger Expression Inventory (STAXI)(45); and the Overt-Aggression-Scale-Modified (OAS-M-covering the prior two-weeks). Subjects also completed the Buss-Durkee Hostility Inventory (BDHI)(46) or the Buss Perry Aggression Questionnaire (BPAQ-an updated BDHI)(47); a composite score was calculated, utilizing z-scores. Handedness was determined with the Edinburgh-handedness-scale(48).
The Point Subtraction Aggression Paradigm
The PSAP is a validated method of provoking aggression in a laboratory setting through a computer game(33,49). It measures a participant’s aggressive responses to the subtraction of ‘points’ worth money which he/she accumulates during a 35-minute testing session (standardly 25-minutes: modified to match the 18FDG-uptake period), where losses are blamed on the responding of a fictitious other person. Unbeknownst to the subject, however, the level of provocation is set by the investigator as a “provocation-free-interval” (“pfi”). In the present study, we used two levels of provocation. In the “provoked” task, the “pfi” (which can be triggered either by the subject’s pressing the B or C buttons), was set at 62.5 seconds; in the ‘non-provoked” condition, the “pfi” was set at infinity, and so no provocations occurred throughout the session. The active task was set at a high level of provocation to insure that both the controls and the patients were provoked; if the controls had not also been provoked to some extent, then we may not have activated the relevant brain related to the control of aggression in healthy individuals. This level of provocation also best separated controls from patients in previously completed behavioral data (unpublished). A no-provocation condition was chosen as a control task to avoid aggression provocation, while controlling for the visual, motor, and cognitive processes required for the task.
Prior to each testing session, subjects were instructed that the goal of the session was to earn as many points as possible, that the points would be exchanged for money, that the subject’s computer was connected to that of another participant in a different room who was also attempting to earn money, and that this other participant might take points from the subject; pressing button ‘A’ approximately 100-times earned the participant a point (10¢); pressing button ‘B’ 10-times subtracted a point from the (fictitious) other participant (the aggressive response); pressing button “C” would protect the subject from point subtractions for a period of time, but would not take points away from the “other participant.”
The subject can respond to a provocation by a) ignoring it and pressing Button “A” (“non-aggressive”), thereby accumulating points; b) pressing Button “B” and causing the “confederate” to lose points (“aggressive responding” which is retaliatory because the subject does not get “points” from the “confederate” with this option), or, c) pressing Button “C” to protect the him/her from point subtractions for a period of time. Pressing Button “B” is used as the measure of “aggression”. Since, the validity of the PSAP depends on the participant’s belief that he/she is playing with another person(49), he/she was asked questions about characteristics of the other participant after completing the task. Note that prior studies of the PSAP have employed multiple rounds, while we employed one round on each task day to match the uptake period for 18FDG(49).
On two separate occasions (1–4 weeks apart, “provoked” and “non-provoked” counterbalanced for order), each participant received 5mCi of 18FDG. The subject remained resting in a sound-attenuated, dimly-lit room for the 35-minute tracer-uptake period playing the PSAP. Following uptake, subjects were positioned in the PET scanner for a 45-minute data-acquisition period. PET scans were carried out as described elsewhere(6, 17, 50–52) (GE2048 head-dedicated scanner, resolution 4.5mm in plane, 5.0mm axially). Fifteen slices at 6.5-mm intervals were obtained in two sets to cover the entire brain. PET images were obtained in nanocuries/pixel and standardized as relative glucose metabolic rate (rGMR) by dividing each pixel by the mean value for the entire brain. Brain edges were visually traced on all MRI axial slices with inter-tracer reliability of 0.99.
Regions of Interest Approach
We assessed rGMR within 39 Brodmann areas (BAs) in each hemisphere by tracing coronal slices based on a digitized brain atlas with 33-coronal slice maps of BAs defined by microscopic examination, a technique detailed elsewhere(17,51–56). To assess the effect of provocation on rGMR, the dependent measure for PET analyses on task effect was expressed as difference scores (Provoked–Non-provoked) within each BA. Selected sets of BAs developed on a theoretical and anatomical basis were entered into an ANOVA (nested within regions, e.g., orbital: BA 11•12•47). Amygdala was hand-traced on coronal MRI sections as described previously(17,57).
Statistical Method
Behavioral ratings were entered into an ANOVA with the dependent variable as “B” button presses and diagnosis, sex and provocation condition as factors. PET results for the provoked–non-provoked conditions were analyzed with mixed-factorial ANOVA. For the ANOVAs, we report the multivariate F(Greenhouse-Geiser) from Statistica(58) to adjust probabilities for repeated-measure effects with more than two levels. Fisher’s LSD tests were used to follow-up significant interaction effects with diagnostic group. We examine only the frontal, sensory areas and cingulate BAs with nested ANOVA. ANOVAs with the dependent variable as rGMR (provoked–non-provoked) with group, sex, order, brain region, nested BAs, hemisphere and tissue type were conducted for frontal, sensory and cingulate cortex. The same analyses were repeated for the non-provocation condition. This approach, which provided tests of hypothesized group differences, helps minimize Type I errors involved with t-tests for each area, group contrast, and hemisphere. In a further effort, we only examine significant main effects for diagnostic group and interactions between diagnostic group and gray/white and hemisphere or within-region BA effects. To examine symptom correlates with rGMR, we used Pearson correlations, using Bonferonni correction for multiple comparisons.
Statistical Probability Mapping
We conducted whole brain statistical probability mapping to confirm our ROI findings and to explore brain regions not included in the ROI analysis. PET preprocessing involved: non-brain removal with FSL-BET(59), 12-parameter registration to the MNI (Montreal Neurological Institute, McGill University, Montreal, Canada) brain template with FSL FLIRT(60), spatial smoothing with a Gaussian smoothing kernel at 10mm FWHM (full width at half maximum), and intensity normalization (each voxel divided by the average value in the whole brain between Talairach z=−5mm to z=61mm). Image differences between the provoked and non-provoked condition were computed for each subject. Group t-tests were performed on these difference images between patients and controls. Voxel by voxel statistical maps were generated with FSL(www.fmrib.ox.ac.uk/fsl)(61) thresholded at t=1.67(p<0.05, 1-tailed) for display.
Results
Subjects
As expected, the BPD-IED group had significantly higher scores in affective lability, impulsivity, aggression and trait anger. The Axis I and Axis II co-morbidites are similar to those reported in the Collaborative Longitudinal Study of Personality Disorders study although with slightly low levels of co-morbidity(62). We believe that this is because we excluded subjects with current MDD, currently medicated or abusing drugs or alcohol.
Behavioral Data
Aggressive responding was expressed as retaliatory “B” button presses. A Group (HC, BPD-IED)×Sex(M, F)×Order(provoked-1st, provoked-2nd)×Condition(provoked, non-provoked) ANOVA revealed a main effect for diagnosis on aggressive responding (F(1,67)=6.83, p<0.01), with BPD-IED patients responding more aggressively than controls, consistent with our hypothesis. We also found a main effect of task condition, with both groups responding more aggressively to provocation than non-provocation, as expected (F(1,67)=14.53, p<0.001); however, we did not find a group by condition interaction (Figure 1). There was neither a significant group difference in total button presses (A+B+C) for the provoked or non-provoked condition, nor a significant effect for sex or order. There were no significant correlations between aggressive responding (“B” button presses: provoked–non-provoked) and clinical measures of anger or aggression in the HC or BPD-IED groups. However, state anger (r=0.45, p<0.05, corrected for multiple comparisons) correlated with “B” button presses during the non-provoked condition in the patient group but not in the control group. See Table S3 in Supplement 1 for full behavioral results.
Figure 1.
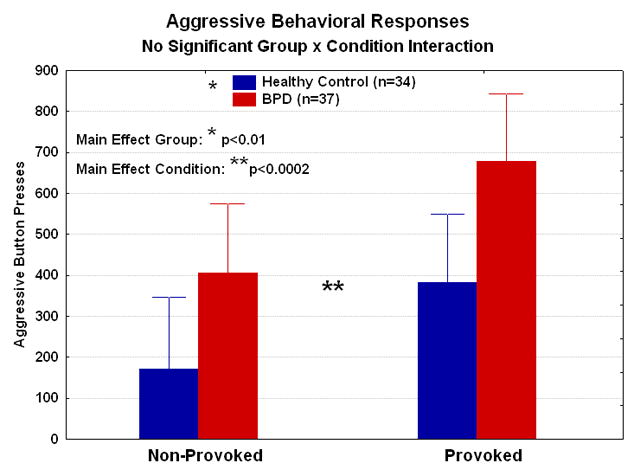
Mean behavioral performance for aggressive button presses is shown for the healthy controls and BPD-IED patients. Compared with the healthy controls, the BPD-IED patients pressed the button significantly more averaged across the provoked and non-provoked conditions. Averaged across the two diagnostic groups, there were significantly more button presses during the provoked than non-provoked condition.
PET Results: Provocation Effect
Prefrontal Cortex
A Group(HC, BPD-IED)×Sex(M, F)×Order(provoked-1st, provoked-2nd)×Region(anterior, medial, orbital, dorsolateral)×BA(3)×Matter(gray, white)×Hemisphere(R, L) ANOVA was performed to examine group differences in rGMR for the Provoked–Non-provoked condition within the anterior(BA 8•9•10), orbital(BA 11•12•47), medial(BA 32•25•24) and dorsolateral(BA 44•45•46) regions of frontal lobe. A significant group by frontal brain region interaction was detected (G-G:F=3.57, corrected df=(2.4,165.8), ε=0.79, p<0.05). HC showed significant decreases in rGMR in OFC; in contrast, BPD-IED patients showed increased rGMR in OFC. The opposite pattern was seen in anterior, medial and dorsolateral PFC. (Post-hoc t-tests: BPD-IED>HC in OFC, p<0.05) (Figure 2). There was no significant effect involving order or sex.
Figure 2.
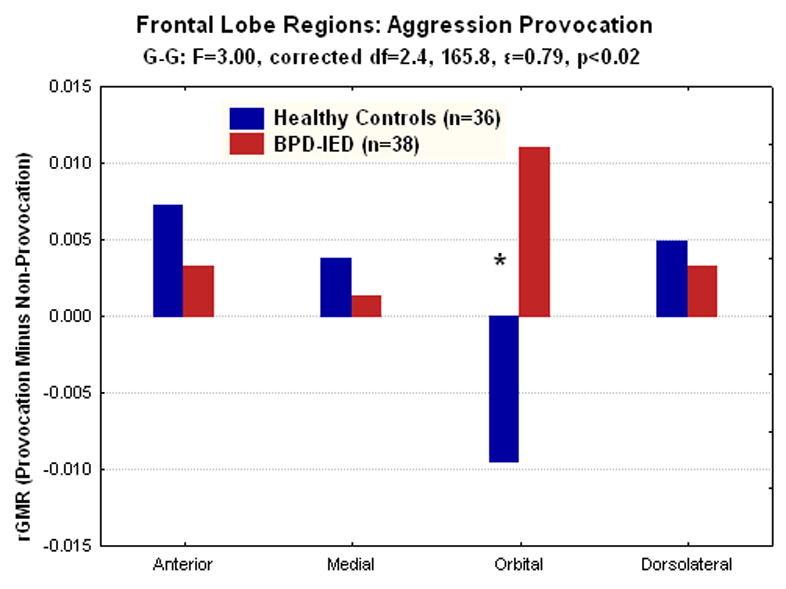
In an analysis of prefrontal regions, BPD-IED patients showed significantly more relative glucose metabolism (rGMR) in the orbital frontal cortex (OFC; BA11, 12, and 47) during the provoked compared with the non-provoked condition. In contrast, the healthy controls showed the opposite pattern in the OFC (*post-hoc tests, p<.02).
In order to examine the contribution of the non-provoked condition to the group differences in OFC found in response to provocation, a Group(HC, BPD-IED)×Sex(M, F)×BA(3)× Matter(gray, white)×Hemisphere(R, L)×Condition(provoked, non-provoked) ANOVA was performed for the orbital BAs. We found a significant group by provocation condition effect (G-G: F(1,70)=5.73, p<0.05), with differences most pronounced in the non-provoked rather than the provoked condition, although post-hoc t-tests on the individual conditions did not reveal significant differences in this finding (Figure 3). An exploratory analysis comparing BPD-IED patients with past PTSD (n=13, 4/13 current PTSD) compared to those without (n=25) to examine the effect of PTSD on our outcome measures revealed no significant group difference between BPD-IED±PTSD. Similarly, an exploratory analysis comparing BPD-IED patients with past MDD (n=23, 8/23 also with past PTSD) compared to those without (n=15, 5/15 with past PTSD) to examine the effect of past MDD on our outcome measures and found no significant group difference between BPD-IED±past MDD.
Figure 3.

In the orbital frontal cortex (OFC), there is a pattern of group differences in rGMR such that, in the non-provoke condition, healthy controls show significantly higher rGMR than BPD-IED patients and the opposite is true in the provoked condition. Post hoc tests for group differences are not significant for either the provoked or non-provoked condition in OFC.
Cingulate Gyrus
A Group(HC, BPD-IED)×Sex(M, F)×Order (provoked-1st, provoked-2nd)×Sex(M, F)× BA(25•24•31•23•29)×Matter(gray, white)×Hemisphere(R, L) ANOVA showed no significant effect involving group in cingulate cortex. Similarly, there was no significant difference for the presence of co-morbid PTSD or past MDD for cingulate cortex in response in provocation.
Sensory Areas
Since OFC appeared off-line at baseline, we explored the effect of provocation on sensory brain regions, exploring whether sensory areas would be most active in BPD-IED at baseline. We included occipital regions, parietal regions and amygdala (amygdala divided as previously described(17)). We conducted a Group(HC, BPD-IED)×Sex (M, F)×Region(Occipital, Parietal, Amygdala)×sub-region (BA 17•18; BA 41•42; amygdala:top•bottom)×Hemisphere (R, L) ANOVA on rGMR for provoked–non-provoked scores. We found a significant Group×Region interaction (G-G:F=4.45, corrected df=(1.4,89.5), ε=0.68, p<0.05) with HC increasing rGMR in occipital and parietal regions more with aggression provocation, but less in amygdala with provocation. BPD-IED patients showed the opposite pattern with significantly lower rGMR in occipital and parietal regions during provocation, but significantly higher rGMR in amygdala (Figure 4). To examine the contribution of the non-provoked condition, we did an ANOVA of sensory areas in the non-provoked condition, and found that in amygdala, like in OFC, the most robust group difference was in the non-provoked condition (Figures 5). Occipital and parietal BAs did not show this robust difference in the non-provoked condition.
Figure 4.
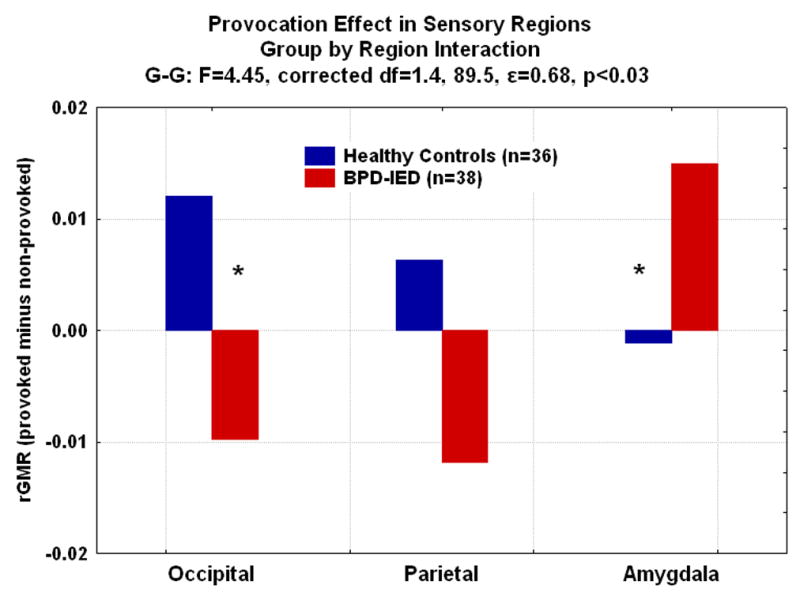
In an analysis of occipital cortex (BA 17,18), parietal cortex (BA 41,42); amygdala (top, bottom), BPD-IED patients showed significantly more relative glucose metabolism (rGMR) in amygdala than controls, while controls showed significantly higher rGMR in the occipital cortex during the provoked compared with the non-provoked condition (*post-hoc tests, p<.05).
Figure 5.
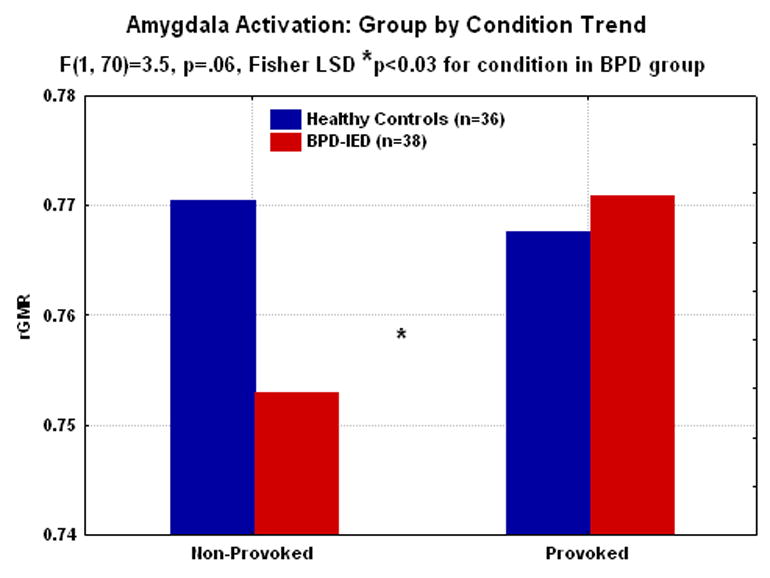
In the amygdala, collapsed across hemisphere, there is a trend level group by condition interaction with the BPD-IED group tending to show higher rGMR with provocation than controls. There is also a significant effect of condition in BPD-IEDs with the amygdala more active to provocation than non-provocation (*post-hoc tests, p<.05). Post hoc tests for group differences are not significant for either the provoked or non-provoked condition in amygdala.
Clinical correlations with ROIs
Correlations between the behavioral scores for aggressive behavior (“B” button presses: provoked–non-provoked) and affective lability, impulsivity, aggression and trait anger with rGMR in prefrontal brain regions for provoked–non-provoked conditions showed in HC, rGMR correlated with aggressive responding in left (r=0.50, p<0.01) and right medial (r=0.61, p<0.001), left orbital (r=0.39, p<0.05), left dorsolateral (r=0.36, p<0.05) PFC. Left OFC correlated inversely with self-reported aggression (r=−0.42, p<0.05). These correlations were absent in the BPD-IED group. In BPD-IED, aggressive responding correlated with right anterior PFC (r=0.34, p<0.05). Significant group differences for the above correlations were seen in left (p<0.01) and right (p<0.001) medial OFC and left dorsolateral PFC (p<0.05) with aggressive responding.
Non-provocation Analysis
Prefrontal Cortex
Similar ANOVAs as were done for the provoked–non-provoked conditions were also conducted on the non-provoked condition. A Group(HC, BPD-IED)×Sex(M, F)×order×Region (anterior, medial, orbital, dorsolateral)×BA(3)×Matter(gray, white)×Hemisphere(R, L) ANOVA was performed on rGMR for the non-provoked condition. No significant main or interaction effect involving group was detected.
Cingulate
Similar to our findings in the provoked–non-provoked condition, a Group(HC, BPD-IED)×Sex(M, F)×BA(25•24•31•23•29)×Matter(gray, white)×Hemisphere(R, L) ANOVA showed no significant effect involving group in the cingulate cortex.
Sensory Areas
A Group(HC, BPD-IED)×Sex(M, F)×Region(occipital, parietal, amygdala)×sub-region(BA 17•18; BA 41•42; amygdala:top•bottom)×Hemisphere(R, L) ANOVA on non-provoked rGMR showed no significant interaction involving group.
Of note, there was neither a main effect of sex nor any interaction involving sex that was significant for any of the ROI analyses, neither for the effect of provocation nor in the non-provoked condition.
Statistical Probability Mapping
Figure 6 shows a whole brain map for the double difference of BPD-IED–HC for provoked–non-provoked. Consistent with our ROI analysis, in BPD-IED rGMR increased more with provocation in OFC (extending more dorsally than the BAs included in our ROI analysis (shown in red→yellow in Figure 6)). In contrast, in HC rGMR increased in regions of occipital and parietal cortex, as well as some areas of dorsolateral and dorsomedial PFC with provocation (shown in dark blue→pale blue in Figure 6).
Figure 6. Statistical Probability Map for Double Difference of BPD-IED–Control for Provoked–Non-provoked.

Color bars show a gradient of thresholding such that the exploratory threshold of p<.01–0.001 is depicted in yellow and pale blue and a threshold consistent with replicating ROI analyses of a priori hypotheses on the same data shown in red and dark blue.
Discussion
The current study examined OFC and amygdala responsiveness to aggression provocation. Previous resting PET studies suggested that aggression is associated with OFC underactivity(27, 28, 63). These studies have led to a simplified model that OFC “puts the brakes” on amygdala and that decreased OFC activity promotes aggression. The present study is consistent with this model, in that we show lower OFC activity in BPD-IED patients than HC in the non-provoked condition, but extends the model by providing evidence that OFC has a more complex modulatory role on amygdala responsiveness(26).
In our study, BPD-IED patients showed a robust pattern of low amygdala and OFC activity in the non-provoked condition, with hyper-responsiveness of these regions during aggression provocation compared with controls. The only previous study explicitly testing aggression provocation showed, as we have, that healthy controls deactivate OFC in response to aggression provocation(32). That study also found that medial and dorsolateral PFC were activated during the explicit “cognitive control” of aggression. Anecdotally, our patients report becoming easily angered, especially in response to interpersonal slights. They describe feeling overwhelmed by anger, with no access to controlling their responses or considering the consequences of not controlling them. Our study provides a possible functional imaging correlate of that experience, with increased rGMR in amygdala and OFC with provocation, but not in the top-down control network seen in healthy individuals. OFC appeared to be acting in isolation within PFC in patients but not in controls. Perhaps BPD-IED patients cannot activate the cognitive controls regions to keep them on task, and are instead at the mercy of the limbic network of OFC and amygdala.
The PSAP is a social task in that the subject believes that he/she is playing with another individual. The rational choice is simply to avoid aggressive responding by pressing the “A” button, thereby gaining points/money. Pressing the “B” button is purely retaliative, providing no advantage to the subject. Unsurprisingly, controls largely avoided aggressive responses during non-provocation; when provoked, they responded somewhat aggressively, and activated top-down control brain regions, perhaps controlling that response. The correlation between the degree of activation of medial and dorsolateral PFC with aggressive responding could be viewed as supporting the notion that healthy subjects recruited top-down control regions to moderate their aggression. BPD-IED patients, in contrast, pressed the “B” button even when not attacked. Surprisingly, we found no clinical correlations between aggressive responding and clinical measures of aggression, with the only correlation surviving Bonferroni correction between aggressive responding and anger in the BPD-IED group when not provoked. This raises the possibility that aggressive behavior tapped into by this foreshortened version of the PSAP may be a non-pathological competitive aggression, and it is the presence of aggressive behavior when it is not appropriate (the non-provocation condition) might be most relevant for clinically problematic aggressive behavior.
Interestingly, we found no significant gender effect for any of our measures, including aggressive responding, rGMR in prefrontal brain regions, cingulate and sensory regions-including amygdala. This seems surprising since men engage in more violent behaviors than women(64), although women are slightly more frequently physically aggressive in intimate relationships(65). Our findings of a robust effect of group on aggressive responding and on the neural circuitry activated by aggression provocation but no effect of sex, suggest that the effect of the BPD-IED diagnosis may trump any gender effect on these outcome measures.
The strengths of our study include the novelty of our imaging task and the large sample of well-characterized currently medication-free BPD-IED patients. Also, our use of PET scanning rather than fMRI permitted us to examine OFC without susceptibility artifact. In addition, the PSAP task is particularly suited to PET imaging, since it involves a provocation of aggressive behavior, during which the subjects move quite a bit; PET imaging, unlike fMRI, is not disrupted by subject motion since the 18FDG uptake period precedes image acquisition. Our study does, however, have a number of limitations. First, we did not see a group by provocation condition interaction in our behavioral result. BPD-IED patients responded more aggressively in both conditions. This raises the possibility that the under-activity of OFC and amygdala in BPD-IED patients compared with controls during non-provocation arises from the fact that BPD-IED patients were already provoked to aggression, and therefore showed a normal decrease in rGMR in OFC to aggression provocation. This seems unlikely since BPD-IED patients increased rGMR in these regions when provoked to even more aggression. Another possible interpretation is that, since both groups heightened aggressive responding equally to provocation, perhaps we had reached a ceiling effect for provocation, with the BPD-IED group simply starting at a higher level. We did not measure subjective experience or physiological arousal during the game, which would have helped to illuminate our results. Finally, another limitation of our study is that our BPD-IED patients had a number of co-morbid diagnoses, consistent with the rate reported by others(62). While we could not test for the effect of each of these diagnoses on our findings, we did find that BPD patients with past MDD or past or present PTSD did not differ significantly from those without such co-morbidity.
Supplementary Material
Acknowledgments
This work was supported by the James J. Peters VA Medical Center and by a grant to Dr. New from the National Institutes of Health (1-R01-MH067918-01) and to Dr. Hazlett (1-R01-MH07911) and by (5-M01 RR00071) for the Mount Sinai General Clinical Research Center from the National Center for Research Resources, at the NIH.
Financial Disclosures: Antonia New, Erin Hazlett, Randall Newmark, Jane Zhang, Joseph Triebwasser, David Meyerson, Sophie Lazarus, Roanna Trisdorfer, Kim E. Goldstein, Marianne Goodman, Janine Flory and Larry Siever reported no biomedical financial interests or potential conflicts of interest. Harold Koenigsberg has an investigator initiated grant from Ortho McNeil Janssen for work unrelated to the present study. Monte Buchsbaum has an investigator initiated grant from Lundbeck for work unrelated to this project.
Footnotes
Publisher's Disclaimer: This is a PDF file of an unedited manuscript that has been accepted for publication. As a service to our customers we are providing this early version of the manuscript. The manuscript will undergo copyediting, typesetting, and review of the resulting proof before it is published in its final citable form. Please note that during the production process errors may be discovered which could affect the content, and all legal disclaimers that apply to the journal pertain.
References
- 1.Porcerelli JH, Cogan R, Hibbard S. Personality characteristics of partner violent men: a Q-sort approach. J Personal Disord. 2004;18(2):151–62. doi: 10.1521/pedi.18.2.151.32776. [DOI] [PubMed] [Google Scholar]
- 2.Sanislow CA, Grilo CM, McGlashan TH. Factor analysis of the DSM-III-R borderline personality disorder criteria in psychiatric inpatients. Am J Psychiatry. 2000;157(10):1629–33. doi: 10.1176/appi.ajp.157.10.1629. [DOI] [PubMed] [Google Scholar]
- 3.Sanislow CA, Grilo CM, Morey LC, Bender DS, Skodol AE, Gunderson JG, et al. Confirmatory factor analysis of DSM-IV criteria for borderline personality disorder: findings from the collaborative longitudinal personality disorders study. Am J Psychiatry. 2002;159(2):284–90. doi: 10.1176/appi.ajp.159.2.284. [DOI] [PubMed] [Google Scholar]
- 4.Tebartz van Elst L, Hesslinger B, Thiel T, Geiger E, Haegele K, Lemieux L, et al. Frontolimbic brain abnormalities in patients with borderline personality disorder: a volumetric magnetic resonance imaging study. Biol Psychiatry. 2003;54(2):163–71. doi: 10.1016/s0006-3223(02)01743-2. [DOI] [PubMed] [Google Scholar]
- 5.Hazlett EA, New AS, Newmark R, Haznedar MM, Lo JN, Speiser LJ, et al. Reduced anterior and posterior cingulate gray matter in borderline personality disorder. Biol Psychiatry. 2005;58(8):614–23. doi: 10.1016/j.biopsych.2005.04.029. [DOI] [PubMed] [Google Scholar]
- 6.New AS, Hazlett EA, Buchsbaum MS, Goodman M, Reynolds D, Mitropoulou V, et al. Blunted prefrontal cortical 18fluorodeoxyglucose positron emission tomography response to meta-chloropiperazine in impulsive aggression. Arch Gen Psychiatry. 2002;59(7):621–629. doi: 10.1001/archpsyc.59.7.621. [DOI] [PubMed] [Google Scholar]
- 7.Soloff PH, Meltzer CC, Greer PJ, Constantine D, Kelly TM. A fenfluramine-activated FDG-PET study of borderline personality disorder. Biol Psychiatry. 2000;47:540–547. doi: 10.1016/s0006-3223(99)00202-4. [DOI] [PubMed] [Google Scholar]
- 8.Chanen AM, Velakoulis D, Carison K, Gaunson K, Wood SJ, Yuen HP, et al. Orbitofrontal, amygdala and hippocampal volumes in teenagers with first-presentation borderline personality disorder. Psychiatry Res. 2008;163(2):116–25. doi: 10.1016/j.pscychresns.2007.08.007. [DOI] [PubMed] [Google Scholar]
- 9.Goyer PF, Andreason PJ, Semple WE, Clayton AH, King AC, Compton-Toth BA, et al. Positron-Emission-Tomography and personality disorders. Neuropsychopharmacology. 1994;10(1):21–28. doi: 10.1038/npp.1994.3. [DOI] [PubMed] [Google Scholar]
- 10.Soloff PH, Meltzer CC, Becker C, Greer PJ, Kelly TM, Constantine D. Impulsivity and prefrontal hypometabolism in borderline personality disorder. Psychiatry Res. 2003;123(3):153–63. doi: 10.1016/s0925-4927(03)00064-7. [DOI] [PubMed] [Google Scholar]
- 11.De La Fuente JM, Goldman S, Stanus E, Vizuete C, Morlan I, Bobes J, et al. Brain glucose metabolism in borderline personality disorder. J Psychiatr Res. 1997;31(5):531–41. doi: 10.1016/s0022-3956(97)00001-0. [DOI] [PubMed] [Google Scholar]
- 12.Schmahl CG, Elzinga BM, Vermetten E, Sanislow C, McGlashan TH, Bremner JD. Neural correlates of memories of abandonment in women with and without borderline personality disorder. Biol Psychiatry. 2003;54(2):142–51. doi: 10.1016/s0006-3223(02)01720-1. [DOI] [PubMed] [Google Scholar]
- 13.Schmahl CG, Vermetten E, Elzinga BM, Bremner JD. A positron emission tomography study of memories of childhood abuse in borderline personality disorder. Biol Psychiatry. 2004;55(7):759–65. doi: 10.1016/j.biopsych.2003.11.007. [DOI] [PubMed] [Google Scholar]
- 14.Minzenberg MJ, Fan J, New AS, Tang CY, Siever LJ. Fronto-limbic dysfunction in response to facial emotion in borderline personality disorder: an event-related fMRI study. Psychiatry Res. 2007;155(3):231–43. doi: 10.1016/j.pscychresns.2007.03.006. [DOI] [PMC free article] [PubMed] [Google Scholar]
- 15.Coccaro EF, McCloskey MS, Fitzgerald DA, Phan KL. Amygdala and orbitofrontal reactivity to social threat in individuals with impulsive aggression. Biol Psychiatry. 2007;62(2):168–78. doi: 10.1016/j.biopsych.2006.08.024. [DOI] [PubMed] [Google Scholar]
- 16.Silbersweig D, Clarkin JF, Goldstein M, Kernberg OF, Tuescher O, Levy KN, et al. Failure of frontolimbic inhibitory function in the context of negative emotion in borderline personality disorder. Am J Psychiatry. 2007;164(12):1832–41. doi: 10.1176/appi.ajp.2007.06010126. [DOI] [PubMed] [Google Scholar]
- 17.New AS, Hazlett EA, Buchsbaum MS, Goodman M, Mitelman SA, Newmark R, et al. Amygdala-Prefrontal Disconnection in Borderline Personality Disorder. Neuropsychopharmacology. 2007;32(7):1629–40. doi: 10.1038/sj.npp.1301283. [DOI] [PubMed] [Google Scholar]
- 18.Pribram KH, Bragshaw M. Further analysis of the temporal lobe syndrome utilizing frontotemporal ablation. J Comp Neurol. 1953;99:347–375. doi: 10.1002/cne.900990208. [DOI] [PubMed] [Google Scholar]
- 19.Butter CM, Snyder DR, McDonald JA. Effects of orbital frontal lesions on aversive and aggressive behaviors in rhesus monkeys. J Comp Physiol Psychol. 1970;72(1):132–44. doi: 10.1037/h0029303. [DOI] [PubMed] [Google Scholar]
- 20.Butter CM, Snyder DR. Alterations in aversive and aggressive behaviors following orbital frontal lesions in rhesus monkeys. Acta-Neurobiol-Exp-Warsz. 1972;2(2):525–565. [PubMed] [Google Scholar]
- 21.Machado CJ, Bachevalier J. The impact of selective amygdala, orbital frontal cortex, or hippocampal formation lesions on established social relationships in rhesus monkeys (Macaca mulatta) Behav Neurosci. 2006;120(4):761–86. doi: 10.1037/0735-7044.120.4.761. [DOI] [PubMed] [Google Scholar]
- 22.Luria A. Higher Cortical Functions in Man. New York: Basic Books; 1980. [Google Scholar]
- 23.Damasio H, Grabowski T, Frank R, Galaburda A, Damasio AR. The return of Phineas Gage: clues about the brain from the skull of a famous patient. Science. 1994;264:1102–1105. doi: 10.1126/science.8178168. [DOI] [PubMed] [Google Scholar]
- 24.Grafman J, Schwab K, Warden D, Pridgen A, Brown H, Salazar A. Frontal lobe injuries, violence, and aggression: A report of the Vietnam head injury study. Neurology. 1996;46(5):1231–1238. doi: 10.1212/wnl.46.5.1231. [DOI] [PubMed] [Google Scholar]
- 25.Davidson RJ, Putnam KM, Larson CL. Dysfunction in the neural circuitry of emotion regulation - a possible prelude to violence. Science. 2000;289:591–594. doi: 10.1126/science.289.5479.591. [DOI] [PubMed] [Google Scholar]
- 26.Blair RJ. The roles of orbital frontal cortex in the modulation of antisocial behavior. Brain Cogn. 2004;55(1):198–208. doi: 10.1016/S0278-2626(03)00276-8. [DOI] [PubMed] [Google Scholar]
- 27.Raine A, Buchsbaum MS, Stanley J, Lottenberg S, Abel L, Stoddard J. Selective reductions in prefrontal glucose metabolism in murderers. Biol Psychiatry. 1994;36(6):365–373. doi: 10.1016/0006-3223(94)91211-4. [DOI] [PubMed] [Google Scholar]
- 28.Raine A, Buchsbaum M, LaCasse L. Brain abnormalities in murderers indicated by positron emission tomography. Biol Psychiatry. 1997;42(6):495–508. doi: 10.1016/S0006-3223(96)00362-9. [DOI] [PubMed] [Google Scholar]
- 29.George DT, Rawlings RR, Williams WA, Phillips MJ, Fong G, Kerich M, et al. A select group of perpetrators of domestic violence: evidence of decreased metabolism in the right hypothalamus and reduced relationships between cortical/subcortical brain structures in position emission tomography. Psychiatry Res. 2004;130(1):11–25. doi: 10.1016/S0925-4927(03)00105-7. [DOI] [PubMed] [Google Scholar]
- 30.Kimbrell TA, George MS, Parekh PI, Ketter TA, Podell DM, Danielson AL, et al. Regional brain activity during transient self-induced anxiety and anger in healthy adults. Biol Psychiatry. 1999;46(4):454–65. doi: 10.1016/s0006-3223(99)00103-1. [DOI] [PubMed] [Google Scholar]
- 31.Dougherty DD, Shin LM, Alpert NM, Pitman RK, Orr SP, Lasko M, et al. Anger in healthy men: a PET study using script-driven imagery. Biol Psychiatry. 1999;46(4):466–72. doi: 10.1016/s0006-3223(99)00063-3. [DOI] [PubMed] [Google Scholar]
- 32.Pietrini P, Guazzelli M, Vasso G, Jaffe K, Grafman J. Neural correlates of imaginal aggressive behavior assessed by positron immision tomography in healthy subjects. Am J Psychiatry. 2000;157(11):1772–1781. doi: 10.1176/appi.ajp.157.11.1772. [DOI] [PubMed] [Google Scholar]
- 33.Cherek DR, Moeller FG, Dougherty DM, Rhoades H. Studies of violent and non-violent male parolees: II. Laboratory and psychometric measurements of impulsivity. Biol Psychiatry. 1997;41(5):523–529. doi: 10.1016/s0006-3223(96)00426-x. [DOI] [PubMed] [Google Scholar]
- 34.Coccaro EF, Kavoussi R, Berman M, Lish J. Intermittent explosive disorder-revised: development, reliability, and validity of research criteria. Compr Psychiatry. 1998;39:368–376. doi: 10.1016/s0010-440x(98)90050-5. [DOI] [PubMed] [Google Scholar]
- 35.First M, Spitzer R, Gibbon M, Williams J. New York Biometrics Research. New York State Psychiatric Institute; 1996. Structured Clinical Interview for Axis I Disorders-Patient Edition. [Google Scholar]
- 36.Pfohl B, Blum N, Zimmerman M. Structured Clinical Interview for DSM-IV. Washington, DC: American Psychiatric Press; 1996. [Google Scholar]
- 37.Swartz M, Blazer D, George L, Winfield I. Estimating the prevalence of borderline personality disorder in the community. J Pers Disor. 1990;4:257–272. [Google Scholar]
- 38.Liberzon I, Martis B. Neuroimaging studies of emotional responses in PTSD. Ann N Y Acad Sci. 2006;1071:87–109. doi: 10.1196/annals.1364.009. [DOI] [PubMed] [Google Scholar]
- 39.Drevets WC. Functional anatomical abnormalities in limbic and prefrontal cortical structures in major depression. Prog Brain Res. 2000;126:413–31. doi: 10.1016/S0079-6123(00)26027-5. [DOI] [PubMed] [Google Scholar]
- 40.Coccaro EF. Intermittent Explosive Disorder. In: Coccaro EF, editor. Aggression: Psychiatric Assessment and Treatment. Marcel Dekker Inc; New York: 2003. pp. 149–199. [Google Scholar]
- 41.McCloskey MS, Berman ME, Noblett KL, Coccaro EF. Intermittent explosive disorder-integrated research diagnostic criteria: convergent and discriminant validity. J Psychiatr Res. 2006;40(3):231–42. doi: 10.1016/j.jpsychires.2005.07.004. [DOI] [PubMed] [Google Scholar]
- 42.Barratt ES. Factor analysis of some psychometric measures of impulsiveness and anxiety. Psychol Rep. 1965;16:547–554. doi: 10.2466/pr0.1965.16.2.547. [DOI] [PubMed] [Google Scholar]
- 43.Harvey P, Greenberg B, Serper M. The affective lability scales: development reliability and validity. J Clin Psychol. 1989;45(5):786–93. doi: 10.1002/1097-4679(198909)45:5<786::aid-jclp2270450515>3.0.co;2-p. [DOI] [PubMed] [Google Scholar]
- 44.Beck AT, Ward CH, Mendelson M, Mock J, Erbaugh J. An inventory for measuring depression. Arch Gen Psychiatry. 1961;4:561–71. doi: 10.1001/archpsyc.1961.01710120031004. [DOI] [PubMed] [Google Scholar]
- 45.Spielberger C. Professional Manual. Odessa, Florida: Psychological Assessment Resources; 1988. State-Trait Anger Expression Inventory, Research Edition. [Google Scholar]
- 46.Buss AH, Durkee A. An inventory for assessing different kinds of hostility. J Consult Psychol. 1957;21:343–348. doi: 10.1037/h0046900. [DOI] [PubMed] [Google Scholar]
- 47.Buss A, Perry M. The Aggression Questionnaire. J Pers Social Psychology. 1992;63(3):452–9. doi: 10.1037//0022-3514.63.3.452. [DOI] [PubMed] [Google Scholar]
- 48.Oldfield RC. The assessment and analysis of handedness: the Edinburgh inventory. Neuropsychologia. 1971;9(1):97–113. doi: 10.1016/0028-3932(71)90067-4. [DOI] [PubMed] [Google Scholar]
- 49.Cherek DR, Moeller FG, Schnapp W, Dougherty DM. Studies of violent and nonviolent male parolees: I. Laboratory and psychometric measurements of aggression. Biol Psychiatry. 1997;41(5):514–22. doi: 10.1016/s0006-3223(96)00059-5. [DOI] [PubMed] [Google Scholar]
- 50.Haznedar M, Buchsbaum MS, Metzer M, Solimando A, Speigel-Cohen J, Hollander E. Anterior cingulate gyrus volume in glucose metabolism in autistic disorder. Am J Psychiatry. 1997;154(8):1043–5. doi: 10.1176/ajp.154.8.1047. [DOI] [PubMed] [Google Scholar]
- 51.Hazlett EA, Buchsbaum MS, Hsieh P, Haznedar MM, Platholi J, LiCalzi EM, et al. Regional glucose metabolism within cortical Brodmann areas in healthy individuals and autistic patients. Neuropsychobiology. 2004;49(3):115–25. doi: 10.1159/000076719. [DOI] [PubMed] [Google Scholar]
- 52.Buchsbaum MS, Haznedar MM, Aronowitz J, Brickman AM, Newmark RE, Bloom R, et al. FDG-PET in never-previously medicated psychotic adolescents treated with olanzapine or haloperidol. Schizophr Res. 2007;94(1–3):293–305. doi: 10.1016/j.schres.2007.04.027. [DOI] [PubMed] [Google Scholar]
- 53.Hazlett EA, Buchsbaum MS, Jeu L, Nenadic I, Fleischman MB, Shihabuddin L, et al. Hyporfrontality in unmedicated schizophrenia patients studied with PET during performance of a serial verbal learning task. Schizophr Res. 2000;43(1):33–46. doi: 10.1016/s0920-9964(99)00178-4. [DOI] [PubMed] [Google Scholar]
- 54.Buchsbaum MS, Hollander E, Haznedar MM, Tang CY, Spiegel-Cohen J, Wei TC, et al. Effect of fluoxetine on regional cerebral metabolism in autistic spectrum disorders: a pilot study. Int J Neuropsychopharmacol. 2001;4(2):119–25. doi: 10.1017/S1461145701002280. [DOI] [PubMed] [Google Scholar]
- 55.Buchsbaum MS, Nenadic I, Hazlett EA, Spiegel-Cohen J, Fleischman MB, Akhavan A, et al. Differential metabolic rates in prefrontal and temporal Brodmann areas in schizophrenia and schizotypal personality disorder. Schizophr Res. 2002;54(1–2):141–150. doi: 10.1016/s0920-9964(01)00361-9. [DOI] [PubMed] [Google Scholar]
- 56.Mitelman SA, Buchsbaum MS, Brickman AM, Shihabuddin L. Cortical intercorrelations of frontal area volumes in schizophrenia. Neuroimage. 2005;27(4):753–70. doi: 10.1016/j.neuroimage.2005.05.024. [DOI] [PubMed] [Google Scholar]
- 57.Haznedar M, Buchsbaum MS, Wei T, Hof PR, Cartwright C, Bienstock C, et al. Limbic circuitry in patients with autism spectrum disorders studied with positron emission tomography and magnetic resonance imaging. Am J Psychiatry. 1994–2001;157(12) doi: 10.1176/appi.ajp.157.12.1994. [DOI] [PubMed] [Google Scholar]
- 58.StatSoft I. Distributor: StatSoft Inc. Tulsa, OK: 2001. STATISTICA (data analysis software system), version 6. www.statsoft.com. [Google Scholar]
- 59.Smith SM. Fast robust automated brain extraction. Hum Brain Mapp. 2002;17(3):143–55. doi: 10.1002/hbm.10062. [DOI] [PMC free article] [PubMed] [Google Scholar]
- 60.Jenkinson M, Bannister P, Brady M, Smith S. Improved optimization for the robust and accurate linear registration and motion correction of brain images. Neuroimage. 2002;17(2):825–41. doi: 10.1016/s1053-8119(02)91132-8. [DOI] [PubMed] [Google Scholar]
- 61.Smith SM, Jenkinson M, Woolrich MW, Beckmann CF, Behrens TE, Johansen-Berg H, et al. Advances in functional and structural MR image analysis and implementation as FSL. Neuroimage. 2004;23 Suppl 1:S208–19. doi: 10.1016/j.neuroimage.2004.07.051. [DOI] [PubMed] [Google Scholar]
- 62.McGlashan TH, Grilo CM, Skodol AE, Gunderson JG, Shea MT, Morey LC, et al. The Collaborative Longitudinal Personality Disorders Study: baseline Axis I/II and II/II diagnostic co-occurrence. Acta Psychiatr Scand. 2000;102(4):256–64. doi: 10.1034/j.1600-0447.2000.102004256.x. [DOI] [PubMed] [Google Scholar]
- 63.Volkow ND, Tancredi L. Neural substrates of violent behavior: A preliminary study with positron emission tomography. Br J Psychiatry. 1987;151:668–673. doi: 10.1192/bjp.151.5.668. [DOI] [PubMed] [Google Scholar]
- 64.Marcus RF. Cross-sectional study of violence in emerging adulthood. Aggress Behav. 2008;35(2):188–202. doi: 10.1002/ab.20293. [DOI] [PubMed] [Google Scholar]
- 65.Swan SC, Gambone LJ, Caldwell JE, Sullivan TP, Snow DL. A review of research on women’s use of violence with male intimate partners. Violence Vict. 2008;23(3):301–14. doi: 10.1891/0886-6708.23.3.301. [DOI] [PMC free article] [PubMed] [Google Scholar]
Associated Data
This section collects any data citations, data availability statements, or supplementary materials included in this article.