Abstract
Few studies have examined short term responses to the different contents of carbohydrate or fat in the meal, although long term effects of the high fat meal have been considered as compound risk factor for metabolic disorders. The aim of this study was to investigate the postprandial changes of plasma glucose, insulin and lipids upon intakes of high carbohydrate or high fat meal in young healthy women. Subjects were randomly assigned to either the high carbohydrate meal (HCM, 75% carbohydrate, n=13) or the high fat meal (HFM, 60% fat, n=12) groups. The meals were prepared as isocaloric typical Korean menu. Blood samples were obtained prior to and 30, 60, 90, 120, 180 and 240 minute after the meal. There were no significant differences on fasting blood parameters including glucose, insulin, lipids concentrations between the groups prior to the test. The HCM had higher blood glucose and insulin concentrations, reached the peak at 30 min and maintained for 240 min compared to the HFM (P<0.05). The HFM had higher plasma triglyceride (TG) and free fatty acid (FFA) concentrations, reached the peak at 120 min and maintained for 240 min compared to the HCM (P<0.05). It is concluded that macronutrients content in the meal may be an important determinant of postprandial substrate utilization in healthy women.
Keywords: High carbohydrate meal, high fat meal, nutrient metabolism, insulin, kinetics
Introduction
Metabolic changes associated with ingestion of different contents of macronutrients in a diet may contribute to the development of diseases including type 2 diabetes, cardiovascular disease (CVD) and obesity (Mcgregor & Lee, 1995; Sargrad et al., 2005; Shai et al., 2008). Low carbohydrate diets (for a decrease of 90 g/d) have been suggested to be beneficial in the treatment of the metabolic syndrome (Volek & Feinman, 2005). One meta-analysis showed that low carbohydrate diet that provided less than 45% of energy from carbohydrates resulted in good glycemic control within 6 months when it was substituted for a conventional high carbohydrate diet in patients with type 2 diabetes (Gougeon et al., 2006).
Altered contents of carbohydrate or fat in the meal affect the hepatic enzymes that metabolize carbohydrate or fat as substrates (acyl-CoA synthetase, carnitine palmitoyl-transferase-1 and acetyl-CoA carboxylase) in animal study (Ryu & Cha, 2003). Clinical studies support that diets rich in carbohydrate can lead to elevation in fasting plasma triglyceride (TG) as a result of hepatic very low density lipoprotein (VLDL) and chylomicron remnants accumulation due to altered lipoprotein secretion and/or clearance (Lopez-Miranda et al., 2007; Park et al., 1999). In addition, dietary carbohydrates may affect insulin action, at least in part, via alterations in plasma free fatty acids (Coulston et al., 1983).
The extent and kinetics of such postprandial changes are highly variable and modulated by numerous factors such as dietary patterns, meal composition and several lifestyle conditions (physical activity, tobacco use) (Lopez-Miranda et al., 2007).
Although a few studies reported influences of typical Korean diet on postprandial macronutrient metabolism in normal subjects (Yoon & Kim, 1998) or diabetic patients (Kwon & Kim, 2003), blood kinetics associated with different macronutrients composition in the meal had not been clearly determined in healthy Korean women.
In the present study, we compared the kinetic effects between isoenergetic high carbohydrate and high fat meals on blood glucose, insulin and lipids in normoglycemic and normolipidemic Korean women. One of the diets was higher in carbohydrate (75% vs usual 55-70%), the other higher in fat (61% vs usual 15-25%) and both were similar in protein, than the acceptable macronutrient distribution ranges in Korea.
Subjects and Methods
The protocol for this clinical research was reviewed by the Institutional Review Board (IRB) at the Kyung Hee University Medical Center (Seoul, Korea).
Sample
Healthy young women were recruited on the university and hospital employee announcement boards. Eligibility criteria included willingness to participate the study protocol, and understanding and signing of informed consent; being diagnosed as normal weight (BMI<23 kg/m2), fasting blood glucose concentrations of less than 100 mg per 100 ml, no report of abnormal blood glucose level within the last half year; and being aged over 20 years.
Exclusion criteria included any serious complicated diseases and medication. Thirty subjects were screened and enrolled, however, 5 subjects dropped out because of personal and technical problems. The final number of study subjects was 25.
Using a stratified randomization procedure, thirteen subjects were assigned to the high carbohydrate meal (HCM) group, twelve to the high fat meal (HFM) group. Subjects were maintained fasting state for 12 h before they ingested test diets. Severe physical activity and heavy drink of alcohol, caffeine, green tea or supplements were not allowed before the study.
Test meals
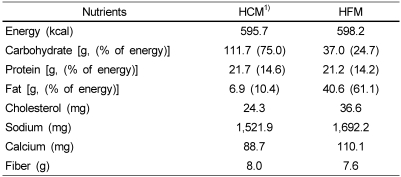
Two test meals as the typical Korean menu were prepared by a certified cook; steamed-rice, mushroom soup with soy paste, Deonjang, grilled marinated-pork with pepper paste, Gochujang, vegetable salad with boiled egg white, and Kimchi. Total energy provided by each test meal was approximately same as 600 Kcal (Table 1). Carbohydrate and fat modification consisted of a meal based on the amount of steamed-rice and salad dressing. Each contained 15% of calories from protein. The high carbohydrate meal composed of 111.7 grams of carbohydrate (75.0% of calorie derived from CHO) and high fat meal composed of 40.6 grams of fat (61.1% of calorie derived from fat) (Table 1). The subjects were advised to consume each meal over a 15 min period.
Table 1.
Composition of the test meals
1)HCM : High carbohydrate meal group and HFM : High fat meal group
Measurements
Body weights were measured on a calibrated electronic scale. Body composition was measured by bioelectrical impedance analyzer (Inbody 4.0, Korea). Habitual intakes of nutrients and the ratios of carbohydrate: protein: fat of all subjects were estimated by 3-d food records using CAN Pro version 3.0 (Computer aided nutritional analysis program, Korean Nutrition Society, 2005).
Blood pressure was measured by a standard electronic device (FT500, Korea). Concentrations of blood glucose, plasma insulin, triglyceride and free fatty acids were determined on the fasting, 30, 60, 90, 120, and 240-min blood samples. Blood glucose, triglyceride, plasma fatty acids were determined enzymatically using a Bayer kit (Bayer, USA). Serum insulin was analyzed with a radioimmunoassay kit (Diagnostic products Co.). An estimation of insulin resistance was calculated using the homeostasis model analysis-insulin resistance (HOMA-IR) using the formula: glucose (mmol/L)×[insulin (µU/L)/22.5] (Mattews et al., 1985).
We used the modified quantitative insulin sensitivity check index [QUICKI; 1 / (log(fasting insulin µU/mL) + log(fasting glucose mg/dL)] (Katz et al., 2000; Laaksonen et al., 2005) which was measured from the fasting blood samples that were taken at the beginning of the blood kinetics. As a measure of early phase insulin secretion, the modified insulinogenic index (IGI) was calculated as the ratio of the increment of serum insulin 30 min after the first meal ingestion, to blood glucose concentration 30 min the first meal ingestion after divided by the corresponding increment in glucose [(30 min insulin - fasting insulin) / 30 min glucose] (Wareham et al., 1995).
Statistical analysis
All statistical analyses were conducted using the SAS software package (Version 9.1, SAS Inc., Cary, NC). Continuous variables were presented as mean and standard deviation. Categorical variables were presented as absolute and relative frequencies. The chi-square test was employed to examine the effects of dietary diversity on categorical variables, and continuous variables were compared using the t-test. Statistical significance was accepted within P<0.05.
Results
Demographic characteristics of the subjects
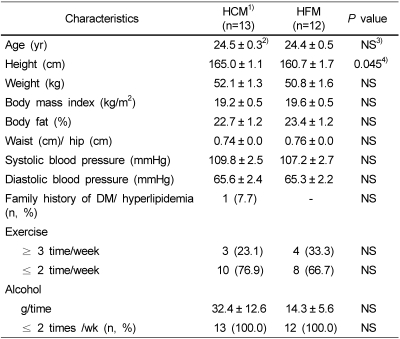
There were no significant differences on the anthropometric measures between the HCM group and the HFM group except the height as shown in Table 2. Majority of the subjects exercised less than 2 times per week (76.9% of HCM and 66.7% of HFM) and all of the subjects drank alcohol less than 2 times per week (100% of each group).
Table 2.
Baseline demographic parameters of the subjects
1)HCM: High carbohydrate meal group and HFM: High fat meal group
2)Values are mean ± SE.
3)NS: Not significant
4)Significantly different at p<0.05 by independent t-test.
Habitual intake of nutrients
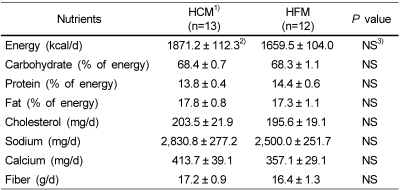
The daily intake of energy and other nutrients at baseline did not differ significantly between the groups as shown in Table 3. In detail, their average usual diet consisted of 68% carbohydrate, 15% protein and 17% fat, which were within the range of Korean dietary composition recommendation, 55-70% carbohydrate, 15-20% protein and 15-25% fat. Mean total energy consumption in current study participants was 1780.2 kcal/d, which does not meet 2,100 kcal/d, the estimated energy requirements (EER) of the Korean Dietary Reference Intake (KDRI) value for 20-y-old women. The groups had no significant differences in food habits such as meal speed, regularity of dietary intake, frequency of daily snack, kinds of snacks, and frequency of eating out (data not shown).
Table 3.
Habitual energy and nutrients intake of the subjects at baseline
1)HC: High carbohydrate meal group and HF: High fat meal group
2)Values are mean ± SE.
3)NS: Not significant
Clinical parameters
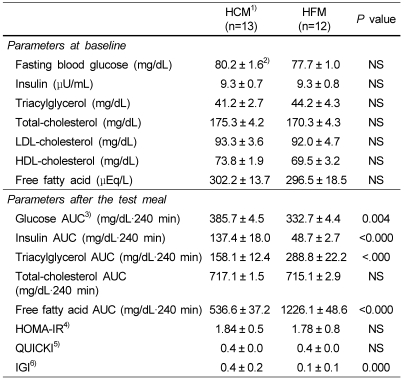
Fasting plasma levels of glucose, insulin, triglyceride (TG), and lipoproteins at baseline were all in the reference ranges and not significantly different between the groups as shown in Table 4. After consumption of test meal, relatively higher areas under the curve (AUC) for glucose and insulin were shown in the HCM group than those in the HFM group (P<0.01) (Table 4). No difference was shown for total cholesterol (TC) AUC, however, TG AUC and free fatty acid (FFA) AUC were significantly greater after consumption of HFM (P<0.01). HOMA-IR and the QUICKI insulin sensitivity index did not differ significantly between the groups (Table 4). The IGI was greater in the HCM than in the HFM (P<0.01).
Table 4.
Clinical measurements of the subjects
1)HCM: High carbohydrate meal group and HFM: High fat meal group
2)Values are mean ± SE.
3)AUC : Area under the curve
4)HOMA-IR : glucose (mmol/L) × [insulin (µU/L)/22.5]
5)Quantitative insulin sensitivity check index:1/(log(fasting insulin µU/mL)+ log (fasting glucose mg/dL)]
6)Isulinogenic index: [(30 min insulin - fasting insulin) / 30 min glucose]
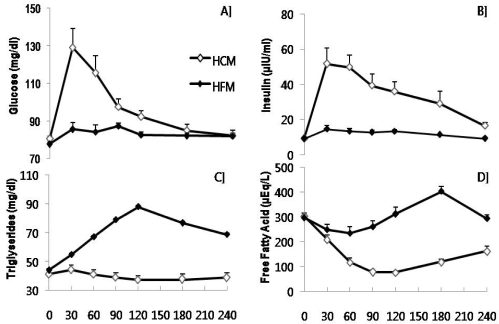
Fig. 1 shows that the HCM group had much higher blood glucose responses at individual time points during the 4 h compared with the HFM group (P<0.01). Similarly, the relative changes in serum insulin responses after consumption of two different test meals were differed significantly between the groups (P<0.01). On the contrary, the blood responses of TG and FFA during 240 min were greater in the HFM group than in the HCM group (P<0.01). No significantly different responses in the serum concentrations of total cholesterol (TC), LDL- and HDL-cholesterol between the groups were presented (Data not shown).
Fig. 1.
Kinetics of A] glucose, B] insulin, C] triglyceride and D] free fatty acids after taking high carbohydrate or high fat meals in healthy young subjects. HCM : High carbohydrate meal group and HFM : High fat meal group. All values at 30, 60, 120, 180 and 240 min after taking each test meal were significantly different at P<0.05.
Discussion
Since most studies reported moderate- or long-term effects of different composition of macronutrients in the diet rather than the acute effects on blood kinetics, it is not easy to discuss our results comparing with previous studies (Coulston et al., 1983; Gougeon et al., 2006; Laaksonen et al., 2005, Shai et al., 2008). However, our results are comparable to preliminary evidence that postprandial carbohydrate utilization was increased directly after the administration of a meal or single oral glucose (Liu et al., 1983).
In Chinese subjects, Liu et al. (1990) observed the fasting plasma glucose, insulin and lipids responses to the high-carbohydrate (CHO 80%) and the high-fat diet (Fat 45%). The high carbohydrate diet increased the fasting plasma glucose levels on day 1 (P<0.01), insulin (P<0.01) on day 3 and TG levels on days 3 and 5. On the other hand, the high fat diet decreased plasma TG values on day 1 but increased TC on days 1 and 3, but the fasting plasma glucose levels were decreased slightly on day 5 without a significant difference in insulin levels.
In healthy American volunteers, two levels of dietary carbohydrate (40% and 60% of calorie) consumption for 10 days resulted in that no differences were observed in fasting plasma glucose or cholesterol concentrations. However, fasting plasma TG levels as well as insulin were significantly elevated in the 60% carbohydrate diet group, and HDL-cholesterol concentrations were decreased significantly (Coulston et al., 1983). It is therefore that the levels of dietary carbohydrate may influence the blood measures of lipids, lipoproteins, and insulin which are associated with incidence of coronary heart disease.
Several studies have shown that the amount and nature of carbohydrate in a meal alter postprandial lipid metabolism. Since we compared the influences of relative amounts of macronutrients in the same menu, the latter could not explain our results. Plasma TG concentration was significantly elevated according to the amount of fat consumption (Lopez-Miranda et al., 2007). Some studies using a very low (5 g) or low (15 g) dose of dietary fat did not significantly increase triacylglycerolaemia postprandially; moderate doses (30-50 g) dose-dependently increased postprandial triacylglycerolaemia (from 0.9 to 1.3 mmol/L above baseline, respectively); and very high doses (80 g and above) exaggerated postprandial triacylglycerolaemia but without dose-dependence (Dubois et al., 1998; Lopez-Miranda et al., 2007).
Data obtained after the addition of glucose (50 g, 100 g) to high fat meal have not shown consistent findings on postprandial lipid metabolism in healthy subjects (Cohen & Berger, 1990), whereas the addition of sucrose or fructose has consistently been shown to increase postprandial triacylglycerolaemia (Grant et al., 1994). Therefore, the amount of fat (40.6 g) in the present study was appeared to be enough to stimulate postprandial triacylglycerolaemia, although it is not the usual amount of fat in typical Korean menu. Moreover, the high fat meal was acceptable in the present subjects. All subjects consumed the given menu entirely in recommended time. We found that salad dressing is an easily applicable food item to modify fat consumption in this study.
In healthy subjects, physiological ranges of postprandial hyperglycemia and hyperinsulinaemia as generated by starch foods (bread, pasta, beans) did not induce noticeable alterations in the overall postprandial TG response (Harbis et al., 2004). Similarly, the experimental menu, high carbohydrate meal used in the present study did not altered postprandial TG response. On the other hand, the third National Health and Nutrition Examination Survey (NHANES III) showed that the quantity and type of carbohydrate consumed in the habitual diet did not contribute to the plasma glucose, serum insulin concentration but inversely associated with serum C-reactive protein (CRP) concentration (Yang et al., 2003).
The IGI is a commonly used measure of early insulin secretory capacity (Laaksonen et al., 2005). This index had moderately high correlation with acute insulin responses that were measured during a frequently sampled intravenous glucose tolerance test (r=0.47-0.61). Sharman et al. (2004) showed that the short-term hypoenergetic low-fat diet was more effective at lowering serum LDL-C, but the very low carbohydrate diet was more effective at improving characteristics of the metabolic syndrome as shown by a decrease in fasting serum TG, postprandial lipidemia, serum glucose and greater weight loss.
There are several limitations of the current study. A single diet is a poor descriptor of a person's usual intake, because of individual variability. Also, our results must be considered preliminary due to the small number of study subjects. However, there is widespread interest in "high fat diet" and "high protein diet" alternatives to the conventional "high carbohydrate" approach for weight loss recently. Although a diet low in saturated fats and rich in whole grains, vegetables and fruit is recommended in order to reduce the risk of obesity, cardiovascular disease and type 2 diabetes (McAuley et al., 2005). It is unclear exactly how postprandial glycemia or lipaemia impacts on pathophysiologic conditions such as atherosclerosis, diabetes, and coronary heart diseases. Further studies are expected to investigate the effects of amounts and types of macronutrients in the habitual Korean diets on postprandial response.
In the current study, hyperglycemia and hyperinsulinemia were both induced significantly and acutely by the high carbohydrate meal not by the high fat meal, while gradual hypertriacylglycerolaemia was observed by the high fat meal not by the high carbohydrate meal. In conclusion, macronutrients content in the meal may be an important determinant of postprandial substrate utilization in healthy young individuals.
Footnotes
This work was supported by a Grant from the Kyung Hee University in 2004 (20040052).
References
- 1.Cohen JC, Berger GM. Effects of glucose ingestion on postprandial lipemia and triglyceride clearance in humans. J Lipid Res. 1990;31:597–602. [PubMed] [Google Scholar]
- 2.Coulston AM, Liu GC, Reaven GM. Plasma glucose, insulin and lipid responses to high-carbohydrate low-fat diets in normal humans. Metabolism. 1983;32:52–56. doi: 10.1016/0026-0495(83)90155-5. [DOI] [PubMed] [Google Scholar]
- 3.Dubois C, Beaumier G, Juhel C, Armand M, Portugal H, Pauli AM, Borel P, Latge C, Lairon D. Effects of graded amounts (0-50 g) of dietary fat on postprandial lipemia and lipoproteins in normolipidemic adults. Am J Clin Nutr. 1998;49:578–588. doi: 10.1093/ajcn/67.1.31. [DOI] [PubMed] [Google Scholar]
- 4.Gougeon R, Carrington M, Field CJ. The impact of low-carbohydrate diets on glycemic control and weight management in patients with type 2 diabetes. Canadian Journal of Diabetese. 2006;30:269–277. [Google Scholar]
- 5.Grant KI, Marais MP, Dhansay MA. Sucrose in a lipid-rich meal amplifies the postprandial excursion of serum and lipoprotein triglyceride and cholesterol concentrations by decreasing triglyceride clearance. Am J Clin Nutr. 1994;59:853–860. doi: 10.1093/ajcn/59.4.853. [DOI] [PubMed] [Google Scholar]
- 6.Harbis A, Perdreau S, Vincent-Baudry S, Charbonnier M, Bernard MC, Raccah D, Senft M, Lorec AM, Defoort C, Portugal H, Vinoy S, Lang V, Lairon D. Glycemic and insulinemic meal responses modulate postprandial hepatic and intestinal lipoprotein accumulation in obese, insulin-resistant subjects. Am J Clin Nutr. 2004;80:896–902. doi: 10.1093/ajcn/80.4.896. [DOI] [PubMed] [Google Scholar]
- 7.Katz A, Nambi SS, Mather K, Baron AD, Follmann DA, Sullivan G, Quon MJ. Quantitative insulin sensitivity check index: a simple, accurate method for assessing insulin sensitivity in humans. J Clin Endocrinol Metab. 2000;85:2402–2410. doi: 10.1210/jcem.85.7.6661. [DOI] [PubMed] [Google Scholar]
- 8.Kwon SJ, Kim YK. Anthropometry, blood pressure, serum lipid levels and nutrient Intakes in people with impaired fasting glucose and with diabetes. The Korean Journal of Nutrition. 2003;35:303–313. [Google Scholar]
- 9.Laaksonen DE, Toppinen LK, Juntunen KS, Autio K, Liukkonen KH, Poutanen KS, Niskanen L, Mykkänen HM. Dietary carbohydrate modification enhances insulin secretion in persons with the metabolic syndrome. Am J Clin Nutr. 2005;82:1218–1227. doi: 10.1093/ajcn/82.6.1218. [DOI] [PubMed] [Google Scholar]
- 10.Liu B, He Y, Zhang R, Zhang L, Fan P, Peng T, Liu Y. Effect of high carbohydrate and high fat diets on plasma glucose, insulin and lipids in normal and hypertriglyceridemic subjects. Hua Xi Yi Ke Da Xue Xue Bao. 1990;21:145–149. [PubMed] [Google Scholar]
- 11.Liu GC, Coulston AM, Reaven GM. Effect of high-carbohydrate-low-fat diets on plasma glucose, insulin and lipid responses in hypertriglyceridemic humans. Metabolism. 1983;32:750–753. doi: 10.1016/0026-0495(83)90103-8. [DOI] [PubMed] [Google Scholar]
- 12.Lopez-Miranda J, Williams C, Lairon D. Dietary, physiological, genetic and pathological influences on postprandial lipid metabolism. Br J Nutr. 2007;98:458–473. doi: 10.1017/S000711450774268X. [DOI] [PubMed] [Google Scholar]
- 13.Mattews DR, Hosker JP, Rudenski AS, Naylor BA, Treacher DF, Turner RC. Homeostasis model assessment: insulin resistance and beta-cell function from fasting plasma glucose and insulin concentrations in man. Diabetologia. 1985;28:412–419. doi: 10.1007/BF00280883. [DOI] [PubMed] [Google Scholar]
- 14.McAuley KA, Hokins CM, Smith KJ, McLay RT, Williams SM, Taylor RW, Mann JI. Comparison of high fat and high protein diets with a high carbohydrate diet in insulin-resistant obese women. Diabetologia. 2005;48:8–16. doi: 10.1007/s00125-004-1603-4. [DOI] [PubMed] [Google Scholar]
- 15.McGregor IS, Lee AM. Metabolic changes associated with ingestion of different macronutrients and different meal sizes in rats. Physiol Behav. 1995;57:277–286. doi: 10.1016/0031-9384(94)00221-p. [DOI] [PubMed] [Google Scholar]
- 16.Park EJ, Krauses RM, Christiansen MP, Neese RA, Hellerstein MK. Effects of a low-fat, high-carbohydrate diet on VLDL-triglyceride assembly, production, and clearance. J Clin Invest. 1999;104:1087–1096. doi: 10.1172/JCI6572. [DOI] [PMC free article] [PubMed] [Google Scholar]
- 17.Ryu MH, Cha YS. The effects of a high-fat or high sucrose diet on serum lipid profiles, hepatic acyl-CoA synthetase, carnitine palmitoyltransferase-1, and the acetyl-CoA carboxylase mRNA levels in rats. J Biochem Mol. 2003;36:312–318. doi: 10.5483/bmbrep.2003.36.3.312. [DOI] [PubMed] [Google Scholar]
- 18.Sargrad KR, Homko C, Mozzoli M, Boden G. Effect of high protein vs high carbohydrate intake on insulin sensitivity, body weight, hemoglobinA1c, and blood pressure in patients with type 2 diabetes mellitus. J Am Diet Assoc. 2005;105:573–580. doi: 10.1016/j.jada.2005.01.009. [DOI] [PubMed] [Google Scholar]
- 19.Shai I, Schwarzfuchs D, Henkin Y, Shahar DR, Witkow S, Greenberg I, Golan R, Fraser D, Bolotin A, Vardi H, Tangi-Rozental O, Zuk-Ramot R, Sarusi B, Brickner D, Schwartz Z, Sheiner E, Marko R, Katorza E, Thiery J, Fiedler GM, Blüher M, Stumvoll M, Stampfer MJ. Weight loss with a low-carbohydrate, Mediterranean, or low-fat diet. N Engl J Med. 2008;359:229–241. doi: 10.1056/NEJMoa0708681. [DOI] [PubMed] [Google Scholar]
- 20.Sharman MJ, Gómez AL, Kraemer WJ, Volek JS. Very low-carbohydrate and low-fat diets affect fasting lipids and postprandial lipemia differently in overweight men. J Nutr. 2004;134:880–885. doi: 10.1093/jn/134.4.880. [DOI] [PubMed] [Google Scholar]
- 21.Volek JS, Feinman RD. Carbohydrate restriction improves the features of Metabolic Syndrome. Metabolic Syndrome may be defined by the response to carbohydrate restriction. Nutr Metab (Lond) 2005;2:31. doi: 10.1186/1743-7075-2-31. [DOI] [PMC free article] [PubMed] [Google Scholar]
- 22.Wareham NJ, Phillips DI, Byrne CD. The 30 minute insulin incremental response in an oral glucose tolerance test as a measure of insulin secretion. Diabet Med. 1995;12:931. doi: 10.1111/j.1464-5491.1995.tb00399.x. [DOI] [PubMed] [Google Scholar]
- 23.Yang EJ, Kerver JM, Park YK, Kayitsinga J, Allison DB, Song WO. Carbohydrate intake and biomarkers of glycemic control among US adults: the third National Health and Nutrition Examination Survey (NHANES III) Am J Clin Nutr. 2003;77:1426–1433. doi: 10.1093/ajcn/77.6.1426. [DOI] [PubMed] [Google Scholar]
- 24.Yoon SG, Kim MA. Glycemic responses of Korean domestic meals and diabetic meals in normal subjects. The Kor J Food and Nutr. 1998;11:303–311. [Google Scholar]


