Abstract
This study was aimed to investigate the nutritional status and the role of diabetes mellitus in hemodialysis (HD) patients. Anthropometric, biochemical, and dietary assessments for HD 110 patients (46 males and 64 females) were conducted. Mean body mass index (BMI) was 22.1 kg/m2 and prevalence of underweight (BMI<18.5 kg/m2) was 12%. The hypoalbuminemia (<3.5 g/dl) was found in 15.5% of the subject, and hypocholesterolemia (<150 mg/dl) in 46.4%. About half (50.9%) patients had anemia (hemoglobin: <11.0 g/dL). High prevalence of hyperphosphatemia (66.4%) and hyperkalemia (43.5%) was also observed. More than 60 percent of subjects were below the recommended intake levels of energy (30-35 kcal/kg IBW) and protein (1.2 g/kg IBW). The proportions of subjects taking less than estimated average requirements for calcium, vitamin B1, vitamin B2, vitamin C, and folate were more than 50%, whereas, about 20% of the subjects were above the recommended intake of phosphorus and potassium. Diabetes mellitus was the main cause of ESRD (45.5%). The diabetic ESRD patients showed higher BMI and less HD adequacy than nondiabetic patients. Diabetic patients also showed lower HDL-cholesterol levels. Diabetic ESRD patients had less energy from fat and a greater percentage of calories from carbohydrates. In conclusion, active nutrition monitoring is needed to improve the nutritional status of HD patients. A follow-up study is needed to document a causal relation between diabetes and its impact on morbidity and mortality in ESRD patients.
Keywords: Hemodialysis, nutritional status, diabetic ESRD patients, hypoalbuminemia, hypocholesterolemia
Introduction
Hemodialysis (HD) is the most widely used dialysis modality worldwide and the number of patients receiving maintenance HD has been rapidly increasing in Korea. According to the end-stage renal disease (ESRD) registry committee of the Korean Society of Nephrology, the total number of HD patients was 585 per million population in 2006, representing an increase of 18 times since 1986 (ESRD Registry Committee et al., 2006). Despite recent advances in our understanding of the uremic state and improvements in the science and technology of HD, the prognosis for ESRD patients on HD remains poor (Caglar et al., 2002).
Nutritional status is a major issue in the long-term management of HD patients. Good nutritional status is considered the prerequisite for the better prognosis of HD patients. Numerous studies have focused on the association between nutritional status and clinical outcome of HD patients (Avram et al., 1995; Goldwasser et al., 1993; Owen et al., 1993). The prevalence of malnutrition such as protein-energy malnutrition, underweight, hypoalbuminemia, and anemia is reported to be very common in HD patients. Direct correlation of PEM and hypoalbuminemia with morbidity and mortality in HD patients were reported (Bossola et al., 2005). Qureshi et al. (1998) reported that protein-energy malnutrition was more prevalent at the start of the study in patients who subsequently died than in survivors. Churchill et al. (1992) also reported a direct correlation between the serum albumin levels and morbidity and mortality in 486 HD patients.
Several studies have reported that nutritional status of HD patients in Korea was poor. Kim et al. (2000) reported that 6.0% of the HD patients showed kwashiorkor-type malnutrition and 75.8% showed mild malnutrition assessed by weight and serum albumin levels. Another study indicated that 21.3% of HD patients were underweight and serum hemoglobin, hematocrit, and total lymphocyte were below the normal range (Kim et al., 2001). Kim et al. (1990) reported a low value of anthropometric parameters and inadequate intakes of protein, energy, and vitamin A, B1, B2, and C in HD patients.
Diabetes mellitus (DM) is considered contributing risk factors for ESRD (Raffaitin et al., 2007; Kim et al., 2005). DM is the most common cause of ESRD and its prevalence continues to increase worldwide (Kobrin, 1998).
Nutritional status of HD patients needs to be assessed by a combination of anthropometric and biochemical indicators rather than a single measure. Although several studies have reported on inadequate nutritional status and its correlates in Koreans HD patients, few studies investigated all of anthropometric, biochemical, behavioral, and dietary factors of HD patients. In addition, to the best of our knowledge, no study has reported the role of DM in HD patients in Korea. This study was aimed to investigate the nutritional status, and the role of DM in HD patients.
Subjects and Methods
Subjects
All subjects were ESRD outpatients from general hospitals and HD centers who had been referred to a dialysis center in Seoul, Korea, for maintenance HD care. Among the 144 patients recruited from June 2007 through March 2008, 110 subjects (46 males and 64 females) agreed to participate and were enrolled in this study. The subjects had been on HD 3 times a week for at least 3 months before entering this study. Patients with advanced senility or dementia were excluded. Ability to give informed consent for participation is one of the eligibility criteria for enrollment. All patients were informed that there were no interventions and no adverse effects with regard to patients' rights. All patients provided written informed consent. The median age of these patients was 58.6 years old (range, 28-81 y). All patients were interviewed individually to obtain information about their general characteristics and health behaviors. The primary cause of ESRD was reported and documented. We abstracted and reviewed the medical charts to obtain the information.
Measurements
For anthropometrics, height and postdialysis weight were measured with light clothes and without shoes using an automatic height/weight measuring instrument. Body mass index (BMI) was calculated as kg/m2. Triceps skinfold thickness (TSF) was measured using a lange skinfold caliper (Cambridge Scientific Inc., Cambridge, MD, USA) at 10 minutes after dialysis. Mid-arm circumference (MAC) was measured with a plastic measuring tape using standardized techniques. Mid-arm muscle circumference (MAMC) was calculated as MAC-(0.314×TSF).
Blood samples were taken from the arterial site of the vascular access before starting dialysis and were sent to Eone Reference Laboratory (Seoul, Korea) for analysis. Serum concentrations of total protein, albumin, blood urea nitrogen, creatinine, triglyceride, total cholesterol, HDL-cholesterol, LDL-cholesterol, calcium, phosphorous, potassium, sodium, uric acid, and total iron-binding capacity were measured using an autoanalyzer (AVIDA 2400, Bayer Diagnostics, Giessen, Germany). Hemoglobin concentration was measured using a autoanalyzer (XE 2100, TOA Medical Electronics, Kobe, Japan) at the clinical laboratory. Systolic and diastolic blood pressures were measured using an automatic blood pressure calculator (Omron HEM-907, Omron Matsuzaka Co. Ltd., Matsuzuka, Japan).
HD adequacy was estimated by Kt/V according to Daugirdas (1993) and the urea reduction rate (URR) was calculated using the following formulas:
Kt/V = -In (R-0.03)+[(4-3.5R)×(UF/W)]
URR (%)=(1-R)×100
*R=Post BUN/Pre BUN, UF is ultrafiltration in L, and W is the postdialysis weight in kg.
We used a URR value of 0.65 or a Kt/V value of 1.2 as the minimum values to achieve HD adequacy.
Food intake was recorded using a 24-hour recall method for two consecutive days including one dialysis day and one nondialysis day. The average intake of the two days was considered the daily food intake. The portion size picture booklet was used to help the patients estimate portion size. Food intake data were analyzed using Can-pro 3.0 software (Korean Nutrition Society, 2006) and compared with the Dietary Reference Intake for Koreans. Energy and protein intake data were compared with the Kidney Dialysis Outcome Quality Initiative recommendation by the National Kidney Foundation for HD patients.
Statistical analysis
Data are expressed as mean and standard error (continuous variables) or number and percentage (categorical variables). Differences between diabetic and nondiabetic ESRD patients were evaluated using ANCOVA, after adjustment for age, HD duration, and gender, as appropriate. Because serum ferritin and triglyceride concentrations had a skewed distribution, these variables were log-transformed before analysis. All analyses were performed using SPSS program (version 12.0). Significance was defined as P <0.05.
Results
General characteristics and health behavior
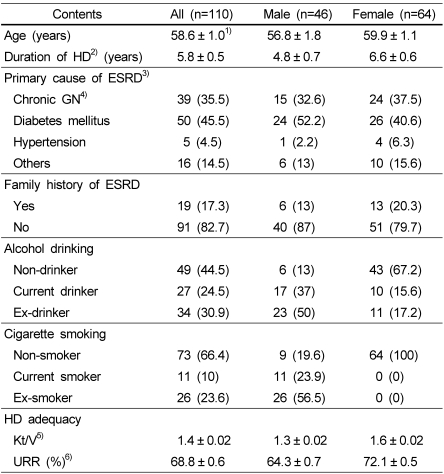
As shown in Table 1, mean age and duration of HD were 58.6 years and 5.8 years, respectively. The most frequent primary cause of ESRD was DM (45.5%), followed by glomerulonephritis (35.5%), and hypertension (4.5%). The proportion of the subjects with family history of ESRD was 17.3%. The proportions of current alcohol drinkers and current smokers of male subjects were 37.0% and 23.9%, respectively. None of females were smokers and 15.6% of them were alcohol drinkers. Adequacy of HD was assessed by the Kt/V and URR and values were lower in males than in females. Levels of Kt/V and URR of male subjects were 1.3 and 64.3%, and those of females were 1.6 and 72.1%, respectively.
Table 1.
General characteristics and health behavior
1)Mean ± SE.
2)HD: hemodialysis
3)ESRD: end stage renal disease
4)Chronic GN: Chronic glomerulonephritis
5)K: dialyzer urea clearance (ml/min) t: dialysis length (min) V: volume of urea distribution
6)URR: Urea Reduction Rate
Anthropometric variables
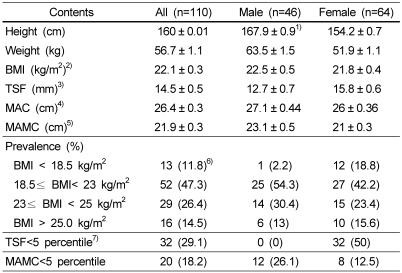
Table 2 shows anthropometric variables of the subjects. Mean height, weight, BMI were 167.9 cm, 63.5 kg, and 22.5 kg/m2 for male patients, and 154.2 cm, 51.9 kg, and 21.8 kg/m2 for female subjects, respectively. According to the BMI cutoffs for Asian adults by the WHO Asia-Pacific guideline, 13 subjects (11.8%) were underweight (BMI<18.5 kg/m2), whereas 16 subjects (14.5%) were obese (BMI≥25 kg/m2). Mean values of TSF, MAC, and MAMC were 12.7 mm, 27.1 cm, and 23.1 cm in males, and 15.8 mm, 26 cm, and 21 cm in females, respectively. Compared to reference values for Korean adults, none of male subjects belonged to TSF<5th percentile, however, 50% of female subjects belonged to this category. Also 26.1% of male subjects and 12.5% of the female subjects had MAMC<5th percentile.
Table 2.
Anthropometric variables
1)Mean ± SE.
2)BMI: Body mass index
3)TSF: Triceps skinfold thickness
4)MAC: Mid-arm circumference
5)MAMC: Mid-arm muscle circumference
6)N (%)
7)The Korean Dietetic Association (1994). Guidelines for clinical and nutritional management, p.10-21
Blood profiles and blood pressure
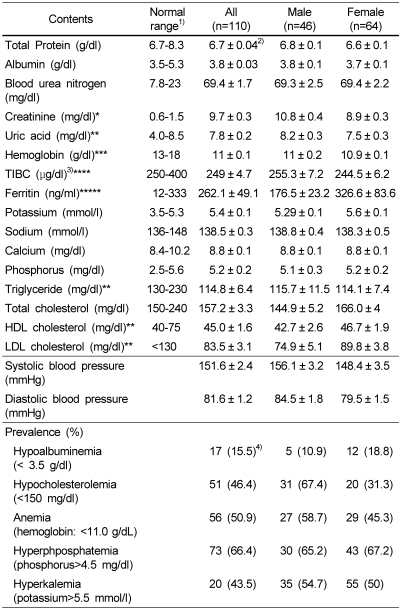
Table 3 shows blood profiles and blood pressure levels of the subjects. The serum concentrations of total protein, albumin, blood urea nitrogen, creatinine, and uric acid were 6.8 g/dl, 3.8 g/dl, 69.3 mg/dl, 10.8 mg/dl, and 8.2 mg/dl, respectively for males, and 6.6 g/dl, 3.7 g/dl, 69.4 mg/dl, 8.9 mg/dl, and 7.5 mg/dl, for females. The prevalence of hypoalbuminemia (albumin<3.5 g/dl) was 10.9% in males and 18.8% in females. Hemoglobin, ferritin, and TIBC were 11 g/dl, 176.5 ng/ml, and 255.3 µg/dl in male subjects, and 10.9 g/dl, 326.6 ng/ml, and 244.5 µg/dl in female subjects, respectively. About half of the subjects (50.9%) had anemia (hemoglobin: <11 g/dL). In male subjects, serum concentrations of potassium, sodium, calcium, and phosphorus were 5.29 mmol/l, 138.8 mmol/l, 8.8 mg/dl, and 5.1 mg/dl, respectively. The corresponding concentrations for female subjects were 5.6 mmol/l, 138.3 mmol/l, 8.8 mg/dl, and 5.2 mg/dl, respectively. The prevalence of hyperphosphatemia (phosphorus≥4.5 mg/dl) was 65.2% in males and 67.2% in females. The prevalence of hyperkalemia (potassium≥5.5 mmol/l) was 54.7% in males and 50% in females.
Table 3.
Blood profiles and blood pressure
1)Henry's clinical diagnosis and management by laboratory methods.21th ed. W.B. Saunders, 2007
2)Mean ± SE.
3)TIBC:Total iron binding capacity
4)N (%)
*males=44, female=64, **males=35, femal=48, ***males=46, female=63, ****males=38, female=55, *****males=46, female=61
The serum levels of triglyceride, total cholesterol, HDL cholesterol, and LDL cholesterol were 115.7 mg/dl, 144.9 mg/dl, 42.7 mg/dl, and 74.9 mg/dl, respectively in male patients, and 114.1 mg/dl, 166 mg/dl, 46.7 mg/dl, and 89.8 mg/dl in female subjects. The prevalence of hypocholesterolemia (total cholesterol<150 mg/dl) was 67.4% in males and 31.3% in females. Only one female patient had a serum cholesterol level over 240 mg/dl. Mean diastolic blood pressure was within normal range, however, systolic blood pressure was above normal range for both genders.
Dietary intakes
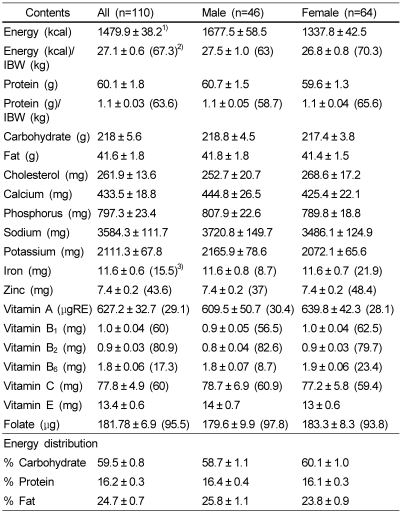
The subjects' mean daily nutrient intakes are shown in Table 4. The intakes of energy, carbohydrate, protein, and fat were 1677.5 kcal, 218.8 g, 60.7 g, and 41.8 g in males and 1337.8 kcal, 217.4 g, 59.6 g, and 41.4 g in females, respectively. Energy distribution of carbohydrate: protein: fat was 58.7%: 16.4%: 25.8% in male patients and 60.1%: 16.1%: 23.8% in female subjects. The proportions of subjects whose intake did not meet energy (30 kcal/kg IBW/d) and protein (1.2 g/kg IBW/d) recommended by the Kidney Dialysis Outcome Quality Initiative by the National Kidney Foundation were 63% and 58.7% in males, and 70.3% and 65.6% in females, respectively.
Table 4.
Nutrient intakes of the subjects
1)Mean ± SE. Assessed by CAN pro 3.0 program
2)( ) : The proportion of subjects taking less than 30 kcal/ IBW (kg)/d for energy and 1.2 g/ IBW (kg)/d for protein
3)( ) : The proportion of the subjects taking less than Estimated Average Requirements (EAR) of Dietary Reference Intakes for Korean (KDRI), wherever applicable
Dietary vitamin and mineral intakes were not adequate. Sixty to eighty percent of subjects did not meet the Estimated Average Requirements (EAR) of dietary reference intakes for Korean for vitamin B1, vitamin B2, and vitamin C. Almost all patients (96%) did not meet the EAR for folate. The proportions of subjects taking less than the EAR for iron, vitaminB6, and vitamin A were 15-20%.
Characteristics of HD patients according DM
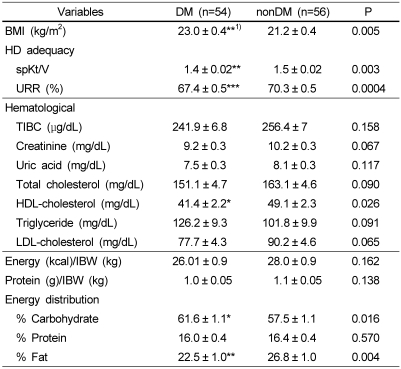
Patients with DM were compared with patients with nonDM to investigate the role of DM in ESRD patients. The average BMI was greater in diabetic HD patients than in nondiabetic HD patients (P=0.005). Diabetic patients had less fat intake (P=0.004), a greater percentage of calories from carbohydrate (P=0.016) and lower HDL-cholesterol levels (P=0.026). The diabetic ESRD patients showed less HD adequacy than nondiabetic patients (spKt/V, P=0.003; URR, P=0.0004).
Discussion
Nutritional assessment and management has been recognized as an important therapeutic approach for HD patients, because poor nutritional status is associated with poor prognosis in HD patients. Many studies have reported the association between malnutrition (indicated by low BMI, low body fat, and low muscle mass) and mortality in HD patients (Aoyagi et al., 2001; Kutner & Zhang, 2001; Port et al., 2002). Several studies reported that BMI levels of <19-20 kg/m2 in HD patients were associated with higher mortality risk (Leavey et al., 1998; Mafra et al., 2007). In our subjects, the mean BMI was in normal range, however, the prevalence of underweight (BMI <18.5 kg/m2) was 12%. Even higher underweight prevalence of 21.3% in 5,161 Korean HD patients was reported by Ahn and Choi (1999). We employed TSF as an indicator of fat mass and MAMC of muscle mass. Our subjects showed high prevalence of low fat mass measured by TSF (29.1%) and low muscle mass measured by MAMC (18.2%). Our result is consistent with other reports that fat mass (86.7%) and lean body mass (66.7%) were reduced in HD patients (Kim & Kim, 2001; Oksa et al., 1991).
Hypoalbuminemia, hypocholesterolemia, and anemia were considered indicators of malnutrition and predictors of increased morbidity and mortality in HD patients. (Kalantar-Zadeh et al., 2003; Marcén et al., 1997). In this study, 10.9% of males and 18.8% of females were hypoalbuminemic. The prevalence of hypoalbuminemia was similar to the prevalence of underweight. Almost all patients (over 90 %) had anemia, assessed by serum albumin and hemoglobin. Hypocholesterolemia is common in HD patients and is considered an independent predictor of mortality in patients on HD. Several studies have reported that HD patients with low cholesterol levels were at higher risk of malnutrition (Iseki et al., 2002; Okumura et al., 1999; Wakugami et al., 1998). In accordance with other reports, our subjects also showed high prevalence of hypocholesterolemia (cholesterol<150 mg/dl): 67.4% in males and 31.3% in females.
Relatively high energy and protein intakes have been recommended for HD patients because of dialytic losses of amino acids, metabolic acidosis, and comorbid conditions. The intakes of energy and protein were below the recommended level in our subjects. The inadequate intake of energy and protein was also reported by Kim et al. (2000) in Korean HD patients. Inadequate intake of energy and protein in HD patients were also reported by Morais et al. (2005) in Brazlian HD patients, and by the HEMO study in the U.S. HD patients (Rocco et al., 2004). Energy and protein deficit is a common nutritional problem in HD patients.
Vitamin and mineral intakes of our subjects were also insufficient. The proportions of subjects who did not meet the EAR for vitamins and minerals were very high. This result is consistent with previous reports in Korean HD patients: Kim et al. (2000) reported inadequate intakes of vitamin A and vitamin B1; and Chun (2001) has reported insufficient intakes of vitamin A, vitamin B1, vitamin B2, and niacin. Kalantar-Zadeh et al. (2002) reported that HD patients in the U.S. were consuming insufficient amounts of vitamin C, dietary fibers and potassium in comparison to control subjects. Increased nutrient losses due to the dialysis procedures and decreased food intakes due to anorexia, psychosocial conditions, depression, and aging are contributors for malnutrition in HD patients.
Even though the mean serum concentrations of phosphorus and potassium were at upper limit of normal ranges in our subjects, the prevalence of hyperphosphatemia (66.4%) and hyperkalemia (43.5%) were high. Restrictions on dietary phosphorus and potassium have been recommended to control serum levels of phosphorus and potassium in HD patients. Because high phosphorus intake may lead to hyperphosphatemia, secondary hyperparathyroidism, and renal osteodystrophy in HD patients, it is recommended that dietary phosphorus be restricted to under 1000 mg/day (Şanlier & Demircioğlu, 2007). In our subjects, the average phosphorus intake was 797.3 mg/day, however, 19.1% of our subjects had a phosphorus intake≥1000 mg/day, suggesting the need for phosphorus intake being monitored continuously. Hyperkalemia is related to irregular heartbeat and even death in HD patients (Beto & Bansal, 2004). A recommendation is made to restrict dietary potassium to under 2000-3000 mg/day (National Kidney Foundation, 2003).
Dialysis adequacy is a crucial element in the overall management of HD patients (Teixeira Nunes et al., 2008). Teixeira Nunes et al. (2008) reported that dialysis adequacy was related to nutritional status and influenced by the protein intake and body compositions. In this study, levels of Kt/V were 1.3 in males and 1.6 in females and were in normal ranges. Kt/V levels were lower in males than in females.
Diabetes mellitus (DM) is considered contributing risk factors for ESRD (Kim et al., 2005; Raffaitin et al., 2007). DM is the most common cause of ESRD and its prevalence continues to increase worldwide (Kobrin, 1998) and in Korea (Kim et al., 2003). About half of our patients had DM. The prognosis of diabetic ESRD patients was worse compared to non-diabetic patients, even though duration on HD was shorter (data not shown). Diabetic ESRD patients as compared to non-diabetic patients showed a significantly higher BMI and lower serum HDL cholesterol, Kt/V and URR. Our result is consistent with other reports. (Kim et al., 2005; Noel et al., 2002).
The main cause of death in ESRD patients is cardiovascular diseases. Hypertension, which is an independent and strong risk factor for cardiovascular diseases, was more prevalent in diabetic ESRD subjects in our sample. This result emphasizes the importance of DM patient care to prevent DM-related morbidity and mortality.
In conclusion, the nutritional status of our subjects was inadequate, assessed by anthropometric, hematologic, and dietary parameters. Therefore, active nutrition monitoring is needed to improve the nutritional status of HD patients. Also a follow-up study is needed to document a causal relation between diabetes and its impact on morbidity and mortality in ESRD patients. Further research with a larger sample and for a longer follow up period should be conducted to expand our understanding of nutritional status for HD patients.
Table 5.
Clinical and laboratory data of HD patients with DM and nonDM
1)Mean ± SE. P value by ANCOVA between DM and nonDM group after adjusting for sex, age and hemodialysis duration
*p<0.05, **p<0.01, ***p<0.001
Footnotes
This work was supported by the second stage of BK21 Project in 2008.
References
- 1.Ahn SJ, Choi EJ. Renal Replacement Therapy in Korea-Insan Memorial Registry 1997. The Korean Journal of Nephrology. 1999;18:1–15. [Google Scholar]
- 2.Aoyagi T, Naka H, Miyaji K, Hayakawa K, Ishikawa H, Hata M. Body mass index for chronic hemodialysis patients: stable hemodialysis and mortality. Int J Urol. 2001;8:S71–S75. doi: 10.1046/j.1442-2042.2001.00339.x. [DOI] [PubMed] [Google Scholar]
- 3.Avram MM, Mittman N, Bonomini L, Chattopadhyay J, Fein P. Markers of survival in dialysis: A seven-year prospective study. Am J Kidney Dis. 1995;26:209–219. doi: 10.1016/0272-6386(95)90176-0. [DOI] [PubMed] [Google Scholar]
- 4.Beto JA, Bansal VK. Medical Nutrition Therapy in Chronic Kidney Failure: Integrating Clinical Practice Guidelines. J Am Diet Assoc. 2004;104:404–409. doi: 10.1016/j.jada.2003.12.028. [DOI] [PubMed] [Google Scholar]
- 5.Bossola M, Muscaritoli M, Tazza L, Giungi S, Tortorelli A, Rossi Fanelli F, Luciani G. Malnutrition in Hemodialysis Patients: What Therapy? Am J Kidney Dis. 2005;46:371–386. doi: 10.1053/j.ajkd.2005.05.031. [DOI] [PubMed] [Google Scholar]
- 6.Caglar K, Hakim RM, Ikizler TA. Approaches to the reversal of malnutrition, inflammation, and atherosclerosis in end-stage renal disease. Nutr Rev. 2002;60:378–387. doi: 10.1301/00296640260385928. [DOI] [PubMed] [Google Scholar]
- 7.Cano NJ, Roth H, Aparicio M, Azar R, Canaud B, Chauveau P, Combe C, Fouque D, Laville M, Levelve XM French study Group for Nutrition in Dialysis (FSG-ND) Malnutrition in hemodialysis diabetic patients: evaluation and prognostic influence. Kidney Int. 2002;62:593–601. doi: 10.1046/j.1523-1755.2002.00457.x. [DOI] [PubMed] [Google Scholar]
- 8.Chun SJ. Assessment of Nutritional Status in Hemodialysis Patients. Yonsei University Graduate School of Korea; 2001. Master's Thesis. [Google Scholar]
- 9.Churchill DN, Taylor DW, Cook RJ, Laplante P, Barre P, Cartier P, Fay WP, Goldstein MB, Jindal K, Mandin H. Canadian hemodialysis morbidity study. Am J Kidney Dis. 1992;19:214–234. doi: 10.1016/s0272-6386(13)80002-9. [DOI] [PubMed] [Google Scholar]
- 10.Daugirdas JT. Second generation logarithmic estimates of single pool variable volume Kt/V: an analysis of error. J Am Soc Nephrol. 1993;4:1205–1213. doi: 10.1681/ASN.V451205. [DOI] [PubMed] [Google Scholar]
- 11.ESRD Registry Committee. Current renal replacement therapy in Korea - Insan Memorial Dialysis Registry. Republic of Korea: Korean Society of Nephrology; 2006. [Google Scholar]
- 12.Goldwasser P, Mittman N, Antignani A, Burrell D, Michel MA, Collier J, Avram MM. Predictors of mortality in hemodialysis patients. J Am Soc Nephrol. 1993;3:1613–1622. doi: 10.1681/ASN.V391613. [DOI] [PubMed] [Google Scholar]
- 13.Iseki K, Yamazato M, Tozawa M, Takishita S. Hypocholesterolemia is a significant predictor of death in a cohort of chronic hemodialysis patients. Kidney Int. 2002;61:1887–1893. doi: 10.1046/j.1523-1755.2002.00324.x. [DOI] [PubMed] [Google Scholar]
- 14.Kalantar-Zadeh K, Kopple JD, Deepak S, Block D, Block G. Food intake characteristics of hemodialysis patients as obtained by food frequency questionnaire. J Ren Nutr. 2002;12:17–31. doi: 10.1053/jren.2002.29598. [DOI] [PubMed] [Google Scholar]
- 15.Kalantar-Zadeh K, Ikizler TA, Block G, Avram MM, Kopple JD. Malnutrition inflammation complex syndrome in dialysis patients: causes and consequences. Am J Kidney Dis. 2003;42:864–881. doi: 10.1016/j.ajkd.2003.07.016. [DOI] [PubMed] [Google Scholar]
- 16.Kim JH, Kim SR. Subjective global assessment of nutrition in maintenance hemodialysis patients. The Korean Journal of Nephrology. 2001;20:270–276. [Google Scholar]
- 17.Kim S, Sohn C, Chae DW. Comparison of nutritional status and inflammational markers in DM and nonDM hemodialysis patients. Korean Journal of Community Nutrition. 2005;10:693–699. [Google Scholar]
- 18.Kim SM, Lee YS, Cho DK. Nutritional Assessment of the hemodialysis patients. The Korean Journal of Nutrition. 2000;33:179–185. [Google Scholar]
- 19.Kim SY, Jin DC, Bang BK. Current status of dialytic therapy in Korea. Nephrology (Carlton) 2003;8:S2–S9. doi: 10.1046/j.1440-1797.8.s.5.x. [DOI] [PubMed] [Google Scholar]
- 20.Kim YH, Seo HJ, Kim SR. A study of the nutritional status, nutritional knowledge, and dietary habits of the hemodialysis patients. The Korean Journal of Nutrition. 2001;34:920–928. [Google Scholar]
- 21.Kim YK, Choi KH, Kang SW, Hurk HW, Lee SW, Lee HY, Han DS. Nutritional assessment of chronic dialysis patients. The Korean Journal of Nephrology. 1990;9:58–66. [Google Scholar]
- 22.Kobrin SM. Diabetic nephropathy. Dis Mon. 1998;44:214–234. doi: 10.1016/s0011-5029(98)90022-0. [DOI] [PubMed] [Google Scholar]
- 23.Kutner NG, Zhang R. Body mass index as a predictor of continued survival in older chronic dialysis patients. Int Urol Nephrol. 2001;32:441–448. doi: 10.1023/a:1017581726362. [DOI] [PubMed] [Google Scholar]
- 24.Leavey SF, Strawderman RL, Jones CA, Port FK, Held PJ. Simple nutritional indicators as independent predictors of mortality in hemodialysis patients. Am J Kidney Dis. 1998;31:997–1006. doi: 10.1053/ajkd.1998.v31.pm9631845. [DOI] [PubMed] [Google Scholar]
- 25.Mafra D, Farage NE, Azevedo DL, Viana GG, Mattos JP, Velarde LG, Fouque D. Impact of serum albumin and body-mass index on survival in hemodialysis patients. Int Urol Nephrol. 2007;39:619–624. doi: 10.1007/s11255-007-9201-2. [DOI] [PubMed] [Google Scholar]
- 26.Marcén R, Teruel JL, de la Cal MA, Gámez C. The impact of malnutrition in morbidity and mortality in stable haemodialysis patients. Nephrol Dial Transplant. 1997;12:2324–2331. doi: 10.1093/ndt/12.11.2324. [DOI] [PubMed] [Google Scholar]
- 27.Morais AA, Silva MA, Faintuch J, Vidigal EJ, Costa RA, Lyrio DC, Trindade CR, Pitanga KK. Correlation of nutritional status and food intake in hemodialysis patients. Clinics. 2005;60:185–192. doi: 10.1590/s1807-59322005000300002. [DOI] [PubMed] [Google Scholar]
- 28.National Kidney Foundation. K/DOQI Clinical Practice Guidelines for Managing Dyslipidemias in Chronic Kidney Disease. Am J Kidney Dis. 2003;41:S1–S92. [PubMed] [Google Scholar]
- 29.Oksa H, Ahonen K, Pasternack A, Marnela KM. Malnutrition in hemodialysis patients. Scand J Urol Nephrol. 1991;25:157–161. doi: 10.3109/00365599109024551. [DOI] [PubMed] [Google Scholar]
- 30.Okumura K, Iseki K, Wakugami K, Kimura Y, Muratani H, Ikemiya Y, Fukiyama K. Low serum cholesterol as a risk factor for hemorrhagic stroke in men: A community-based mass screening in Okinawa, Japan. Jpn Circ J. 1999;63:53–58. doi: 10.1253/jcj.63.53. [DOI] [PubMed] [Google Scholar]
- 31.Owen WF, Jr, Lew NL, Liu Y, Lowrie EG, Lazarus JM. The urea reduction ratio and serum albumin concentrations as predictors of mortality in patients undergoing hemodialysis. N Engl J Med. 1993;329:1001–1006. doi: 10.1056/NEJM199309303291404. [DOI] [PubMed] [Google Scholar]
- 32.Port FK, Ashby VB, Dhingra RK, Roys EC, Wolfe RA. Dialysis dose and body mass index are strongly associated with survival in hemodialysis patients. J Am Soc Nephrol. 2002;13:1061–1066. doi: 10.1681/ASN.V1341061. [DOI] [PubMed] [Google Scholar]
- 33.Qureshi AR, Alvestrand A, Danielsson A, Divino-Filho JC, Gutierrez A, Lindholm B, Bergström J. Factors predicting malnutrition in hemodialysis patients: A cross-sectional study. Kidney Int. 1998;53:773–782. doi: 10.1046/j.1523-1755.1998.00812.x. [DOI] [PubMed] [Google Scholar]
- 34.Raffaitin C, Lasseur C, Chauveau P, Barthe N, Gin H, Combe C, Rigalleau V. Nutritional status in patients with diabetes and chronic kidney disease: a prospective study. Am J Clin Nutr. 2007;85:96–101. doi: 10.1093/ajcn/85.1.96. [DOI] [PubMed] [Google Scholar]
- 35.Rocco MV, Dwyer JT, Larive B, Greene T, Cockram DB, Chumlea WC, Kusek JW, Leung J, Burrowes JD, McLeroy SL, Poole D, Uhlin L HEMO Study Group. The effect of dialysis dose and membrane flux on nutritional parameters in hemodialysis patients. Results of the HEMO study. Kidney Int. 2004;65:2321–2324. doi: 10.1111/j.1523-1755.2004.00647.x. [DOI] [PubMed] [Google Scholar]
- 36.Sanlier N, Demircioğlu Y. Correlation of Dietary Intakes and Biochemical Determinates of Nutrition in Hemodialysis Patients. Ren Fail. 2007;29:213–218. doi: 10.1080/08860220601098904. [DOI] [PubMed] [Google Scholar]
- 37.Teixeira Nunes F, de Campos G, Xavier de Paula SM, Merhi VA, Portero-McLellan KC, da Motta DG, de Oliveira MR. Dialysis adequacy and nutritional status of hemodialysis patients. Hemodial Int. 2008;12:45–51. doi: 10.1111/j.1542-4758.2008.00239.x. [DOI] [PubMed] [Google Scholar]
- 38.Wakugami K, Iseki K, Kimura Y, Okumura K, Ikemiya Y, Muratani H, Fukiyama K. Relationship between serum cholesterol and the risk of acute myocardial infarction in a screened cohort in Okinawa, Japan. Jpn Circ J. 1998;62:7–14. doi: 10.1253/jcj.62.7. [DOI] [PubMed] [Google Scholar]


