Abstract
UDP-galactopyranose mutase (UGM) is the key enzyme involved in the biosynthesis of Galf. UDP-Galp and UDP-Galf are two natural substrates of UGM. A protocol that combines the use of STD-NMR spectroscopy, molecular modeling, and CORCEMA-ST calculations was applied to the investigation of the binding of UDP-Galf and its C3-fluorinated analogue to UGM from Klebsiella pneumoniae. UDP-Galf and UDP-[3-F]Galf were bound to UGM in a similar manner as UDP-Galp. The interconversions of UDP-Galf and UDP-[3-F]Galf to their galactopyranose counterparts were catalyzed by the reduced (active) UGM with different catalytic efficiencies, as observed by NMR spectroscopy. The binding affinities of UDP-Galf and UDP-[3-F]Galf were also compared with those of UDP-Galp and UDP by competition STD-NMR experiments. When UGM was in the oxidized (inactive) state, the binding affinities of UDP-Galf, UDP-Galp, and UDP-[3-F]Galf were of similar magnitudes, and were lower than that of UDP. However, when UGM was in the reduced state, UDP-Galp had higher binding affinity compared with UDP. Molecular dynamics (MD) simulations indicated that the “open” mobile loop in UGM “closes” upon binding of the substrates. Combined MD simulations and STD-NMR experiments were used to create models of UGM with UDP-Galf and UDP-[3-F]Galf as bound ligands. Calculated values of saturation-transfer effects with CORCEMA-ST (complete relaxation and conformational exchange matrix analysis of saturation transfer) were compared to the experimental STD effects, and permitted differentiation between two main conformational families of the bound ligands. Taken together, these results are used to rationalize the different rates of catalytic turnover of UDP-Galf and UDP-[3-F]Galf, and shed light on the mechanism of action of UGM.
Keywords: UDP-galactopyranose mutase, UDP-galactopyranose, UDP-galactofuranose, UDP-[3-F]galactofuranose, STD-NMR, CORCEMA-ST, GROMACS, AutoDock 3.0.5
INTRODUCTION
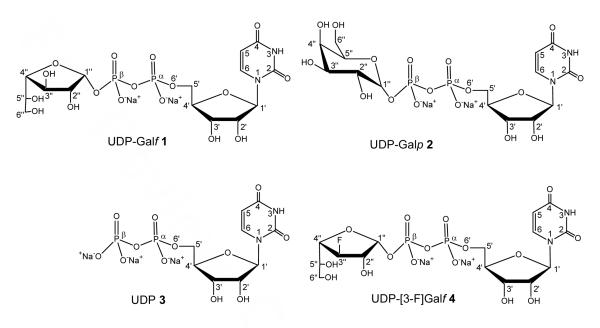
The development of new drugs for tuberculosis (TB) has taken on some urgency in recent years. The World Health Organization (WHO) reports that the global incidence rate of TB is rising and more than 4,000 people die of TB everyday.1 More new cases are expected since TB is also the main cause of death in AIDS patients. Inhibition of the incorporation of D-galactofuranose (D-Galf) has become a potential therapeutic strategy since Galf-containing oligosaccharides form part of the cell walls of mycobacteria and are critical for their survival and infectivity.2, 3 Incorporation of Galf into oligosaccharides involves two steps. First, the activated precursor UDP-galactofuranose (UDP-Galf 1) is synthesized from UDP-galactopyranose (UDP-Galp 2) in a reaction catalyzed by UDP-galactopyranose mutase (UGM).4,5 Subsequently, Galf is transferred from UDP-Galf 1 onto acceptors to form various Galf-containing oligosaccharides by UDP-galactofuranosyltransferase (GalfT).6,7 Since Galf is absent in mammalian glycoconjugates,8 the enzymes related to the biosynthesis of Galf-containing units, such as UGM and GalfT, have been selected as new targets for the development of drugs against TB. Knowledge of the ligand-binding properties of the enzymes, particularly the exact ligand topographies or epitopes recognized, is critical for the design of such inhibitors, and will also yield insights into the mechanistic aspects of Galf biosynthesis.
UGM has been isolated from several bacterial sources and all have been found to contain a flavin adenine dinucleotide (FAD) in the active site.9,10 The mechanism of action of UGM is not yet completely resolved, and is still the subject of active investigation.10-13 Analogues of the natural substrates have been synthesized and the activities of these compounds have been used to infer the mechanism of reaction.14-18 Among these compounds, synthetic C2- and C3-fluorinated UDP-Galf 1 analogues15 and UDP-Galp 2 analogues14 functioned as substrates for the reduced UGM, thereby discounting a previous mechanism involving the generation of a 2,3-enediol intermediate via redox recycling of the FAD coenzyme to facilitate the ring cleavage.15 These compounds could also be used as lead compounds for the design of an UGM inhibitor. Recently, two new analogues of possible intermediates have been reported that further discount another mechanism that is initiated by the elimination of UDP 3 to form an oxacarbenium ion followed by the attack of the oxygen atom at C3 or C4 on C1 to form a bicyclo-acetal intermediate.17, 18
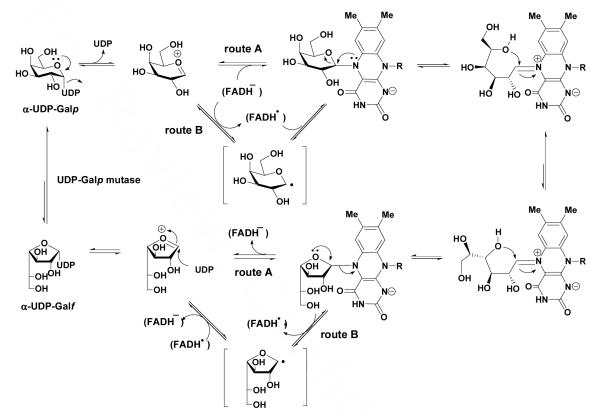
The most recent mechanistic hypothesis proposed by Soltero-Higgin et al.12 involves direct nucleophilic addition of the reduced flavin to C1 of the sugar substrate, based on the trapping of the coenzyme-substrate adduct during the interconversion (Scheme 1, route A). This adduct may play a central role to facilitate the opening and recyclization of the galactose ring. This mechanism is similar to an early proposal from Huang et al.19 in which the reaction is initiated by a one-electron transfer from the reduced flavin to an oxacarbenium-ion intermediate generated by C1 elimination of UDP 3, followed by radical recombination of the nascent flavin semiquinone and hexose radical to give the coenzyme-substrate adduct (Scheme 1, route B). A thermodynamic analysis of the enzyme’s flavin cofactor using EPR spectroscopy by Fullerton et al.20 revealed that the conversion of FAD/FADH- is critical to the function of the enzyme.
Scheme 1.
The first X-ray crystal structure of UGM from E. coli at 2.4 Å resolution was reported in 2001.10 Thus far, five crystal structures of UGM from Escherichia coli, Mycobacterium tuberculosis, and Klebsiella pneumoniae have been solved.10,11 The structures of all three UGMs are essentially identical, with the only significant differences occurring in the positioning of a mobile loop located next to the active site.11 The novel structure shows that the flavin nucleotide is located in domain 1 with the re face of the isoalloxazine ring open to a cleft lined with conserved residues. Site-directed mutagenesis studies indicate that this cleft contains the active site;10 the sugar ring of the substrate UDP-Galp 2 is presumably located adjacent to the exposed isoalloxazine ring of FAD. The first structure of UGM in the reduced state has also been obtained for K. pneumoniae at 2.35 Å resolution11 and no dramatic structural change is observed upon the reduction of the enzyme. However, attempts to obtain the crystal structures of the complexes of two natural substrates, UDP-Galf 1 and UDP-Galp 2, with UGM have been unsuccessful.
Our previous strategy to study UGM used a combined protocol of STD-NMR spectroscopy,21,22 AutoDock calculations,23 and CORCEMA-ST calculations24 to gain insight into the mechanism of ligand binding.25-27 Thus, the epitopes of the natural substrate, UDP-Galp 2, and the inhibitor, UDP 3, bound to UGM from K. pneumoniae have been mapped by STD-NMR experiments. Reliable structural binding modes of UDP-Galp 2 and UDP 3 in the UGM active site have been provided by this combined protocol. The predicted STD values for UDP-Galp 2 and UDP 3 docked in monomer A of UGM from E. coli (with a “closed” flexible loop conformation) compared favorably with the experimental values, thus lending credence to the binding model. Poor correlation between experimental and computed results obtained in the docking study for monomer B of UGM from E. coli (with an “open” loop conformation) suggested that monomer B was not representative of the conformation of the catalytic subunit and allowed us to speculate on the role of the flexible loop in UGM for substrate binding. Competition NMR experiments also showed that UDP-Galp 2 competes with UDP 3 for binding to UGM, especially when UGM is in its reduced state. We have also recently modified our protocol to include molecular dynamics calculations (GROMACS),28 and we now report the application of this refined protocol to the investigation of the binding of UDP-Galf 1 and its fluorinated analogue, UDP-[3-F]Galf 4, to UGM from K. pneumoniae. Their relative binding affinities were also compared with those of UDP-Galp 2 and UDP 3 by competition STD-NMR experiments. Turnover of the enzyme was also followed by NMR spectroscopy. The enzyme activity of oxidized UGM could not be detected, and reduced UGM exhibited different catalytic efficiencies with UDP-Galf 1 and UDP-[3-F]Galf 4. MD simulations showed that the mobile loop in UGM from K. pneumoniae “closes” upon binding of the substrates. Interestingly, the loop movement was affected by the different orientations of the Galf moieties of 1 and 4 generated by AutoDock calculations; comparison of calculated and experimental STD effects also permitted selection of the bound ligand conformations.
EXPERIMENTAL PROCEDURES
General
Purified UGM from K. pneumoniae was obtained as previously described by Sanders et al.10 UDP-Galf 1 was kindly provided by Dr. T. L Lowary at the University of Alberta. UDP-[3-F]Galf 4 was synthesized according to the method of Zhang et al.15 All chemicals, unless noted otherwise, were purchased from Aldrich or Sigma and used without further purification. STD-NMR spectra were recorded on Bruker AVANCE 600 MHz spectrometer, equipped with a TCI CryoProbe. NMR data processing was performed using TopSpin 1.2 Bruker software and curve fitting was performed using Kaleidagraph 4.0. Molecular dynamics calculations used WestGrid computing resources, which are funded in part by the Canada Foundation for Innovation, Alberta Innovation and Science, BC Advanced Education, and the participating research institutions. WestGrid equipment is provided by IBM, Hewlett Packard and SGI.
NMR spectroscopy
The NMR samples were prepared according to our previously published method.26 Briefly, to a sample of UGM (0.5 mg) in phosphate-buffered solution (50 mM K2HPO4/KH2PO4, 99% D2O, pH 7.6) was added either UDP-Galf 1 (0.75 mg), UDP 3 (0.44 mg) or UDP-[3-F]Galf 4 (0.76 mg). The final ligand concentration was 2 mM at a ratio of 100:1 ligand:protein. The ligand resonances were assigned using 1H-1H TOCSY and 1H-13C HMQC NMR spectroscopy. Longitudinal relaxation time T1 of 1 and 4 in the presence of UGM was acquired with the inversion recovery pulse sequence. The sample of reduced UGM was made by adding freshly prepared sodium dithionite solution (20 mM) to the NMR sample under an atmosphere of N2.10, 26 A series of STD-NMR spectra at different saturation times was recorded at 280K with 1024 scans and selective saturation of protein resonances at −1.0 ppm (30 ppm for reference spectra) using a series of Gaussian shaped pulses, each of 50 ms. The total saturation time was adjusted by the number of shaped pulses. An additional delay before saturation was applied to keep the total recovery time constant, as described in previous publications.29 The protein resonances were broad and had significant intensity in the region downfield from 10 ppm and even at negative ppm values. Thus, irradiation at −1.0 ppm was expected to result in saturation of protein resonances, from the aliphatic to the aromatic. Irradiation at −1.0 ppm was also considered prudent to achieve selective saturation of the protein resonances since a ligand resonance was present at 8.0 ppm. The saturated and reference spectra were acquired simultaneously by creating a pseudo-2D experiment. The STD spectrum was obtained by subtraction of saturated spectra from reference spectra. The fractional STD effect was calculated by (I0 - Isat)/I0, where (I0 - Isat) is the peak intensity in the STD spectrum and I0 is the peak intensity of an unsaturated reference spectrum. Reference experiments using the free ligands themselves were performed under the same experimental conditions to verify true ligand binding; no signal was present in the difference spectra, indicating that the effects observed in the presence of the protein were due to true saturation transfer. Instead of using a T1rho filter to eliminate the background signals from protein, the STDD (Saturation Transfer Double Difference) NMR method30 was applied by performing control STD NMR experiments for UGM in the absence of ligand under identical experimental conditions and subtracting the control spectra from STD spectra of the complexes.
Molecular docking
UDP-Galf 1 and UDP-[3-F]Galf 4 docking in the putative active site of UGM was performed with AutoDock 3.0.523 as described previously.26 The initial structures of UDP-Galf 1 and UDP-[3-F]Galf 4 were constructed using Sybyl software (Tripos, Inc.). The 2.4 Å resolution crystal structure of UGM from E. coli (PDB entry 1I8T)10 was used as the model for the macromolecule in docking studies. Monomer A with the mobile loop proximal to the uracil moiety of UDP-Galp 2 was chosen to be most representative of the conformation of the catalytic unit.26 The structure of the uridine moiety of UDP-Galp 2 from the recent docking study26 served as the corresponding moiety to build initial structures of 1 and 4.
Molecular dynamics simulations
Starting conformations of the ligands UDP-Galf 1 and UDP-[3-F]Galf 4 were gathered from low energy clusters of AutoDock-derived structures of UDP-Galf 1 and UDP-[3-F]Galf 4 docked to monomer A of Escherichia coli (PDB entry 1I8T). Two major conformational clusters of UDP-Galf 1 and UDP-[3-F]Galf 4 were identified; the A conformation, which resembled the lowest energy conformation of UDP-Galp 2, and the B conformation, which was more populated by UDP-[3-F]Galf 4. The ligands were then fitted to analogous positions in the K. pneumoniae UGM crystal structure with reduced FAD (PDB entry 2BI8) using UCSF Chimera.31 Atoms missing from the X-ray structure were repaired using UCSF Chimera31 with the exception of the N-terminal methionine which was omitted from the simulation. The system was solvated using the SPC water model32 with sodium and chloride ions added at random positions for 0.1 M salt concentration and neutral system charge. No experimentally derived restraints from NMR were used in the molecular dynamics simulations.
All molecular dynamics (MD) simulations were run on WestGrid using the GROMACS 3.3.1 simulation package (www.gromacs.org)28 with a version of the GROMOS 53A6 force field33 modified to include UDP-Galf 1, UDP-[3-F]Galf 4 and the reduced form of FAD. The additional residue types were hand-built based on existing topologies of uridine, flavin, ATP and D-galactopyranose in the GROMOS 53A6 force field. All energy minimizations used less than 500 steps of steepest descent to relax to a tolerance of 1000 kJ mol−1 nm−1. During equilibration runs, all protein non-hydrogen atoms were harmonically restrained with a force constant of 1000 kJ mol−1 nm−2. A 2 fs timestep was used for integration, with bond lengths constrained by the LINCS algorithm.34 A 1.4 nm cutoff was used for van der Waals interactions. Long-range electrostatic interactions were treated using the particle mesh Ewald (PME) method.35, 36 All simulations were run in the constant number of particles, pressure, and temperature (NPT) ensemble. A simulation temperature of 300 K was maintained using the Berendsen thermostat37 with a coupling constant of 0.1 ps. A Berendsen barostat maintained a simulation pressure of 1 bar with a coupling constant of 1 ps. Molecular graphics images were produced using the UCSF Chimera program from the Computer Graphics Laboratory, University of California, San Francisco (supported by NIH P41-RR01081).31
CORCEMA-ST calculations
The theory of CORCEMA-ST and the details of executing the CORCEMA-ST protocol have been described previously.25-27, 38-40 The pdb coordinates of UDP-Galf 1 □UGM and UDP-[3-F]Galf 4 □UGM complexes were generated from the average structures of the final 1 ns of the MD simulations. Based on the experimental conditions, the concentration of ligand was 2 mM and the ratio of ligand: protein was kept fixed at 100:1. kon was set to 3×10⁵ s−1 M−1. On the basis of the competition STD-NMR experiments performed here and the KD values of UDP-Galp 2 and UDP 3 in the complex with UGM reported recently (220 and 28 μM, respectively),41 the dissociation constants (KD) of 1 and 4 were set in the range of 10−4–10−6 M and modified further to get the best fit. The final value used in the calculation was 2×10⁻⁴M. The correlation time (τ) was set in the range of 0.3–2.0 ns and 20–100 ns for ligand in the free and bound states, respectively; after optimization, the final values were 0.5 ns and 80 ns, respectively.
RESULTS AND DISCUSSION
Binding epitopes of UDP-Galf 1 and UDP-[3-F]Galf 4
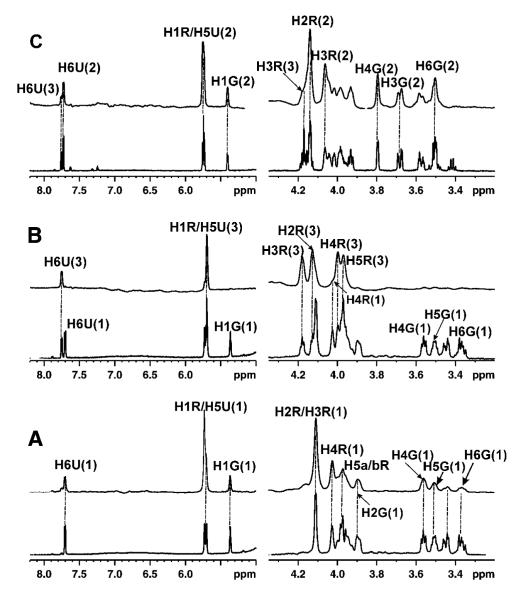
1D-STD-NMR experiments were performed to explore the binding of UDP-Galf 1 and UDP-[3-F]Galf 4 to UGM in its oxidized state. Significant STD effects were observed in the spectra (Figure 1A and 2A), suggesting that 1 and 4 bind in the active site of UGM, even when UGM is inactive. The result parallels that obtained for the binding of UDP-Galp 2 to oxidized UGM.26 On the basis of previous studies, the STD intensity of a ligand proton is related not only to its proximity to the receptor, but also to its longitudinal relaxation time T1.24, 42, 43 Thus, T1 times of the protons in UDP-Galf 1 and UDP-[3-F]Galf 4 in the presence of UGM at a 1:100 (UGM : ligand) ratio were measured and the results are displayed in Table 1. Most protons in 1 and 4 have similar T1 times, ranging from 1.1 s to 1.3 s, except for the H1, H5 and H6 protons in the ribose and galactofuranose moieties. H1R and H1G exhibit longer T1 values, ranging from 2.0 s to 2.5 s, and H5R, H5G, and H6G have shorter T1 values of about 0.5 s. In order to evaluate the T1 effect on the STD peak intensities, STD build-up curves for 1 and 4 were determined by collecting STD spectra at seven different saturation times ranging from 0.5 s to 5 s (Supporting Information Figure S1). The maximal STD intensity, STDmax, and the observed saturation rate constant, ksat, were obtained from fitting the saturation time data to the monoexponential equation: STD = STDmax(1- e(-ksatt)), as described by Mayer et al.42 The slope of the STD build-up curve at a saturation time of 0, STDfit(shown in Table 1), was obtained by the multiplication of STDmax and ksat. STDfit is suggested to correspond to the STD intensity in the absence of T1 bias and it is dependent on the proximity of the ligand proton to the protein.42 The largest STD effects were observed for the H1R protons of the ribose moiety in 1 and 4 at seven different saturation times. Thus, the STD intensity of this peak was set to 100% as a reference. The relative STD intensities for the other protons were normalized based on this peak intensity, as summarized in Table 1. As longer saturation times were applied, stronger STD signals were observed but were modulated by T1 effects. For example, considerably different build-up rates, ksat, were observed for H1 and H6 protons, attributable to their different T1 relaxation times. The relative STD intensities of H6G to H1R were 32% at 0.5 s saturation time and decreased to 9% at 5 s saturation time. For other protons in 1 and 4, the rank of STD effects remained the same at 0.5 or 5 s saturation time since their T1 values are in the same range. As suggested previously, the saturation time for the protein in STD-NMR experiments should be shorter than the T1 of ligand protons in order to obtain more accurate epitope mapping.43 However, weak STD peak intensities at short saturation time could also affect the accuracy. Thus, use of STDfit generated from STD build-up curves should be the most reliable way to predict the binding epitopes of ligands. As shown in Table 1, the binding epitopes for 1 and 4 were calculated from STDfit and they are very close to the data obtained at 0.5 s saturation time.
Figure 1.
STD NMR (above) and 1H NMR reference spectra (below) for the binding of ligand at a concentration of 1 mM to 10 μM UGM at 600 MHz and 280 K. (A) UDP-Galf 1 with UGM in the oxidized state; (B) UDP-Galf 1: UDP 3 at a ratio of 1:1 with UGM in the oxidized state showing that the STD signals were mainly from UDP 3 and that the STD signals of UDP-Galf 1 were very weak; (C) UDP-Galf 1 : UDP 3 at a ratio of 1:1 with UGM in the reduced state showing that UDP-Galf 1 has been converted to UDP-Galp 2, and the STD signals were mainly from UDP-Galp 2. The signal assignments for UDP-Galf 1, UDP-Galp 2 and UDP 3 are shown in the top spectrum (U: Uracil; R: Ribose; G: Galactofuranose).
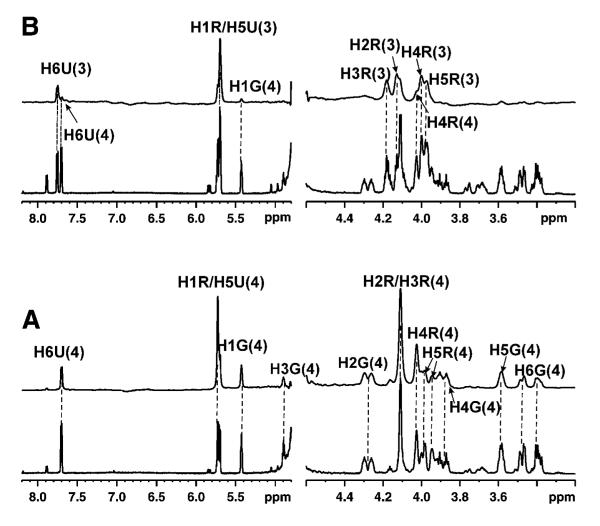
Figure 2.
STD NMR spectra (above) and 1H NMR spectra (below) for the competitive binding of UDP-[3-F]Galf 4 with UDP 3 to UGM at 600 MHz and 280 K. (A) UDP-[3-F]Galf 4 with 10 μM UGM in the oxidized state; (B) UDP-[3-F]Galf 4 : UDP 3 at a ratio of 1:1 with UGM in the oxidized state showing that the STD signals were mainly from UDP 3 and that the STD signals of UDP-[3-F]Galf 4 were very weak. The signal assignments for UDP 3 and UDP-[3-F]Galf 4 are shown in the top spectrum (U: Uracil; R: Ribose; G: Galactofuranose).
Table 1.
Experimental STD intensities of (A) UDP-Galf 1 and (B) UDP-[3-F]Galf 4 at different saturation times. STDmax and Ksat were calculated by fitting the data to an exponential equation and STDfit and epitopes (fit) were derived. The respective T1 relaxation times of the ligand at a 100:1 of ligand : UGM are also displayed.
| (A) | Experimental STDa | STDmaxb | ksatb | STD (fit)c | STD epitopes (fit) a |
T1(s) | ||
|---|---|---|---|---|---|---|---|---|
| 0.5 s | 2 s | 5 s | ||||||
| H5U | 71.4 | 69.0 | 56.5 | 11.64±0.51 | 0.412±0.036 | 4.77±0.41 | 70.9 | ---d |
| H6U | 33.6 | 31.4 | 29.2 | 6.03±0.48 | 0.383±0.053 | 2.29±0.40 | 34.0 | 1.22 |
| H1R | 100 | 100 | 100 | 22.46±1.96 | 0.300±0.044 | 6.74±1.07 | 100 | 2.39 |
| H2R/H3R | 67.2 | 56.8 | 49.1 | 8.91±0.46 | 0.521±0.058 | 4.63±0.58 | 68.8 | 1.25 |
| H4R | 52.9 | 39.6 | 38.7 | 6.57±0.37 | 0.534±0.067 | 3.48±0.49 | 51.7 | 1.07 |
| H5R/H3G | 38.6 | 29.2 | 21.3 | 4.27±0.07 | 0.564±0.022 | 2.39±0.09 | 35.5 | ---d |
| H1G | 21.8 | 24.7 | 26.3 | 5.10±0.04 | 0.333±0.048 | 1.68±0.26 | 25.0 | 2.02 |
| H2G | 20.2 | 19.5 | 21.3 | 7.23±2.07 | 0.182±0.066 | 1.30±0.63 | 19.3 | 1.36 |
| H4G | 17.6 | 20.1 | 20.4 | 3.51±0.25 | 0.424±0.057 | 1.47±0.23 | 21.9 | ---d |
| H5G | 25.2 | 21.0 | 16.1 | 3.46±0.28 | 0.501±0.076 | 1.73±0.31 | 25.7 | 0.99 |
| H6G | 31.9 | 17.4 | 9.53 | 2.02±0.08 | 0.912±0.09 | 1.84±0.21 | 27.3 | 0.53 |
| (B) | Experimental STDa | STDmaxb | ksatb | STD (fit) c | STD epitopes (fit) a |
T1 (s) | ||
|---|---|---|---|---|---|---|---|---|
| 0.5 s | 2 s | 5 s | ||||||
| H5U | 65.8 | 67.2 | 61.1 | 13.76±1.02 | 0.362±0.048 | 4.95±0.76 | 70.7 | 1.81 |
| H6U | 41.0 | 36.7 | 33.3 | 6.71±0.34 | 0.422±0.041 | 2.82±0.31 | 40.2 | 1.26 |
| H1R | 100 | 100 | 100 | 22.60±1.56 | 0.314±0.038 | 7.01±0.98 | 100 | 2.53 |
| H2R/H3R | 65.4 | 58.3 | 50.0 | 9.52±0.50 | 0.502±0.057 | 4.76±0.60 | 67.9 | 1.32 |
| H4R | 65.0 | 51.9 | 44.4 | 8.20±0.42 | 0.554±0.059 | 4.51±0.54 | 64.4 | 1.26 |
| H5R | 32.5 | 25.9 | 22.2 | 4.10±0.20 | 0.553±0.061 | 2.26±0.27 | 32.2 | 0.54 |
| H1G | 33.3 | 32.2 | 33.3 | 7.82±0.64 | 0.285±0.037 | 2.19±0.34 | 31.3 | 2.56 |
| H2G | 50.9 | 39.5 | 38.9 | 7.88±0.23 | 0.454±0.077 | 3.55±0.62 | 50.6 | 1.73 |
| H3G | 25.6 | 18.3 | 16.7 | 2.94±0.23 | 0.582±0.105 | 1.71±0.34 | 24.3 | ---d |
| H4G | --- | 30.6 | 33.3 | 6.44±0.60 | 0.505±0.088 | 3.22±0.64 | 46.0 | 1.14 |
| H5G | 34.2 | 32.9 | 27.8 | 5.38±0.30 | 0.502±0.055 | 2.69±0.33 | 38.4 | 1.14 |
| H6G | 39.7 | 24.4 | 16.7 | 2.85±0.12 | 1.061±0.148 | 3.02±0.64 | 43.1 | 0.54 |
For ease of comparison, the STD effects were normalized to the H1R intensity, which was set to 100.
From fitting the saturation time data to the monoexponential equation: STD = STDmax (1-e(-ksatt)).42
Slope of the STD build-up curve at a saturation time of 0.
Not determined because of peak overlap.
As shown in Table 1, the binding epitopes of UDP-Galf 1 and UDP-[3-F]Galf 4 suggest that this substrate could be recognized by UGM in a similar manner as UDP-Galp 2. All protons in the uridine moiety of 1 and 4 showed significant STD signals, as also observed in the STD-NMR spectra of UDP-Galp 2,26 suggesting that this moiety is in close contact with the protein protons in the UGM active site. STD effects were also observed from all the protons of the galactose moiety in UDP-Galf 1, although the intensities were relatively weak compared with those from the uridine moiety. STD effects observed for UDP-[3-F]Galf 4 also suggested that the C3-F-substitution on the Galf moiety did not affect its binding epitopes significantly.
Interconversion of UDP-Galf 1 and UDP-[3-F]Galf 4 to their pyranose counterparts by UGM
Previous studies gave disparate results concerning the catalytic activity of oxidized UGM. Sanders et al.10 indicated that the enzyme was active only when the flavin moiety was reduced. On the other hand, Zhang et al.9 reported that UGM was still active in its oxidized state and the catalytic efficiency of UGM increased by more than two orders of magnitude under reduced conditions. In order to resolve this discrepancy, 1H NMR and STD-NMR experiments were performed on the complex of UDP-Galf 1 or UDP-Galp 2 with UGM in the absence and presence of sodium dithionite, at 280 K and 310K. NMR samples were prepared under the same experimental conditions routinely used for the activity assay.10 The results showed that, in the absence of dithionite, UDP-Galf 1□UGM or UDP-Galp 2□UGM complexes were very stable under the experimental conditions, and no interconversion was observed, suggesting that UGM was inactive in its oxidized state. It is therefore likely that the original preparation9 contained some reduced enzyme, and the Km values reported are actually a ratio of productive binding to reduced enzyme and non-productive binding to oxidized enzyme. UGM was then reduced by adding freshly prepared 20 mM dithionite at 280 K. Previous studies5, 12, 44 had shown that the ratio of UDP-Galf 1: UDP-Galp 2 was 7:93 at equilibrium. The signals from UDP-Galf 1 at equilibrium could be difficult to detect in a 1D 1H NMR spectrum, especially since most of the signals from UDP-Galf 1 were obscured by those from UDP-Galp 2. Only the H6G and H5G signals of UDP-Galf 1 were partially separated from the corresponding signals of UDP-Galp 2. Thus, tracking turnover by observing changes in the UDP-Galp 2-UGM complex upon addition of dithionite was difficult. However, for the UDP-Galf 1-UGM complex, two isolated peaks of H3G and H4G (δ3.7 ppm and 3.8 ppm, respectively) from UDP-Galp 2 could be used as markers for the appearance of UDP-Galp 2. These two signals were detected immediately after the addition of dithionite (Figure 1C). Concomitantly, the peak intensities of H6G and H5G from UDP-Galf 1 decreased significantly upon the addition of dithionite. The reaction catalyzed by reduced UGM was very efficient and the equilibrium UDP-Galf 1: UDP-Galp 2 ratio was attained in less than 10 min.
The interconversion experiment was also performed for UDP-[3-F]Galf 4. When UGM was in the oxidized state, the complex was stable under the experimental conditions and no interconversion of UDP-[3-F]Galf 4 was observed. When dithionite (20 mM) was added to the sample at low temperature (280 K), slow interconversion was detected in the 1H NMR spectra (Supporting information Figure 2), which appeared to be at variance with the previous observation with UDP-Galf 1. When the sample was kept at 280 K for 30 min, turnover was completed and the chemical shifts for the protons and carbons in the 3-F substituted galactose ring were consistent with the presence of UDP-[3-F]Galp 5. A previous kinetic study with this compound had shown that the catalytic efficiency (kcat/Km) for UDP-[3-F]Galf 4 decreased by approximately three orders of magnitude in comparison to that of UDP-Galf 1.15
Competitive binding of UDP-Galf 1 with UDP-Galp 2 and UDP 3 to UGM
The information used here to explore the mechanism of UGM is obtained mainly from the binding study for different ligands. Since the conversion of UDP-Galp 2 to UDP-Galf 1 is reversible, it would be interesting to know the competitive binding properties of these two ligands when they both exist in the active site of UGM. Our previous studies had shown that UDP-Galp 2 and UDP 3 bind competitively at the same site in UGM.26 A similar experiment was carried out for UDP-Galf 1 and UDP 3 to probe the question whether these two ligands were also located at the same region in the active site. Competition STD-NMR experiments22 were carried out at 280 K by titrating UDP 3 into the complexes of UDP-Galf 1 with UGM. STD NMR signals from UDP-Galf 1 decreased significantly as the ratio of UDP 3: UDP-Galf 1-UGM increased. A titration curve was obtained by fitting the STD peak intensities of UDP-Galf 1 as a function of the concentration of UDP 3 (Supporting Information Figure 3A).22, 45 The IC50 of UDP 3 relative to the binding of UDP-Galf 1, obtained from curve fitting, was about 40-50 μM. The KD of UDP-Galf 1 (400-800 μM) was estimated on the basis of the KD46 of UDP 3 (28 μM) from our previous study.41 As shown in Figure 1B, at a ratio of 1:1, the major STD signals were observed from UDP 3 clearly indicating that the relative affinity of UDP-Galf 1 is weaker than that of UDP 3 for binding to UGM in the oxidized state.
Next, we performed competition STD-NMR experiments for the complexes of UGM with UDP-Galf 1 and UDP-Galp 2. Since most of the signals in the spectrum of UDP-Galf 1 overlap with those from UDP-Galp 2, the STD signal changes of UDP-Galf 1 could not be detected upon addition of UDP-Galp 2; however, distinctive UDP-Galp 2 STD signals emerged. Competition experiments were then carried out by adding UDP-Galf 1 to UDP-Galp 2 at different ratios and a titration curve was also obtained (Supporting Information Figure 3C). The STD signals from two isolated peaks, H3G and H4G of UDP-Galp 2, were affected upon the addition of UDP-Galf 1. At a ratio of 1:1, the STD peak intensities of H3G and H4G of UDP-Galp 2 decreased to about 60%. On the basis of these titration experiments, we propose that the binding affinity of UDP-Galf 1 is in the same range as that of UDP-Galp 2. In addition, the binding of these two natural substrates is weaker than that of the inhibitor, UDP 3, when UGM is in the inactive state.
We next turned our attention to the competitive binding of these ligands with UGM in the reduced state. STD NMR experiments were performed for UDP-Galf 1 and UDP 3 at a 1:1 ratio in the presence of reduced UGM. Although UDP 3 was used as an inhibitor of UGM,47 UDP-Galf 1 was converted rapidly to UDP-Galp 2 upon the addition of sodium dithionite (Figure 1C). Consistent with our previous study,26 upon the addition of sodium dithionite, STD signals from both ligands, UDP-Galp 2: UDP 3 (ratio of 1:1), were observed, and the signals of UDP-Galp 2 were slightly more intense (Figure 1C). These results suggested that the relative binding affinity of UDP-Galp 2 increased upon reduction of UGM to the extent that they competed with UDP 3 for binding. The results observed from STD NMR experiments were consistent with those from fluorescence spectroscopy.41
Competitive binding of UDP-[3-F]Galf 4 with UDP3 to UGM
Competition STD-NMR experiments were carried out by titrating UDP 3 into the complex of UGM–UDP-[3-F]Galf 4 in order to compare the relative binding affinity of UDP-[3-F]Galf 4 and UDP 3 to UGM. When UGM was in its oxidized state, STD signals of UDP-[3-F]Galf 4 decreased significantly upon the addition of UDP 3 (Supporting Information Figure 3B). At a ratio of 1:1 (Figure 2B), the major STD signals were observed from UDP 3. A range of IC50 values of UDP 3 relative to the binding of UDP-[3-F]Galf 4 was roughly 100 to 130 μM from the curve fitting, giving a value of KD for 4 of 400 - 600 μM, calculated based on the KI of UDP.41 These experiments suggest that the relative binding affinity of UDP-[3-F]Galf 4 to oxidized UGM is lower compared to that of UDP 3. The KD values of these ligands also suggest that the binding affinities of UDP-Galf 1, UDP-Galp 2 and UDP-[3-F]Galf 4 are in the same range, as observed in experiments described above.
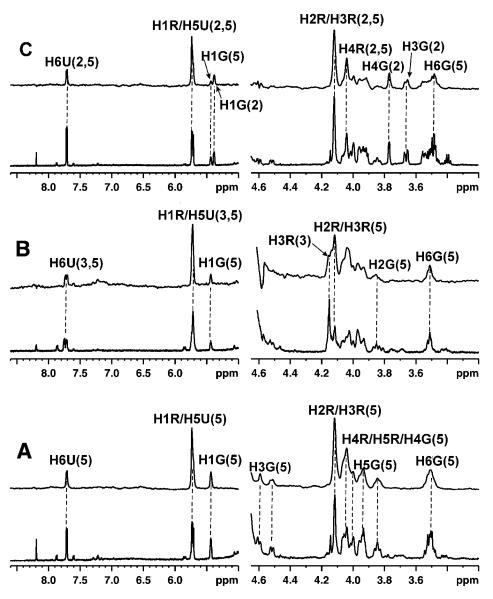
Upon reduction of the enzyme, UDP-[3-F]Galp 5 was generated from the interconversion and its binding affinity was compared with that of UDP 3 and UDP-Galp 2 when UGM was in the reduced state. As shown in Figure 3A, the STD signals from UDP-[3-F]Galp 5 were observed. When UDP-Galp 2 was added at a 1:1 ratio, STD signals from both ligands were observed, suggesting that the binding affinities of these two ligands should be in the same range. However, major STD signals from UDP-[3-F]Galp 5 were observed from the complex of UDP-[3-F]Galp 5 and UDP 3 at the ratio of 1:1, which suggested tighter binding of UDP-[3-F]Galp 5 to the reduced UGM than UDP 3.
Figure 3.
STD NMR spectra (above) and 1H NMR spectra (below) for the competitive binding of UDP-[3-F]Galp 5 with UDP-Galp 2 and UDP 3 to the reduced UGM at 600 MHz and 280 K. (A) UDP-[3-F]Galp5 was converted from UDP-[3-F]Galf 4 by 10 μM reduced UGM; (B) UDP-[3-F]Galp 5 : UDP 3 at a ratio of 1:1 with UGM in the reduced state showing that the STD signals were mainly from UDP-[3-F]Galp 5; (C) UDP-[3-F]Galp 5 : UDP-Galp 2 at a ratio of 1:1 with UGM in the reduced state showing that the STD signals were from 2 and 5. The signal assignments for ligands are shown in the top spectrum (U: Uracil; R: Ribose; G: Galactofuranose).
Molecular dynamics studies of binding modes
The binding modes of UDP-Galf 1 and UDP-[3-F]Galf 4 in the active site of UGM were generated by use of the AutoDock 3.0.5 program. The molecules were located in a similar position as UDP-Galp 2 in the active site of UGM.26 However, two different orientations (conformations A and B) of the Galf moiety were displayed in the lowest-energy clusters (Supporting information Figure 4). Conformation A displayed a very similar binding mode to that of UDP-Galp 2 in UGM, which is close to the N5 atom of the flavin moiety in UGM (the distance between C1 of 1 and N5 of flavin is 3.4 Å), consistent with the proposed enzyme mechanism. However, conformation B was inverted relative to the Galp moiety in UDP-Galp 2. Thus, C1 of the Galf residue was located away from the N5 atom of the flavin moiety in UGM (the distance between C1 of 1 and N5 of flavin is 5.02 Å). Since STD NMR data alone could not be used to differentiate between the binding of conformations A and B, we turned to the use of more accurate molecular dynamics (MD) simulations with UGM structures of Klebsiella pneumoniae with reduced FAD (PDB entry 2BI8).11 Unless otherwise noted, residue numbers refer to the K. pneumoniae structure. Simulations of 4 ns were used to probe the binding of UDP-Galf 1 and UDP-[3-F]Galf 4 with UGM. For static structural comparisons, the unrefined, averaged atomic positions of the final 1 ns of simulation were used.
The ‘mobile loop’ region, comprising approximately residues 166-179, is the major source of difference among the different X-ray structures of UGM, and this loop was also observed to have greater mobility during the MD simulations. The E. coli crystal structure dimer (PDB entry 1I8T)10 is comprised of monomer A, where the loop is closed over the active site and monomer B, where the loop is open, thereby allowing access to the active site. The K. pneumoniae crystal structure (PDB entry 2BI8)11 has the mobile loop section in a similar conformation to monomer B of E. coli, namely the open conformation. Logically, the mobile loop is expected to close over the ligand in the active site during binding. In the course of the MD simulations, the mobile loop closed over the active site for all simulations except for the UDP-Galf 1-UGM structure starting in conformation B. For this simulation, the loop remained open, suggesting that conformer B is not a low-energy, bound conformation of UDP-Galf 1.
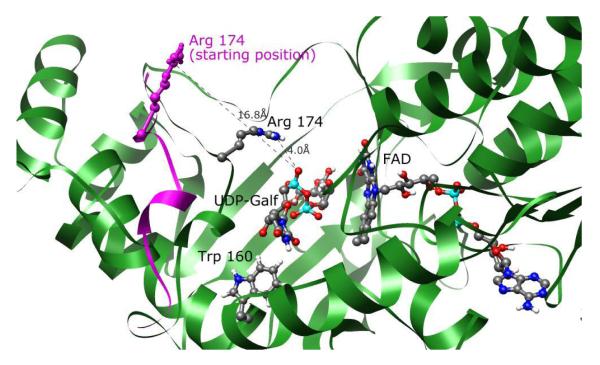
The significance of loop movements is illustrated in the positioning of Arg 174. By mutational studies, Arg 174 was shown to be essential for activity,48 but the crystal structures of the free enzymes show the residue side chain pointing away from the active site.10, 11 During MD simulations during which the loop closed, this arginine moved from approximately 18 Å away from the ligand to bring the arginine sidechain nitrogen atoms within 4-5 Å of the oxygen atom of the alpha phosphate moiety (See Figure 4).
Figure 4.
Mobile loop movement of UGM with UDP-Galf 1 in conformation A. Starting positions of the mobile loop ribbon and Arg 174 are shown in purple. Arg 174 on the mobile loop approaches the alpha phosphate of UDP-Galf 1 during the first 1.5 ns of simulation and remains near this orientation for the remaining 2.5 ns. FAD and Trp 160 are also displayed. The latter interacts with the uracil moiety.
Trp 160 was in contact with the uracil moiety of the ligands throughout every simulation. Throughout the trajectories, these aromatic moieties were involved in edge to face and face to face interactions. Pro 315 is another absolutely conserved residue in the UGM enzyme of several organisms;48 this residue was also closely associated with the uracil moiety throughout the MD simulations.
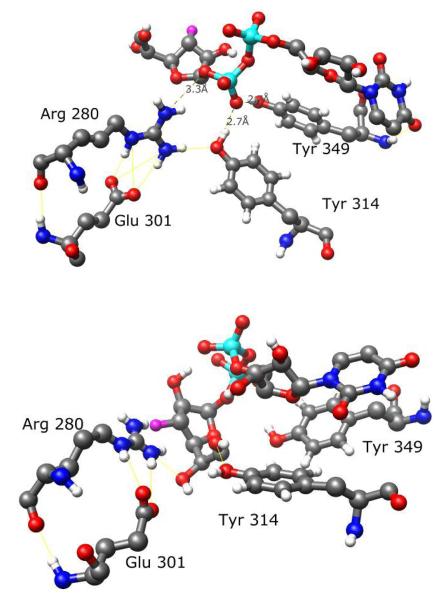
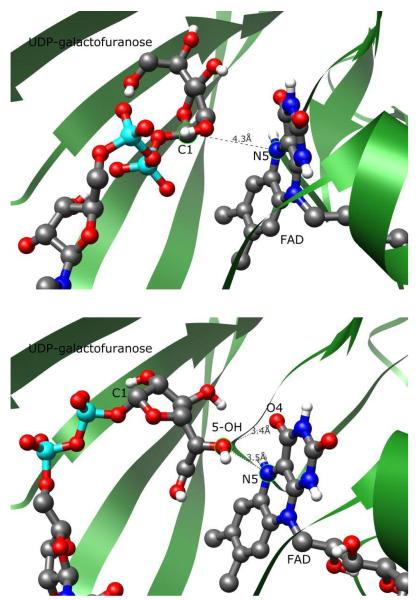
Simulations of UDP-Galf 1 and UDP-[3-F]Galf 4 starting from the ligand conformation A showed that both ligands bound in a similar manner. Arg 280 was approximately 3.5 Å from the anomeric oxygen of the galactofuranose ring. Tyr 314 and Tyr 349 were positioned to form strong hydrogen bonds with an oxygen atom of the β-phosphate group. Arg 280 and Tyr 314 were also positioned favorably for hydrogen bonding with each other. Glu 301 was positioned near Arg 280, forming a salt bridge and further stabilizing Arg 280 (Figure 5A), suggesting a role consistent with the mutational studies.48 These interactions, and the additional interaction from Arg 174, would appear to stabilize negative charges on UDP, facilitating its departure during the enzyme-catalyzed reaction. The C1 carbon of the galactofuranose ring of the substrate was about 4.5Å from N5 of the flavin moiety in both cases (Figure 6A).
Figure 5.
Comparison of conserved residues binding UDP-[3-F]Galf 4 in conformation A (above) and conformation B (below). Arg 280, Tyr 314 and Tyr 349 are favorably positioned to stabilize negative charges on UDP in conformation A but not in conformation B. Presumably, such stabilization assists in the departure of UDP during the catalytic reaction.
Figure 6.
Contrast of UDP-Galf 1-flavin interactions in conformations A (above) and B (below). Conformation A positions the C1 carbon of the galactofuranose moiety 4.3 Å from N5, appropriately orientated for a nucleophilic attack. Conformation B moves the orientation of the galactofuranose ring perpendicular to the flavin plane, with C1 7.2 Å away from N5. The 5-OH of the galactose ring is closest to the flavin moiety.
The mobile loop region did not close over the active site of UDP-Galf 1 in conformation B. The ligand shifted significantly from the starting position, moving the C1 carbon of the sugar to over 7 Å away from N5 of the flavin moiety (Figure 6B). This orientation and the lack of loop closure are inconsistent with any proposed enzymatic mechanism. However, the MD simulation of UDP-[3-F]Galf 4 in conformation B did show loop closure over the active site. Comparison with the conformation A binding modes of either UDP-Galf 1 or UDP-[3-F]Galf 4 indicated different interactions with the protein UGM (Figure 7). Arg 280 was now positioned between the 3-F, 5-OH” and 6-OH” groups of the galactofuranose ring, rather than near the β-phosphate group. Tyr 314 was also now hydrogen-bonded to 6-OH”, rather than the phosphate group. For this binding mode, the galactofuranose ring oxygen was closer to N5 of flavin (4 Å) than the C1 carbon (5 Å).
Figure 7.
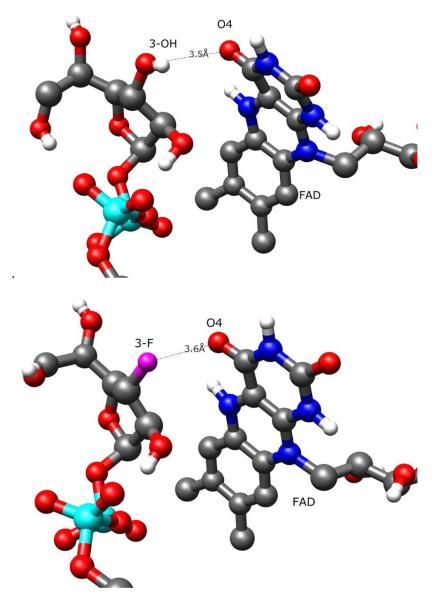
Contrast of UDP-Galf 1-flavin (above) and UDP-[3-F]Galf 4-flavin (below) interaction in conformation A. As fluorine is unable to act as a hydrogen bond donor, the favorable 3-OH hydrogen bond of 1 is replaced by an unfavorable charge-charge interaction. Note that the isoalloxazine moiety is more planer in the latter structure, corroborating the presence of a repulsive electrostatic interaction.
The MD studies suggest that UDP-Galf 1 binds only in conformation A, with the loop closed. This is consistent with the proposed mechanism, optimizing the ability of UGM to stabilize UDP as a leaving group and lowering the required activation energy for isomerization. UDP-[3-F]Galf 4, however, may bind in both conformations A and B, with the loop closed. The conserved residues about UDP-[3-F]Galf 4 in conformation B are not as optimally positioned to assist in the departure of the UDP portion of the ligand. By inference, conformation B is expected to be non-productive and exhibit slow substrate turnover.
Experimental validation of binding models
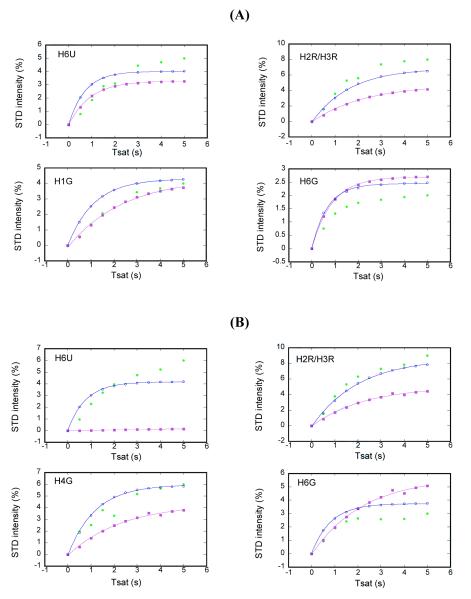
Averaged atomic positions generated from the final 1 ns of MD simulations were chosen to carry out the CORCEMA-ST calculations. For conformations A and B of UDP-Galf 1 and UDP-[3-F]Galf 4, the theoretical STD effect of each proton at different saturation times was calculated with the CORCEMA-ST program and compared with the corresponding experimental result. The comparisons based on experimental points from multiple saturation times are expected to increase the rigor of CORCEMA-ST predictions and minimize the potential of over-fitting parameters. Figure 8 gives several examples of the comparisons, which show that the STD intensity of each proton on the ligand builds up with a different pattern, dependent on its relaxation time and its proximity to the binding site. For example, the calculations for H1R, H5G and H6G predicted that the STD values of H5G and H6G were not only lower than that of H1R but also reached their plateaus much faster, which is consistent with the experimental STD buildup curve.
Figure 8.
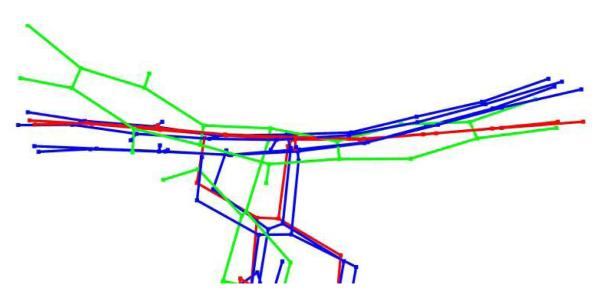
Overlap of averaged atomic positions of reduced FAD in molecular dynamics simulations. Low energy conformations of reduced flavin are bent at the center ring of the isoalloxazine moiety. UDP-[3-F]Galf 4-flavin of conformation A, colored red, has the flattest isoalloxazine moiety, while UDP-Galf 1-flavin of conformation A, colored green, has the most bent structure. The difference is speculated to arise from unfavorable interactions of negative charges on 3-F of UDP-[3-F]Galf 4 with O4 of FAD as opposed to hydrogen bonding of the 3-OH” of UDP-Galf 1 with O4 of FAD. The FAD structures from both ligands in conformation B are shown in blue for comparison.
For UDP-Galf 1, most of the protons in the uridine moiety of conformation A exhibited better fitting between theoretical and experimental STD values than those of conformation B. Conformation A gave a slightly lower R-factor than conformation B (0.34 vs. 0.42, respectively). However, conformation B showed better fitting for the protons in the galactofuranose moiety of 1. Separate 6 ns MD simulations involving the UDP-galactopyranose sugar complexed with UGM (results not shown), had the sugar ring settle in conformations analogous to either conformation A or B, dependent only on the randomization seed chosen for the simulation. These results suggest that both conformations have significant populations in solution and may account for the CORCEMA-ST R-values of about 0.4 for both conformations, a value considered to be representative of a medium resolution structure.27 However, the results from MD simulations described above suggest that only conformation A will lead to a productive encounter because the loop is closed.
For UDP-[3-F]Galf 4, most of the protons in conformation A showed better fitting than those in conformation B. Thus, an R-factor of 0.37 was generated for conformation A whereas conformation B gave a higher R-factor of 0.54. Thus, the combination of STD experiments, MD calculations and CORCEMA-ST calculations infer that conformation A represents the binding mode of 4 that will lead to a productive encounter.
Our results provide more insight into ligand binding and the mode of action of UGM. In the active site of UGM, two natural substrates, UDP-Galf 1 and UDP-Galp 2, are located in the same region, with similar binding epitopes. When UGM is in itsoxidized state, the binding affinities of these two ligands and the 3-fluorinated analogue 4 are in the same range, suggesting that the binding of ligands to the oxidized enzyme is dominated by the uridine moiety. Inhibitors, such as UDP 3 (KD value of 22 μM), can replace these ligands because of its stronger binding affinity to the enzyme.47 However, once the enzyme has been activated via reduction of FAD, the binding affinity of UDP-Galp 2 increases significantly and undergoes turnover by UGM.
Previous studies have shown that the Km values of UDP-Galf 1 and UDP-[3-F]Galf 4 are 22 μM and 861 μM, respectively, while the kcat values were 27 s−1 and 5.7 s−1.15 Given these values, it is apparent that the affinity of UDP-Galf 1 for the Michaelis complex with UGM is greater than the affinity of UDP-[3-F]Galf 4 for the Michaelis complex. Based on the assumption that conformation A is the active conformation of the ligand, the relative affinities of UDP-Galf 1 and UDP-[3-F]Galf 4 can be rationalized. The 3-OH” group of UDP-Galf 1 is positioned as a weak hydrogen-bond donor to O4 of flavin (Figure 7A). For UDP-[3-F]Galf 4 the favorable hydrogen-bonding interaction has been replaced by an unfavorable electrostatic interaction between 3-F and O4 of the isoalloxazine moiety of the reduced flavin (Figure 7B). It is worthy of note that the isoalloxazine moiety in the complex of 4 is flattened, presumably caused by the electrostatic repulsion between the 3-F and O4 atom. In oxidized FAD, the entire isoalloxazine moiety is held planer by resonance, which increases the distance of flavin-O4 from the ligand, decreasing the effect of these interactions. Competition STD experiments showed a smaller affinity difference between compounds 1 and 4 under oxidizing conditions, in agreement with the proposed explanation. The isoalloxazine moiety from the UGM-UDP-[3-F]Galf 4 conformation A simulation was the most flat of all four MD simulations (Figure 9). As the simulations are classical in nature, the effects described above may be exaggerated, however, as FAD was unable to tautomerize. An FAD tautomer that moves the hydrogen from N3 onto O4 would allow an F-H hydrogen bond with 3-F of UDP-[3-F]Galf 4. For this FAD tautomer, UDP-Galf 1 could still maintain hydrogen-bonding interactions between the hydroxyl groups of the FAD and the ligand, so the influence on UDP-Galf 1 is probably small, and the difference in binding energies of the two ligands would be smaller. Since both tautomers of FAD are likely to be significantly populated, the qualitative hydrogen-bonding and charge effects shown in Figure 9 are expected to be meaningful, but exaggerated, for the comparison of UDP-Galf 1 and UDP-[3-F]Galf 4 binding to UGM.
Figure 9.
Comparison of experimental (green) and predicted STD values from the CORCEMA-ST protocol for two binding models A (blue) and B (magenta) of UDP-Galf 1 (A) and UDP-[3-F]Galf 4 (B) in the presence of UGM (U:Uracil; R:Ribose; G: Galactofuranose).
Implication of the results for enzyme mechanism
The results corroborate the existence of a mobile loop in the UGM enzyme which closes over the active site during catalysis. The closure of the loop over the active site will have two effects. The first effect will be to position Arg 174 in proximity to the substrate, aiding in charge stabilization of the UDP as a leaving group. The second effect of the tight-binding loop closure over the active site would be to prevent diffusion of UDP 3 out of the active site (Scheme 1). The lack of structural changes between the reduced and oxidized crystal structures of UGM suggests that the increased affinity of UDP-Galf 1 upon reduction of UGM in comparison with UDP 3 is due to the covalent bond formation between galactose C1 and FAD-N5 rather than any other structural changes in the active site. We suggest that the redox-switched affinity of reduced UGM for UDP-Galp 2 over UDP 3 might result from formation of the covalent flavin-Galp adduct (Scheme 1) that more closely resembles the transition state in the enzyme-catalyzed reaction.
CONCLUSIONS
The binding modes of UDP-Galf 1 and its C3- fluorinated analogue, UDP-[3-F]Galf 4, to UGM have been established by STD-NMR experiments and molecular dynamics simulations. Two different binding modes of the two ligands are supported, one of which is non-productive with respect to reaction. Experimental validation of calculated STD effects based on the MD results allows these structural models to be distinguished. The refined structural models provide detailed information about the relationship between the structure of ligands and activity of the enzyme. Thus, UDP-[3-F]Galf 4 can populate two conformational families with the loop closed, only one of which can readily give rise to products. On the other hand, UDP-Galf 1 only exists in the “productive” conformation with the loop closed, thus accounting for the lower catalytic turnover of UDP-[3-F]Galf 4 by UGM. Such insight into the mechanism of action of this important enzyme can be used to advantage in the design of the next-generation inhibitors of UGM.
Supplementary Material
Chart 1.
ACKNOWLEDGMENTS
We are grateful to Dr. N. R. Krishna for providing the CORCEMA-ST program. We also thank Dr. T. L. Lowary for a generous gift of UDP-Galf.
FUNDING This work was supported by Discovery Grants administered by the Natural Sciences and Engineering Research Council of Canada to both BMP and DARS, and a grant from the National Institutes of Health (GM54346) to HWL.
ABBREVIATIONS
- Galf
galactofuranose
- Galp
galactopyranose
- UMP
uridine 5′-monophosphate
- UDP-Galp
UDP-D-galactopyranose
- UDP-Galf
UDP-D-galactofuranose
- UDP-[3-F]Galf
UDP-3′′-deoxy-3′′-fluoro-D-galactofuranose
- UGM
uridine 5′-diphosphate 1-galactopyranose mutase
- FAD
flavin adenine dinucleotide
- MD
molecular dynamics
- NMR
nuclear magnetic resonance
- STD
saturation-transfer difference
- TOCSY
total correlation spectroscopy
- CORCEMA-ST
complete relaxation and conformational exchange matrix analysis of saturation transfer.
Footnotes
SUPPORTING INFORMATION AVAILABLE STD build-up curves for UDP-Galf 1 and UDP-[3-F]Galf 4. Titrations curves for the competitive binding of UDP-Galf 1 or UDP-[3-F]Galf 4 with UDP 3 to UGM. Details on CORCEMA-ST calculations. Calculated energies of UDP-Galf 1 and UDP-[3-F]Galf 4 docked in the active site of UGM. This material is available free of charge via the Internet at http://pubs.acs.org.
REFERENCES
- 1.World Health Organization . Fact Sheet No. 104. World Health Organization, G.; 2002. [Google Scholar]
- 2.Duncan K. Current Pharmaceutical Design. 2004;10:3185–3194. doi: 10.2174/1381612043383223. [DOI] [PubMed] [Google Scholar]
- 3.Scherman MS, Winans KA, Stern RJ, Jones V, Bertozzi CR, McNeil MR. Antimicrob. Agents Chemother. 2003;47:378–382. doi: 10.1128/AAC.47.1.378-382.2003. [DOI] [PMC free article] [PubMed] [Google Scholar]
- 4.Stevenson G, Neal B, Liu D, Hobbs M, Packer NH, Batley M, Redmond JW, Lindquist L, Reeves P. J. Bacteriol. 1994;176:4144–4156. doi: 10.1128/jb.176.13.4144-4156.1994. [DOI] [PMC free article] [PubMed] [Google Scholar]
- 5.Nassau PM, Martin SL, Brown RE, Weston A, Monsey D, McNeil MR, Duncan K. J. Bacteriol. 1996;178:1047–1052. doi: 10.1128/jb.178.4.1047-1052.1996. [DOI] [PMC free article] [PubMed] [Google Scholar]
- 6.Kremer L, Dover LG, Morehouse C, Hitchin P, Everett M, Morris HR, Dell A, Brennan PJ, McNeil MR, Flaherty C, Duncan K, Besra GS. J. Biol. Chem. 2001;276:26430–26440. doi: 10.1074/jbc.M102022200. [DOI] [PubMed] [Google Scholar]
- 7.Rose NL, Completo GC, Lin SJ, McNeil M, Palcic MM, Lowary TL. J. Am. Chem. Soc. 2006;128:6721–6729. doi: 10.1021/ja058254d. [DOI] [PubMed] [Google Scholar]
- 8.de Lederkremer RM, Colli W. Glycobiology. 1995;5:547–552. doi: 10.1093/glycob/5.6.547. [DOI] [PubMed] [Google Scholar]
- 9.Zhang QB, Liu HW. J. Am. Chem. Soc. 2000;122:9065–9070. [Google Scholar]
- 10.Sanders DAR, Staines AG, McMahon SA, McNeil MR, Whitfield C, Naismith JH. Nature Structural Biology. 2001;8:858–863. doi: 10.1038/nsb1001-858. [DOI] [PubMed] [Google Scholar]
- 11.Beis K, Srikannathasan V, Liu H, Fullerton SWB, Bamford VA, Sanders DAR, Whitfield C, McNeil MR, Naismith JH. J. Mol. Biol. 2005;348:971–982. doi: 10.1016/j.jmb.2005.02.057. [DOI] [PMC free article] [PubMed] [Google Scholar]
- 12.Soltero-Higgin M, Carlson EE, Gruber TD, Kiessling LL. Nature Structural & Molecular Biology. 2004;11:539–543. doi: 10.1038/nsmb772. [DOI] [PubMed] [Google Scholar]
- 13.Pongdee R, Liu HW. Bioorg. Chem. 2004;32:393–437. doi: 10.1016/j.bioorg.2004.06.012. [DOI] [PubMed] [Google Scholar]
- 14.Barlow JN, Blanchard JS. Carbohydr. Res. 2000;328:473–480. doi: 10.1016/s0008-6215(00)00135-x. [DOI] [PubMed] [Google Scholar]
- 15.Zhang QB, Liu HW. J. Am. Chem. Soc. 2001;123:6756–6766. doi: 10.1021/ja010473l. [DOI] [PubMed] [Google Scholar]
- 16.Zhang QB, Liu HW. Bioorg. Med. Chem. Lett. 2001;11:145–149. doi: 10.1016/s0960-894x(00)00616-8. [DOI] [PubMed] [Google Scholar]
- 17.Sadeghi-Khomami A, Blake AJ, Wilson C, Thomas NR. Organic Letters. 2005;7:4891–4894. doi: 10.1021/ol0517877. [DOI] [PubMed] [Google Scholar]
- 18.Caravano A, Sinay P, Vincent SP. Bioorg. Med. Chem. Lett. 2006;16:1123–1125. doi: 10.1016/j.bmcl.2005.11.106. [DOI] [PubMed] [Google Scholar]
- 19.Huang ZH, Zhang QB, Liu HW. Bioorg. Chem. 2003;31:494–502. doi: 10.1016/j.bioorg.2003.08.002. [DOI] [PubMed] [Google Scholar]
- 20.Fullerton SWB, Daff S, Sanders DAR, Ingledew WJ, Whitfield C, Chapman SK, Naismith JH. Biochemistry. 2003;42:2104–2109. doi: 10.1021/bi027077f. [DOI] [PubMed] [Google Scholar]
- 21.Peng JW, Moore J, Abdul-Manan N. Prog. Nucl. Magn. Reson. Spectrosc. 2004;44:225–256. [Google Scholar]
- 22.Mayer M, Meyer B. J. Am. Chem. Soc. 2001;123:6108–6117. doi: 10.1021/ja0100120. [DOI] [PubMed] [Google Scholar]
- 23.Morris GM, Goodsell DS, Halliday RS, Huey R, Hart WE, Belew RK, Olson AJ. J. Comput. Chem. 1998;19:1639–1662. [Google Scholar]
- 24.Jayalakshmi V, Krishna NR. J. Magn. Reson. 2002;155:106–118. doi: 10.1006/jmre.2001.2499. [DOI] [PubMed] [Google Scholar]
- 25.Wen X, Yuan Y, Kuntz DA, Rose DR, Pinto BM. Biochemistry. 2005;44:6729–6737. doi: 10.1021/bi0500426. [DOI] [PubMed] [Google Scholar]
- 26.Yuan Y, Wen X, Sanders DAR, Pinto BM. Biochemistry. 2005;44:14080–14089. doi: 10.1021/bi0513406. [DOI] [PubMed] [Google Scholar]
- 27.Krishna N. Rama, Jayalakshmi V. Prog. Nucl. Magn. Reson. Spectrosc. 2006;49:1–25. [Google Scholar]
- 28.Lindahl E, Hess B, van der Spoel D. Journal of Molecular Modeling. 2001;7:306–317. [Google Scholar]
- 29.Mayer M, Meyer B. Angewandte Chemie-International Edition. 1999;38:1784–1788. doi: 10.1002/(SICI)1521-3773(19990614)38:12<1784::AID-ANIE1784>3.0.CO;2-Q. [DOI] [PubMed] [Google Scholar]
- 30.Claasen B, Axmann M, Meinecke R, Meyer B. J. Am. Chem. Soc. 2005;127:916–919. doi: 10.1021/ja044434w. [DOI] [PubMed] [Google Scholar]
- 31.Pettersen EF, Goddard TD, Huang CC, Couch GS, Greenblatt DM, Meng EC, Ferrin TE. J. Comput. Chem. 2004;25:1605–1612. doi: 10.1002/jcc.20084. [DOI] [PubMed] [Google Scholar]
- 32.Berendsen HJC, Postma JPM, van Gunsteren WF, Hermans J. In: Intermolecular Forces. Pullman B, editor. Riedel; Dordrecht: 1981. pp. 331–342. [Google Scholar]
- 33.Oostenbrink C, Villa A, Mark AE, Van Gunsteren WF. J. Comput. Chem. 2004;25:1656–1676. doi: 10.1002/jcc.20090. [DOI] [PubMed] [Google Scholar]
- 34.Hess B, Bekker H, Berendsen HJC, Fraaije J. J. Comput. Chem. 1997;18:1463–1472. [Google Scholar]
- 35.Essmann U, Perera L, Berkowitz ML, Darden T, Lee H, Pedersen LG. J. Chem. Phys. 1995;103:8577–8593. [Google Scholar]
- 36.Darden T, York D, Pedersen L. J. Chem. Phys. 1993;98:10089–10092. [Google Scholar]
- 37.Berendsen HJC, Postma JPM, Vangunsteren WF, Dinola A, Haak JR. J. Chem. Phys. 1984;81:3684–3690. [Google Scholar]
- 38.Jayalakshmi V, Krishna NR. J. Am. Chem. Soc. 2005;127:14080–14084. doi: 10.1021/ja054192f. [DOI] [PubMed] [Google Scholar]
- 39.Jayalakshmi V, Biet T, Peters T, Krishna NR. J. Am. Chem. Soc. 2005;127:7261–7261. [Google Scholar]
- 40.Bhunia A, Jayalakshmi V, Benie AJ, Schuster O, Kelm S, Krishna NR, Peters T. Carbohydr. Res. 2004;339:259–267. doi: 10.1016/j.carres.2003.09.021. [DOI] [PubMed] [Google Scholar]
- 41.Yao X, Bleile DW, Yuan Y, Cho J, Sarathy KP, Sanders DAR, Pinto BM, O’Neill MA. 2007 unpublished results. [Google Scholar]
- 42.Mayer M, James TL. J. Am. Chem. Soc. 2004;126:4453–4460. doi: 10.1021/ja0398870. [DOI] [PubMed] [Google Scholar]
- 43.Yan JL, Kline AD, Mo HP, Shapiro MJ, Zartler ER. J. Magn. Reson. 2003;163:270–276. doi: 10.1016/s1090-7807(03)00106-x. [DOI] [PubMed] [Google Scholar]
- 44.Lee R, Monsey D, Weston A, Duncan JK, Rithner C, McNeil M. Anal. Biochem. 1996;242:1–7. doi: 10.1006/abio.1996.0419. [DOI] [PubMed] [Google Scholar]
- 45.Benie AJ, Moser R, Bauml E, Blaas D, Peters T. J. Am. Chem. Soc. 2003;125:14–15. doi: 10.1021/ja027691e. [DOI] [PubMed] [Google Scholar]
- 46.Cheng Y, Prusoff WH. Biochem. Pharmacol. 1973;22:3099–3108. doi: 10.1016/0006-2952(73)90196-2. [DOI] [PubMed] [Google Scholar]
- 47.Soltero-Higgin M, Carlson EE, Phillips JH, Kiessling LL. J. Am. Chem. Soc. 2004;126:10532–10533. doi: 10.1021/ja048017v. [DOI] [PubMed] [Google Scholar]
- 48.Chad JM, Sarathy KP, Gruber TD, Addala E, Kiessling LL, Sanders DAR. Biochemistry. 2007;46:6723–6732. doi: 10.1021/bi7002795. [DOI] [PubMed] [Google Scholar]
Associated Data
This section collects any data citations, data availability statements, or supplementary materials included in this article.


