Abstract
Doxazolidine (Doxaz) is a functionally distinct formaldehyde conjugate of doxorubicin (Dox) that induces cancer cell death in Dox-sensitive and resistant cells. Pentyl PABC-Doxaz (PPD) is a prodrug of Doxaz that is activated by carboxylesterase 2 (CES2), which is expressed by liver, non-small cell lung, colon, pancreatic, renal, and thyroid cancer cells. Here, we demonstrate that in two murine models, PPD was effective at slowing tumor growth and demonstrated markedly reduced cardiotoxic and nephrotoxic effects, as well as better tolerance, relative to Dox. Hepatotoxicity, consistent with liver expression of the murine CES2 homolog, was induced by PPD. Unlike irinotecan, a clinical CES2-activated prodrug, PPD produced no visible gastrointestinal damage. Finally, we demonstrate that cellular response to PPD may be predicted with good accuracy using CES2 expression and Doxaz sensitivity, suggesting that these metrics may be useful as clinical biomarkers for sensitivity of a specific tumor to PPD treatment.
Introduction
Doxorubicin (Doxa) is an anthracycline antitumor drug that functions primarily as a topoisomerase 2 poison to induce cancer cell death.1,2 Doxazolidine (Doxaz, Scheme 1) is the formaldehyde conjugate of Dox that induces cancer cell death independent of topoisomerase 2 by crosslinking DNA.3,4 Relative to Dox, Doxaz exhibits significantly enhanced toxicity against a wide variety of tumor cell lines, including cell lines resistant to Dox, without increased toxicity to rat cardiomyocytes.3 A long-standing goal in Dox research has been to minimize the treatment-limiting, chronic, irreversible cardiotoxicity associated with Dox therapy.5 The enhanced tumor selectivity of Doxaz results in an improvement of the theoretical therapeutic index by 100- to 10,000-fold, depending on the cell line tested. The use of Doxaz as a conventional chemotherapeutic agent is unlikely due to its short aqueous half-life of 3 min at 37 °C (pH 7.4) and potent toxicity.4 Measurements by the Developmental Therapeutics Program of the National Cancer Institute of the NIH (NCI-DTP) place the maximum tolerated dose in mice at 0.3 mg/kg upon i.v. injection of a DMSO solution of doxoform (DoxF, Scheme 1), a dimeric prodrug of Doxaz that releases Doxaz with a half-life of approximately 1 min at 37 °C (pH 7.4).4 Further, in cell experiments DoxF exhibits statistically identical growth inhibition as Doxaz.4,6 However, these very problems are elevated to advantages when prodrug delivery of Doxaz is explored.
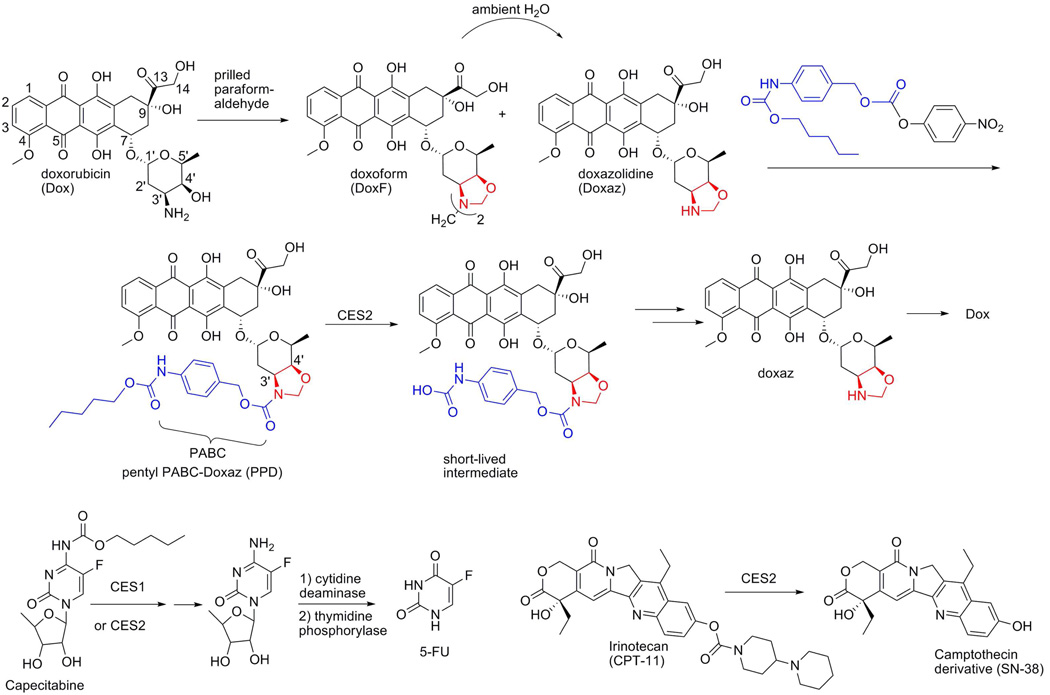
Scheme 1.
Synthesis of pentyl PABC-Doxaz (PPD) from doxorubicin and equations showing the transformation of prodrugs PPD, capecitabine, and irinotecan to active drugs, doxazolidine (Doxaz), 5-fluorouracil, and SN-38, respectively.
Prodrugs are inactive variants of active drugs which, when applied to chemotherapy, are preferentially activated at sites that display properties of tumors or tumor stroma. While Dox has already demonstrated significant preclinical potential from delivery as a prodrug,7 this treatment approach benefits even more when the active drug is unstable and presented for only a short period of time. In these cases, the active agent cannot easily be activated in one region and attack a distant region before it degrades and loses much of its potency. Its instability and potency make Doxaz an ideal candidate for prodrug delivery. Conceptual models for the design of a Doxaz prodrug are capecitabine and irinotecan (Scheme 1) because they are both activated by carboxylesterase-catalyzed hydrolysis of a carbamate functional group, and Doxaz is stabilized with respect to hydrolysis by carbamylation of its oxazolidine nitrogen (Scheme 1).8
Capecitabine is an enzymatically-activated prodrug that was developed to deliver 5-fluorouracil (5-FU) orally.9 5-FU, a nucleotide base analog, is metabolized inside both normal and tumor cells to produce active agents that inhibit the synthesis of thymidine triphosphate and interfere with protein synthesis and RNA processing (reviewed in 10). Capecitabine was first approved in 1998 as a first-line treatment for metastatic colorectal cancer. It is also approved for metastatic breast cancer that is resistant to anthracycline treatments 11 and exhibits a reproducibly better response rate over 5-FU as a single-agent.
Irinotecan was approved by the FDA in 1996 for the treatment of advanced colorectal cancer, either in combination with 5-FU/lecovorin (LV) as a first-line treatment or alone as a second-line treatment following recurrence or progression after 5-FU/LV treatment. Irinotecan was designed as a water soluble delivery method for the camptothecin derivative SN-38, which is released following enzymatic cleavage.12 First identified in a NCI screening protocol in 1966,13 camptothecin soon became recognized as a potent inhibitor of topoisomerase 1.14,15
Release of the active agents from the prodrugs is accomplished, in part, by the carboxylesterase (CE) enzymes CES1 and CES2, members of a class of endoplasmic-reticulum-bound hydrolases normally implicated in xenobiotic detoxification.9,16–18 Targeting to the enzyme is accomplished by the presence of a hydrophobic group, to which the active agent or an inactivating substituent is linked by way of a carbamate moiety (Scheme 1), and hydrolysis of the carbamate results in the release of either SN-38 directly or 5’-deoxy-5-fluorocytidine, which is further processed by two more metabolic enzymes to 5-FU.
The prodrug of Doxaz, pentyl PABC-Doxaz (PPD, Scheme 1), is a pentyl carbamate bearing a Katzenellenbogen spacer 19 to separate the enzyme active site from the active drug and reduce steric hindrance.8 Experiments with recombinant CES1 and CES2 indicate that PPD is predominantly activated to Doxaz by CES2.20 The results of cell-free enzyme experiments are consistent with a correlation of carboxylesterase expression by Western blot with PPD cell growth inhibition. Of particular relevance, rat cardiomyocytes show low expression of CES2 and low growth inhibition, suggesting low potential for cardiotoxicity.20 These findings prompted preclinical in vivo evaluation of PPD in mouse xenograft models using cancer cells that express significant levels of CES2.
Results and Discussion
Cell Experiments
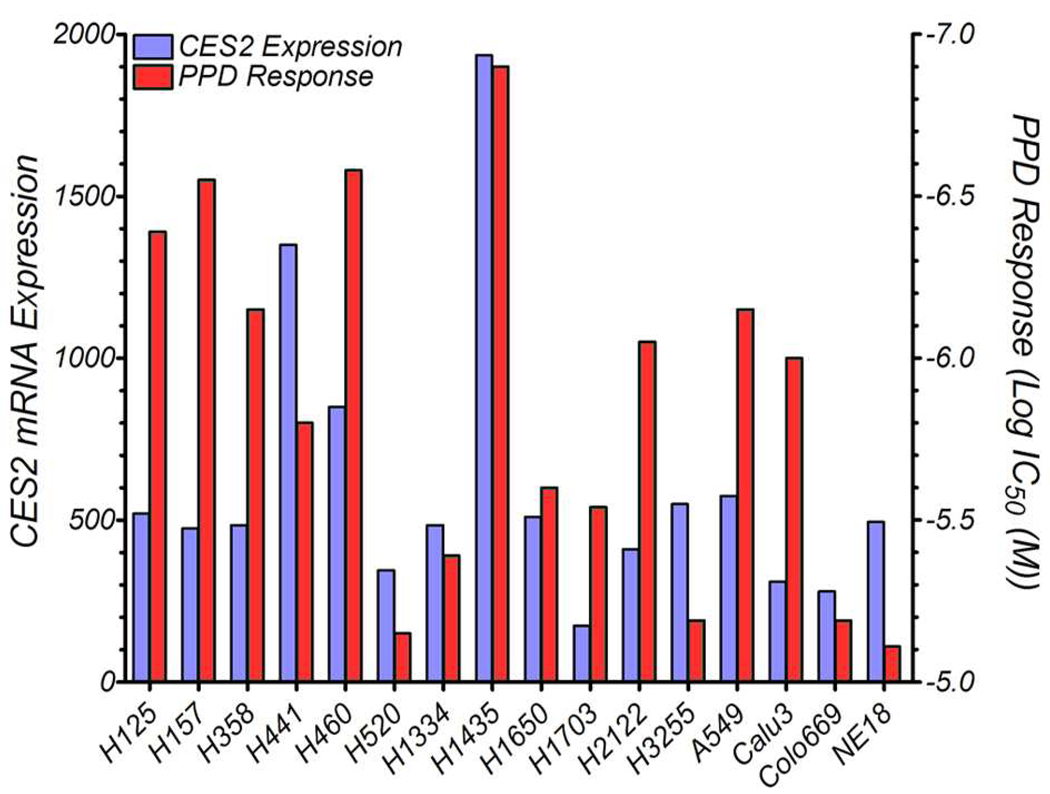
Pentyl PABC-Doxaz (PPD) displays potent in vitro toxicity against cells expressing CES2 and is, therefore, likely to slow the growth of a tumor derived from CES2-expressing cells. Results of previous experiments identified N-Hep G2 hepatocellular carcinoma (HCC) cells as expressing high levels of CES2 in a Western blot analysis and responding to treatment with PPD in a growth inhibition assay.20 To identify a second cancer cell line of a different type that could be used in a xenograft experiment, a panel of non-small cell lung cancer (NSCLC) cells were screened for expression of CES2 mRNA. As shown in Figure 1, H1435 NSCLC cells expressed the highest levels of CES2. Growth inhibition measurements (also Figure 1) indicated that these cells also responded well to treatment with PPD; the response (log IC50 = −6.92) was very similar to the response of N-Hep G2 cells (log IC50 = −6.90). Another promising NSCLC cell line indicated by the results in Figure 1 is H460. This cell line also responded well in the National Cancer Institute 60-cell screen of PPD (log GI50 = −6.35, mean of two determinations).
Figure 1.
Gene transcription array for carboxylesterase 2 with a panel of non-small cell lung cancer cells (NSCLC) and cellular response to pentyl PABC-Doxaz (blue and red, respectively). H1435 cells (center) show the highest CES2 expression and best response to the prodrug.
Animal Studies with PPD
To demonstrate efficacy in an animal model, N-Hep G2 liver cancer and H1435 non-small-cell lung cancer cells were implanted subcutaneously into immunocompromised mice, which were then treated with either Dox or various concentrations of PPD by tail-vein injection. Treatments were initially given as three weekly injections, starting one week after implantation. Subsequent treatments were then performed to measure the efficacy of the drugs at slowing the growth of a rapidly growing tumor.
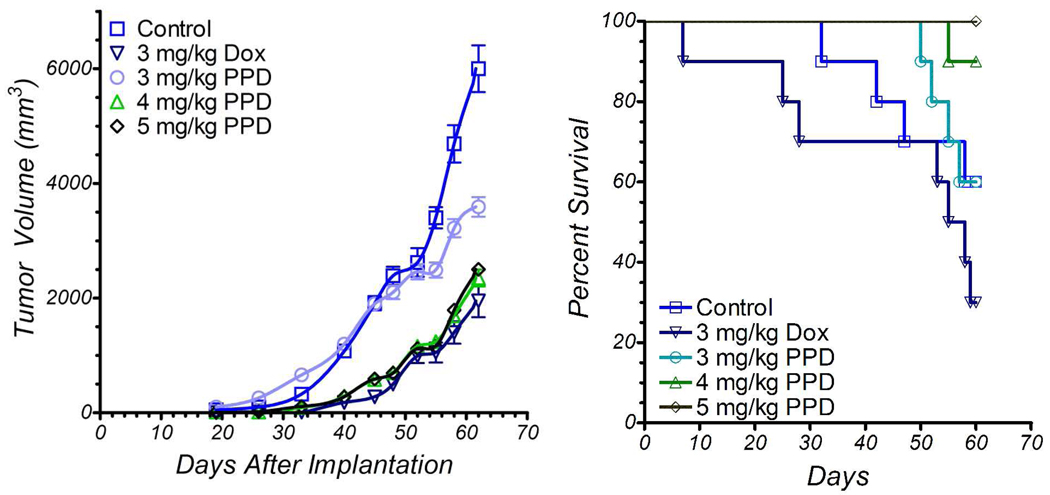
When N-Hep G2 cells were implanted subcutaneously into NOD/SCID mice, the resulting tumors, if untreated, grew quickly as shown in Figure 2. Tumor growth was strongly inhibited by treating the mice with Dox or the higher dosages of PPD, while 3 mg/kg PPD (Dox equiv weight) had no effect. However, when the mice in the 3 mg/kg group were treated with 5 mg/kg PPD on days 45 and 52, the rate of tumor growth was slowed, eventually resulting in an average tumor size nearly identical to those found in the higher dose PPD groups. While Dox had the greatest antitumor effect, it also had the greatest toxicity; 70% of the mice in the treatment group had died by the end of the study (Figure 2). By comparison, all 10 mice survived in the 5 mg/kg PPD group and 9 survived in the 4 mg/kg PPD group. Prior to redosing, 3 mg/kg PPD was well tolerated; after the mice were retreated with 5 mg/kg, however, 60% of the mice were lost by the end of the study.
Figure 2.
Primary liver tumor xenograft growth inhibition and mouse survival as a function of i.v. dose of PPD with 10 NOD/SCID mice per group. Treatment started 7 days after implantation of N-Hep G2 liver cancer cells in mice (left flank). Doses are in mg/kg of doxorubicin equivalent weight. Drug delivery vehicle was 5% DMSO/95% D5W. Control mice received drug delivery vehicle. All 50 mice developed tumors. Mice were treated on days 7, 14, and 21; mice in 3 mg/kg PPD group were redosed at 5 mg/kg on days 45 and 52. Error bars represent one standard deviation.
Body weight changes were monitored during the first 5 weeks of the experiment. Mice treated with 3 and 4 mg/kg PPD (Dox equiv weight) showed similar weight changes relative to no drug control mice. However, mice treated with 5 mg/kg showed 18% weight loss at 3 weeks recovering to 10% at 5 weeks. Dox treated mice showed the most severe weight loss, 23% at 4 weeks recovering to 14% at 5 weeks.
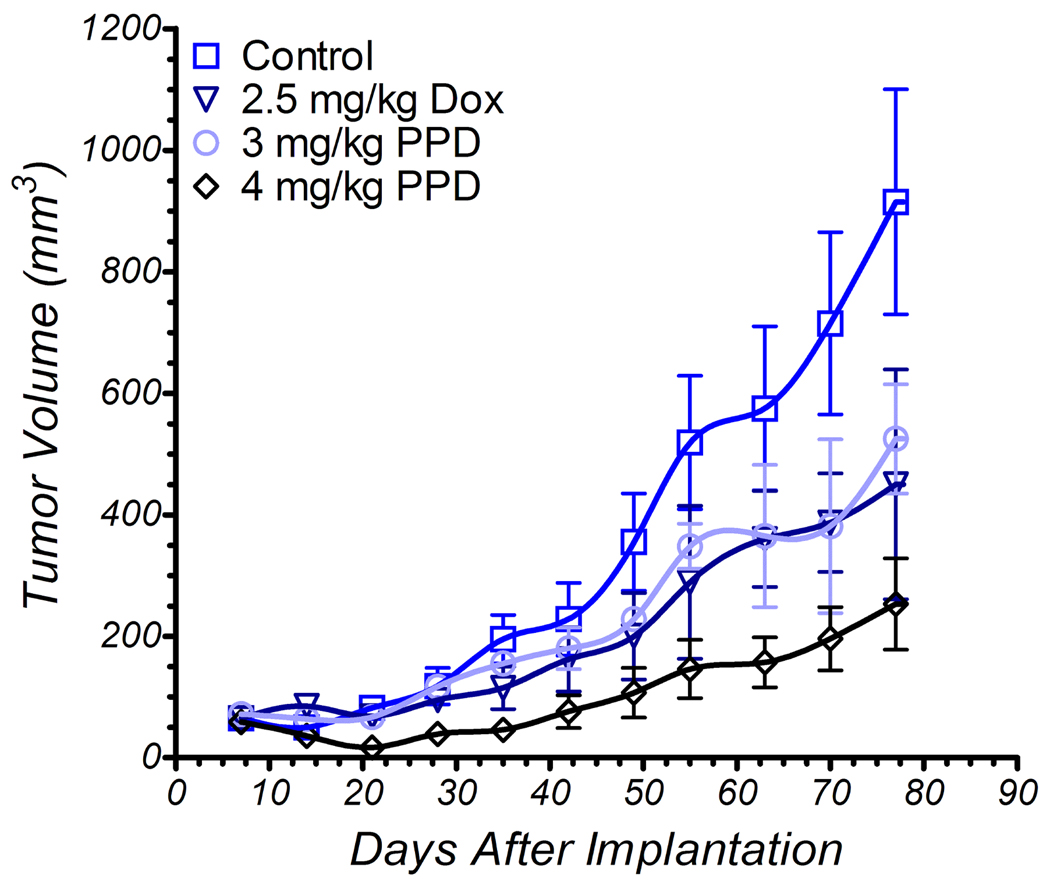
As stated earlier, another cell line that responded well in tissue culture IC50 experiments is the non-small cell lung cancer line H1435 (Figure 1). Cells were subcutaneously implanted into nude mice and treatment started as before, with tail vein injections of either Dox (2.5 mg/kg) or PPD (3 mg/kg or 4 mg/kg Dox equiv weight) on days 7, 14, 21 and retreatment of all groups on days 56, 63, and 70. Shown in Figure 3, tumors were most significantly affected by treatment with the higher dose of PPD, while 3 mg/kg PPD and 2.5 mg/kg Dox produced similar results. Retreatment of the tumors produced a leveling effect on tumor growth in the PPD groups but not the Dox group, suggesting that perhaps the Dox-treated tumors had developed insensitivity to Dox treatment. In this experiment, all mice in all groups survived the duration of the study. During the course of the experiment, two mice in the treatment groups had unplanned pregnancies and delivered healthy babies. This precluded body weight measurements. A treatment limiting side effect of irinotecan therapy is diarrhea because CES2 is also expressed by normal as well as cancer cells in the colon. Further, SN-38 produced in the liver is detoxified by glucuronidation in the liver and excreted to the colon via the bile duct where it is reformed by beta-glucuronidase.21 No evidence of diarrhea appeared in either of the mouse experiments reported here.
Figure 3.
Non small cell lung tumor xenograft growth inhibition as a function of i.v. dose of PPD vs Dox with 10 nude mice per group. Treatment started 7 days after implantation of H1435 NSCLC cells (left flank). Doses are in mg/kg of doxorubicin equivalent weight. Drug delivery vehicle was 5% DMSO/95% D5W. Control mice received drug delivery vehicle. All 40 mice developed tumor. Mice were treated on days 7, 14, 21, 56, 63 and 70. All mice survived to termination. Error bars represent one standard deviation.
Statistical analysis through a repeated measures mixed model for the growth of the H1435 tumors in response to treatment indicated that all treatment groups were significantly different from the untreated group over the entire course of the experiment. This model had invocation for the cubed root of tumor size as that represented the radius for a sphere of the same size in order to have more homogeneous patterns of variability at the respective days of assessment, and it had covariance adjustment for day 7 so as to control for tumor size at the start of treatment. For the experiment as a whole, PPD dosed at either 3mg/kg or 4mg/kg did not show statistically significant reductions in tumor size, as compared to 2.5mg/kg Dox. However, there were significant differences between these PPD doses and 2.5mg/kg Dox for the change in tumor size from days 14 to 28 as an average to days 63 to 77 as an average. In this regard, during the first 5 weeks of the study, which includes the 3 initial treatments and two recovery weeks, PPD dosed at 4mg/kg was much better than treatment with Dox (p= 0.0002), and it was also better than PPD at 3mg/kg (p=0.001) and control (p<0.0001). This indicates that, during the active treatment, PPD is better than Dox at inhibiting tumor growth. Later treatments with 4 mg/kg PPD did not slow tumor growth any better than did 2.5 mg/kg Dox, suggesting that the tumors had adapted during the period from days 21 to 56 to a state in which they were less sensitive to PPD. Since we have never observed a cell line that has developed Doxaz resistance, it seems likely that modulation of the CES2 expression was the mechanism of adaptation. Given the success of PPD over the initial active treatment, however, early and regular treatments show great potential for significant antitumor effect, above those that can be achieved by Dox.
The successful antitumor activity of PPD in this animal model indicates that expression of CES2 in the tumor tissue or stroma may serve as a biomarker for prediction of tumor response to PPD. This status as a biomarker has been conferred upon CES2 previously in regard to success of irinotecan treatment 22 and may be applicable here. This is important because customized and tailored chemotherapeutic regimens, which are directed specifically at properties of the tumor or tumor stroma, may represent the best chance for successful induction of tumor remission in the clinic. Therefore, the identification of a biomarker for success of PPD treatment is a significant addition that provides the basis for future inclusion of PPD in these regimens.
Histological Examination of Tissues
Dox treatment induces a cumulative cardiotoxicity, manifested as vacuolar degeneration of the myocytes and, eventually, necrosis (review23). Although the cardiotoxicity is generally considered the dose-limiting side effect, Dox negatively affects the structure and function of other tissues. Metabolism of Dox in the liver results in hepatotoxic effects. Liver biopsies taken shortly after Dox administration indicate that infiltration of inflammatory cells and steatosis, the accumulation of lipid droplets in hepatocytes, can be indicative of acute Dox hepatotoxicity.24,25 Other damages observed include focal damage to hepatocytes, damage to the vascular structure, and cytoplasmic vacuolization, although many of these effects were induced by Dox injected intraperitoneally at dosages well above the i.v. doses given here.24–26 In the kidney, Dox toxicity is manifested histologically as congestion and degeneration of the convoluted tubules and glomerular damage, such as widening of Bowman’s capsule and capillary dilation.27–29 These effects are likely a result of lipid peroxidation and reactive oxygen species production, similar to the mechanisms of Dox cardiotoxicity.30–33
A predicted outcome of prodrug treatment is that only those cells capable of activating the prodrug will be exposed to the toxic product. Those tissues that lack the activating enzyme will only see the inactive precursor. As CES2 is involved in the detoxification of drugs, it is therefore not surprising that human liver expresses moderate levels of CES2. Similarly, the mouse homolog of CES2, mCES2, is expressed in murine liver.34 Therefore, as a measure of comparative toxicity to treatment with Dox, cardiac, hepatic, and kidney tissues were taken from nude mice in the non-small cell lung cancer model above. Additionally, since the CES2-activated clinical prodrug irinotecan is noted for its gastrointestinal toxicity, the ileum was also collected for analysis. Paraffin-embedded sections from these tissues were stained with hematoxylin and eosin to observe the cellular and tissue morphology.
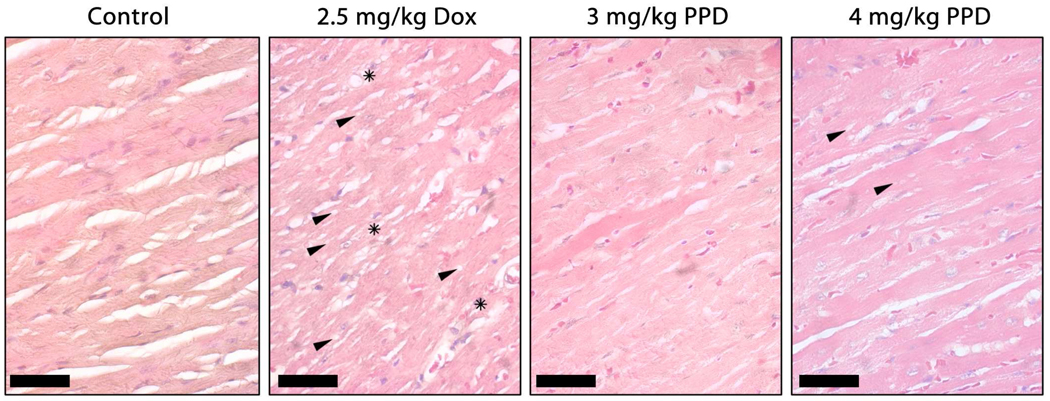
Cardiac tissue from control, tumor-bearing mice appeared healthy, demonstrating well-organized myofibrils with clear interstitial spaces (Figure 4). In contrast, treatment of mice with six i.v. injections of 2.5 mg/kg Dox resulted in extensive myofibril disorganization and severe levels of vacuolization. Regions of cardiomyocyte necrosis were also visible. Further, fibrotic damage was indicated by elevated pink staining in the interstitial spaces, suggesting the presence of collagen. Hearts of mice treated with PPD showed many fewer signs of cardiotoxic effects, exhibiting low-grade, dose-dependent vacuolization and few to no fibrotic regions.
Figure 4.
Micrographs of hematoxylin/eosin stained heart sections as a function of treatment as shown in Figure 3. Hearts from nude mice receiving no drug appeared healthy, demonstrating well-organized myofibrils and clear interstitial spaces. In contrast, treatment with six i.v. injections of 2.5 mg/kg Dox resulted in extensive myofibril disorganization, accompanied by high levels of vacuolization (examples shown with arrows) and regions of cardiomyocyte necrosis (stars). Additionally, fibrotic damage was indicated by the increased presence of pink-stained interstitial spaces. Treatment of mice with PPD resulted in significantly less cardiotoxic indications with low-grade, dose-dependent vacuolar damage (arrows) and little to no fibrotic regions. The bars represent 50 µm.
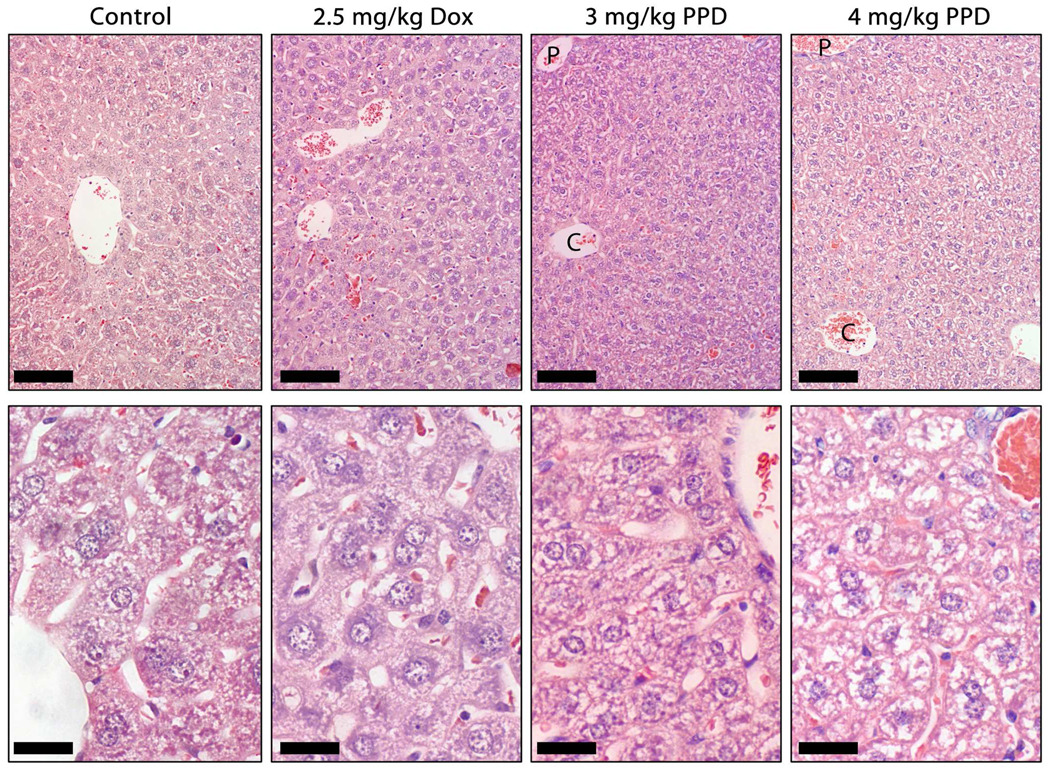
Like cardiac tissue sections, the hepatic tissue sections of the control mice demonstrated a healthy appearance (Figure 5). Low magnification (top panel) revealed well-formed cords of hepatocytes, separated by well-defined sinusoids. At higher magnification (lower panel), the hepatocytes were seen to be stained in a fairly uniformly-distributed punktate-like pattern. A similar pattern was seen for livers from mice treated with 2.5 mg/kg Dox. Little significant difference was noted between Dox and control livers, with the former lacking the periportal hepatocyte damage and disorganization that has been described at higher dosages.24 Treatment of mice with PPD, however, did result in some evidence of hepatotoxicity. A dose-dependent decrease in the uniformity of the punktate staining pattern likely indicates a cytoplasmic buildup of lipid deposits, a possible result of lipid peroxidation by the Dox and Doxaz resulting from prodrug activation. Low magnifications indicated a progression in the severity of damage, from most significant in the periportal regions and decreasing slightly towards the central vein of the classical lobule.
Figure 5.
Micrographs of hematoxylin/eosin stained liver sections as a function of treatment as described in Figure 3. Like cardiac tissue sections, the hepatic tissue sections of the control mice demonstrated a healthy appearance. Low magnification (top panel) revealed well formed cords of hepatocytes, separated by well defined sinusoids. At higher magnification (lower panel), the hepatocytes stained in a fairly uniformly distributed punktate-like pattern. A similar pattern was seen for livers from mice treated with 2.5 mg/kg Dox. Little significant difference was noted between Dox and control livers, with the former lacking the periportal hepatocyte damage and disorganization that has been described at higher dosages. Treatment of mice with PPD, however, did induce some evidence of hepatotoxicity. A dose-dependent decrease in the uniformity of the punktate staining pattern likely indicates a cytoplasmic buildup of lipid deposits, a possible result of lipid peroxidation by the Dox and Doxaz resulting from prodrug activation. Low magnifications indicated a progression in the severity of damage, from most significant in the periportal regions (P) and decreasing slightly towards the central vein (C) of the classical lobule. The bars in the upper panels represent 100 µm and those in the lower panels show 25 µm.
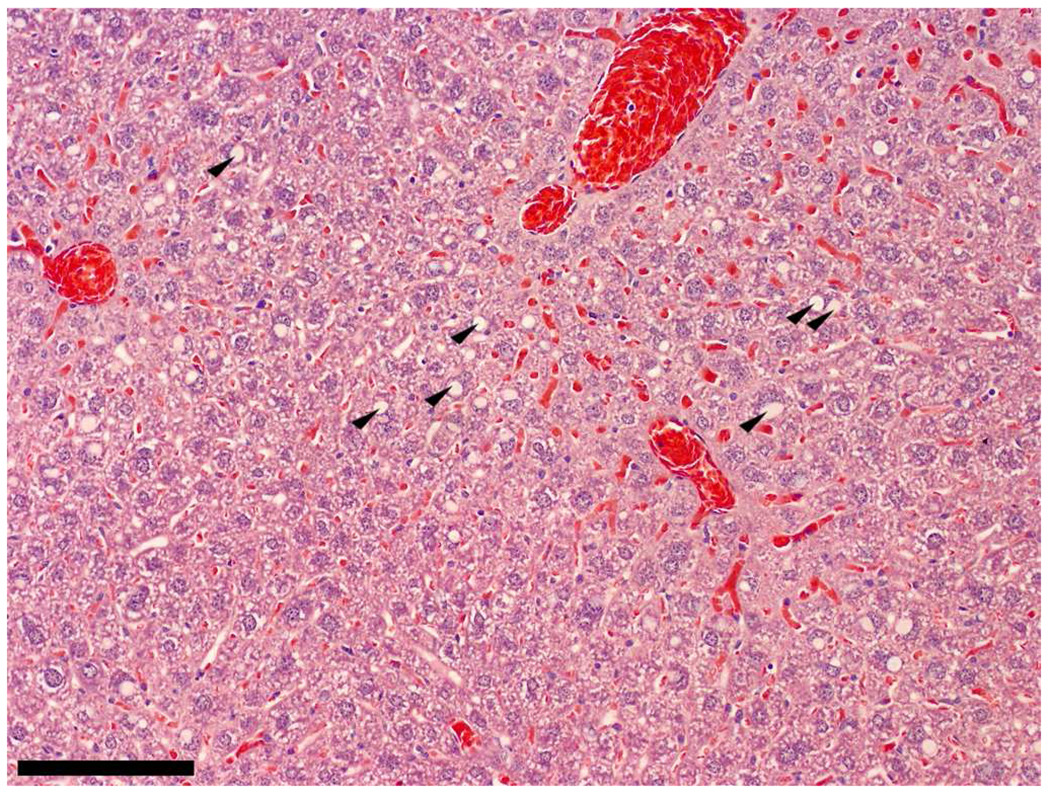
Interestingly, while all liver tissue examined appeared similar for the control, Dox, and 3 mg/kg PPD groups, one of the liver sections from the 4 mg/kg PPD group had a very different look from others in the group of four examined. Shown in Figure 6, sections from this liver had a more typical “fatty-liver” appearance, which is manifested as large spherical deposits of lipids, sometimes engulfing the majority of the cell body. Outside the large deposit, the remaining parts of the hepatocyte exhibited a more normal staining pattern. Perhaps this state represents an earlier stage in the hepatotoxic profile of PPD.
Figure 6.
Periportal regions from one mouse treated with 4 mg/kg PPD displayed classical steatosis in the hematoxylin/eosin stained hepatocytes (arrows). The bar represents 120 µm.
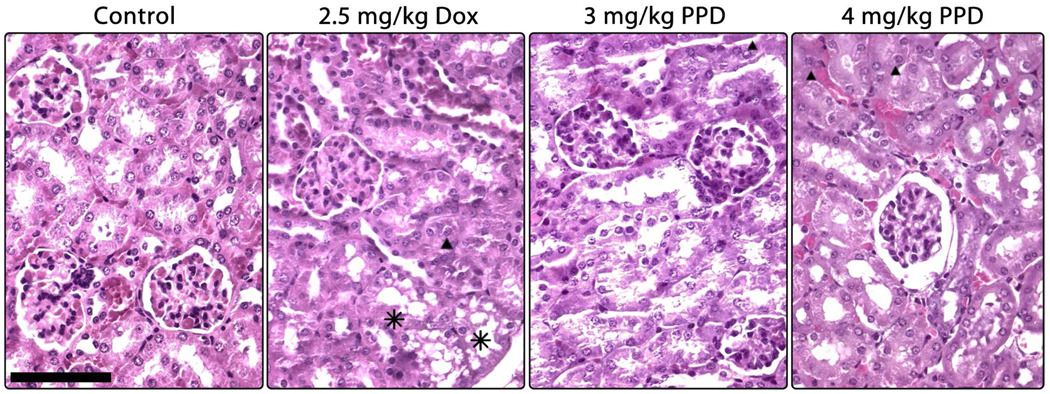
As in cardiac tissue, kidney tissue from mice treated with 2.5 mg/kg Dox exhibited many more toxic effects than control tissue (Figure 7). Degeneration of the tubules due to vacuolar damage was evident, as was congestion of the convolute tubules. By contrast, tissues from mice treated with the prodrug were less affected; there was no vacuolar degeneration in the tissues and infrequent regions of tubular congestion were present in a dose-dependent manner. The higher dose of PPD also resulted in a thickening of Bowman’s capsule in a small subset of glomeruli.
Figure 7.
Micrographs of hematoxylin/eosin stained kidney sections as a function of treatment as described in Figure 3. Tissue from control mice is healthy, exhibiting well-formed tubules, glomeruli, and cells. Treatment with 2.5 mg/kg Dox resulted in the appearance of a vacuolar-like damage (asterisks) and hyaline deposits in a subset of tubules (triangle). Neither prodrug treatment resulted in visible cellular damage, although a dose-dependent congestion of tubules with hyaline deposits (triangles) was evident. Additionally, the higher dose of PPD induced a thickening of Bowman's capsule in a small population of glomeruli, as shown on the right. The bar indicates 200 µm.
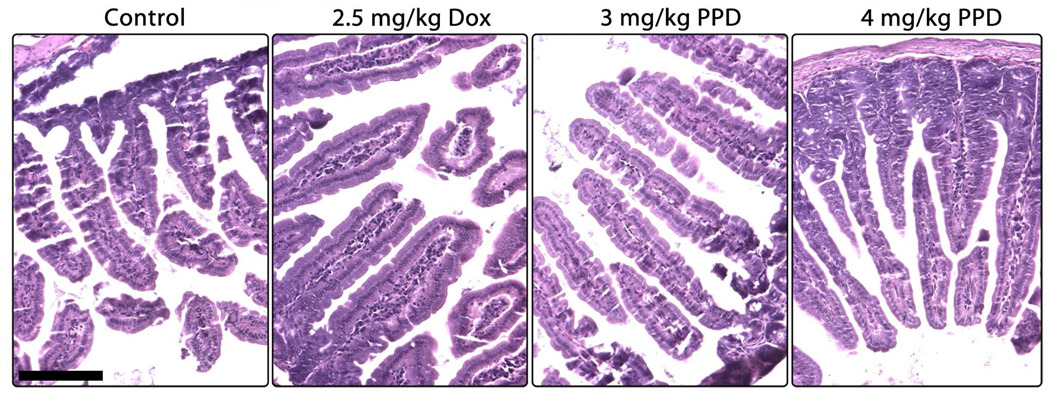
In contrast to irinotecan, which has been shown in the literature to induce severe morphological degradation and destruction of gastrointestinal tissues,35,36 treatment of mice with PPD resulted in no visible damage to the ileum (Figure 8). All four treatment groups demonstrated healthy villi and support structures, with no vacuolar damage or inflammatory cell infiltration.
Figure 8.
Micrographs of hematoxylin/eosin stained ileum sections as a function of treatment as described in Figure 3. Ileum tissue from control mice shows a well-formed villi structure and normal goblet cells. Neither treatment with Dox nor either dosage of pentyl PABC-Doxaz resulted in visible damage. This is in contrast to the literature reports in which treatment with irinotecan resulted in significant damage to the ileum, such as loss of villi and severe disorganization of the tissue, as well as cellular vacuolar damage. The bar indicates 150 µm.
This information, combined with the results of the treatments on tumor size, clearly indicate that PPD is a better treatment for CES2-expressing human tumors in these mouse models. Dosages that result in statistically identical inhibition of tumor growth (2.5 mg/kg Dox and 3 mg/kg PPD) resulted in very different cardiotoxicity profiles. Treatment with Dox was, as expected, much more cardiotoxic than treatment with the prodrug, likely contributing to the better tolerance for the prodrug in the less-hardy NOD/SCID mice used in the HCC model. Although PPD produces greater hepatotoxicity at the cellular level than Dox at equipotent dosages, the regenerative potential of the liver is likely to minimize any detrimental effects of PPD on overall liver function, unless treatment continues over a very long period of time. In a clinical setting, the most significant treatment-limiting side effect of Dox is the cardiotoxicity, an effect that is clearly reduced by treatment with the prodrug. A further encouraging observation for development is the stability of PPD in human plasma versus mouse plasma. Hydrolysis experiments show PPD to be 75% stable in pooled human plasma at 37 °C over a 24 h period but only 16% stable in mouse plasma over a 24 h period, hence the possibility of better efficacy in humans than in tumor bearing mice. Instability of irinotecan in rodent blood is well documented.37–39 Possible applications where CES2 expression has been identified in human tumor tissue include liver, pancreatic, kidney, colon, and thyroid cancer.40 Liver and pancreatic cancers are of particular relevance because of limited treatment options and poor prognosis.
Drug Sensitivity of NCI 60-Tumor Panel
To assess the efficacy of PPD and Doxaz against a wide array of cancer types, they were submitted to the National Cancer Institute Developmental Therapeutics Program (http://www.dtp.nci.nih.gov/) for testing against their panel of 60 human tumor cell lines. Doxaz was delivered as its dimeric form, Doxoform, which degrades quickly to two molecules of Doxaz and results in growth inhibition values that are equivalent within experimental error.4 The panel contains tumor cell lines from leukemia, non-small cell lung, colon, central nervous system, melanoma, ovarian, renal, prostate, and breast origin. The raw growth data for Doxaz and PPD (provided in Supporting Information) was reprocessed by non-linear least-squared analysis, fitting to a variable-slope dose response curve to produce IC50 values for each cell line, while growth data for Dox was pooled from more than 1900 measurements. Over each tumor type tested, Doxaz was more toxic than Dox by between 1 to 2 orders of magnitude (Figure 9A and B). PPD produced growth inhibition values that ranged from greater than 100 µM (log IC50 = −4) to less than 25 nM (log IC50 = −7.6) and averaged, across all tumor lines, about 18 µM (log IC50 = −4.7; Figure 9C).
Figure 9.
Scatter plots of data from NCI 60-Tumor Panel. Growth data for 1938 measurements of Dox (A), 2 measurements of Doxaz (B), and 2 measurements of PPD (C) are shown. The log of the CES2 mRNA expression from 6 selected microarray experiments are also shown (D). The full panel is subdivided into tissue subpopulations. Each point represents the average value of all available measurements for a single cell line. The bars represent the average ± the standard error of the mean for all cell lines in each population.
Since PPD is activated to Doxaz by endogenously expressed CES2, the results for PPD sensitivity should be examined with respect to CES2 expression. Therefore, microarray data for CES2 expression in each cell line in the panel were gathered from experiments deposited with the NCI Developmental Therapeutics Program. As shown in Figure 9D, expression of CES2 tends to be quite variable, not only between tumor types but also within a single type. This is not surprising, given that literature reports suggest that expression of CES2 in human tumors tends to correlate poorly with tumor types, location, or progression.40 However, similarly to Figure 1, those cell lines which show higher CES2 expression, such as the subset above 2.4 in Figure 9D, tend to demonstrate a better response to treatment with PPD; the cells in this subpopulation (H460, HCC-2998, SW-620, SK-OV-3, A498, ACHN, SN12C, TK-10, and UO-31) had an average PPD IC50 that was greater than 17-fold lower than the average IC50 of the rest of the cells in the panel. Additionally, the tissue type with the greatest contribution to the high-CES2 population is the renal panel, which also displays the lowest average PPD IC50 of any tissue type. Therefore, very high CES2 is a good predictor for high sensitivity to PPD treatment and, as stated above, may be useful as a biomarker for in vivo PPD treatment success.
Multiple Regression Analysis of NCI 60-Tumor Panel
While the likelihood of a cell line or population exhibiting high sensitivity to PPD is increased by high CES2 mRNA, many cells do not fit the above simplistic model. For example, Figure 9 demonstrates that the leukemia panel exhibits a better-than-average response to PPD with lower-than-average CES2 expression, indicating that, to predict PPD response, more information than simply CES2 expression must be taken into account. Since PPD is poorly active in cells with low expression of CES2,20 the ultimate effector of cellular toxicity is the product of PPD activation, Doxaz. Therefore, response to PPD depends not only on the level of the activating enzyme present in the cells, but also the innate cellular sensitivity to Doxaz.
To determine the contributions of CES2 and Doxaz on PPD sensitivity, a multiple regression analysis (SAS version 9.1.3) was made using a General Linear Model in which the average of the log of the PPD IC50 is directly proportional to the log of the Doxaz IC50 and inversely proportional to the log of CES2 expression, as measured by mRNA microarrays. This analysis resulted in the equation shown in Table 1 and the full analysis is presented in Supporting Information. The quality and significance of the fit were very good, indicated by a P value of less than 0.0001. The term C3, which is constant for all cells, likely indicates a common physical component, such as the diffusion of PPD across the plasma membrane and the accessibility of CES2 within the endoplasmic reticulum.
Table 1.
Results of Multiple Regression Analysis of Cell IC50 Data and CES2 expression data.
| Equation | ||
|---|---|---|
| Log PPD IC50 = C1(Log Doxaz IC50) − C2(Log CES2 mRNA) + C3 | ||
| Terms | ||
| C1 | C2 | C3 |
| 0.52 ± 0.10 | 3.20 ± 0.53 | 6.59 ± 1.43 |
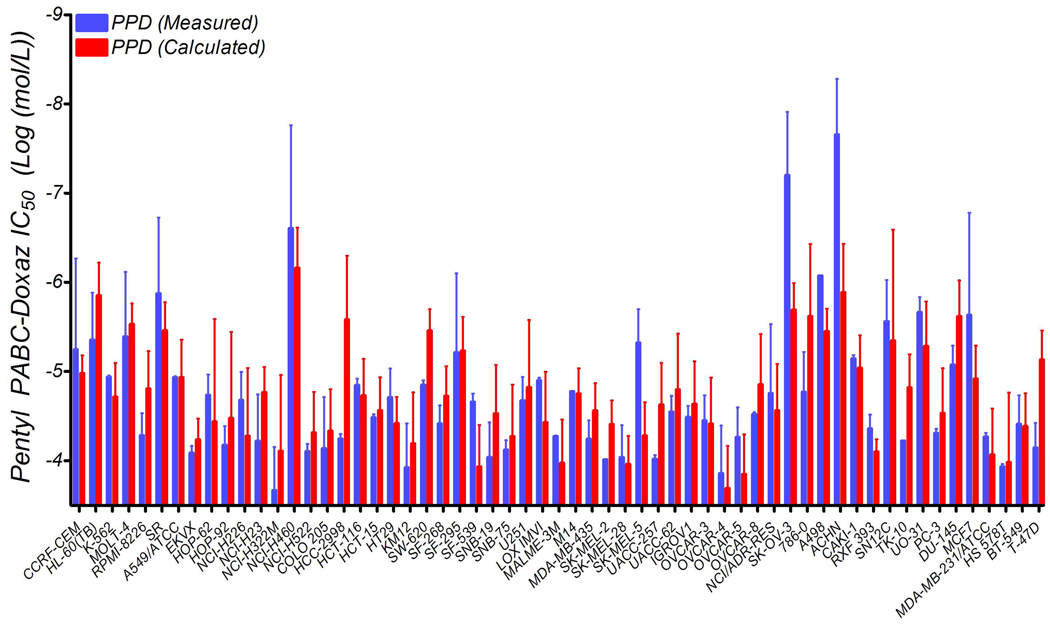
This equation allows for a more refined prediction of cellular response to PPD, as shown in Figure 10. Also, it explains the behavior of cells and populations which contradict the simplistic model of sensitivity based solely upon CES2 expression. In the case of the leukemia panel discussed above, the cells express lower-than-average levels of CES2 but are intensely affected by very low Doxaz concentrations. Therefore, the small amount of Doxaz produced by their endogenous CES2 activity is enough to produce the greater-than-average response to PPD in these very Doxaz-sensitive cells. The model also indicates that a log change in CES2 expression is greater than 6-fold more influential to the PPD response than a log change in Doxaz IC50. We feel that this indicates the ability of CES2 to convert multiple units of PPD into Doxaz. Given that the rate of conversion is quite slow,20 it is unlikely that enough prodrug is hydrolyzed to significantly affect the kinetics of activation. Therefore, more enzyme is able to produce a consistently higher concentration of Doxaz, resulting in a greatly increased cytotoxic effect over the 2-day duration of the treatment. Finally, this model highlights further potential for PPD to be a successful clinical drug; neither high CES2 expression nor high Doxaz sensitivity is necessary, but both are sufficient for a cell line to respond well to PPD treatment. Therefore, either metric has the potential to be used as a marker for in vivo success.
Figure 10.
Prediction of PPD response by incorporating dependence on both CES2 and Doxaz versus the measured value in cell lines from the NCI-DTP 60-tumor panel. Error bars on the measured bars are the standard deviation while those on the calculated bars are the calculated deviations, determined through propagation of errors.
Summary and Conclusions
PPD, the CES2-activated prodrug of Doxaz, effectively inhibited the growth of a subcutaneous human hepatocellular carcinoma xenograft and a subcutaneous human NSCLC xenograft on immuno-compromised mice relative to a no drug control. Both of the cell lines used to create the xenografts were shown to express high levels of CES2. Growth inhibition of the NSCLC xenograft by 4 mg/kg PPD was shown to statistically exceed that of 2.5 mg/kg Dox during the first 5 weeks of the experiment which included the initial three-dose treatment period. Tissue analyses showed significantly less evidence of cardiotoxicity and nephrotoxicity from treatment with PPD than from treatment with Dox. PPD showed more hepatotoxicity consistent with expression of CES2 in normal liver cells. Further evidence for activation of PPD to Doxaz in cancer cells was obtained through correlation of PPD-induced inhibition of growth of the 60 human cancer cells in the NCI screen with Doxaz growth inhibition and expression of CES2 using multiple regression analysis. CES2 expression and response to Doxaz may be useful biomarkers for the efficacy of PPD treatment. Significant tumor growth inhibition in the mouse xenograft experiments is particularly encouraging for further development of PPD given its low stability in mouse plasma versus high stability in human plasma.
Experimental Methods
1. Reagents
Doxorubicin hydrochloride was from a clinical sample manufactured by Bedford Laboratories (Bedford, OH) that contained 20 mg of doxorubicin hydrochloride and 100 mg of lactose. Prilled Paraformaldehyde was purchased from Sigma Aldrich (Milwaukee, WI). D5W was from B. Braun Medical (Irvine, CA) and dimethyl sulfoxide (DMSO) was from Burdick and Jackson (Muskegon, MI).
2. Synthesis of Pentyl PABC-Doxaz (PPD)
The original method for synthesis of the Doxaz prodrug pentyl PABC-Doxaz (PPD) was reported previously.8 However, improvements in the synthesis of Doxaz, which is then used in the synthesis of PPD, are reported here. Expired clinical samples of Dox (20 mg) were provided as lyophilized pellets containing 100 mg lactose monohydrate. The pellet was dissolved in 15 mL saturated sodium bicarbonate (pH ~8.3) and extracted into 50 mL chloroform per 5 Dox samples, each performed individually. The resulting fluffy interface emulsion and the aqueous layer were separated. The aqueous layer was extracted twice more into 50 mL fresh chloroform. The emulsion was diluted with an equal volume of saturated sodium bicarbonate and extracted into an equal volume of chloroform. All chloroform fractions were combined and dried over sodium sulfate, filtered, and rotary evaporated to dryness. The Dox free base was thoroughly dried under high vacuum (10−2 Torr) for a minimum of 2.5 h. Yield was 97%, as measured by optical density in 50% water, 50% DMSO, using a molar extinction coefficient of 11,500 M−1 cm−1. Dox free base (100 mg, 0.18 mmol) was dissolved in deuteriochloroform (Cambridge Isotope Laboratories, Andover, MA) and 1.1–2.0 equiv of prilled paraformaldehyde added. The reaction was stirred at room temperature under an argon atmosphere and monitored by 1H-NMR for completion, typically occurring after 2–3 days. NMR data were reported earlier.4 The amount of paraformaldehyde added determines the ratio of Doxaz to its dimeric form, Doxoform (DoxF), since Doxaz reacts with an additional equiv of formaldehyde to produce DoxF. The reaction mixture, when complete, was filtered and the solvent rotary evaporated. The resulting red solid was dried overnight under high vacuum (10−2 Torr). The product, 65–90% Doxaz, 35-10% DoxF, was not further purified, since DoxF degrades to produce two units of Doxaz, and was recovered in 98% yield. All remaining steps required to make PPD and their resulting yields and purity (>95% by HPLC and 1H NMR) were identical to those described previously.8
3. Cells
N-Hep G2 cells were obtained from Dr. Barbara Knowles at the Jackson Laboratories (Barr Harbor, ME). All the NSCLC cells were obtained from the Colorado SPORE-Lung Program (Paul Bunn, Jr., University of Colorado Denver, Aurora, CO). These lines were maintained in RPMI media supplemented with 10% heat-inactivated fetal bovine serum (FBS) (Hyclone, Logan, UT).
4. Cell Experiments
Inhibition of cell growth by PPD or doxorubicin was assessed using a modified tetrazolium salt (MTT) assay.41 Briefly, 2000–4000 viable cells were plated in 100 µL of growth medium in 96-well plates (Corning, Ithaca, NY) and incubated overnight at 37 °C in a humidified incubator under an atmosphere of 95% air, 5% CO2. PPD was added at various concentrations and the plates were incubated for 5–6 days. The tetrazolium salt (3-(4,5-dimethylthiazol-2-yl)-2,5-diphenyl tetrazolium bromide, Sigma Aldrich) was dissolved in RPMI to a concentration of 4 mg/mL, sonicated, and immediately added to the cells for a final concentration of 0.4 mg/mL. The medium was aspirated after 4 h and the reduced MTT product was solubilized by adding 100 µL of 0.2 N HCl in 75% isopropyl alcohol, 25% milliQ water (Millipore, Inc., Billerica, MA) to each well. Thorough mixing was done using a Titertek multi-channel pipetman. The optical density of each well was measured using an automated plate reader (Molecular Devices, Sunnyvale, CA). Absorbances for treated wells were normalized with the vehicle control and plotted to obtain the IC50 values for each cell line
5. Microarray Analysis of Gene Expression
Microarrays were run using RNA isolated from untreated (baseline) NSCLC cell lines growing in culture. RNA stabilization, isolation and microarray sample labeling were carried out using standard methods for reverse transcription and one round of in vitro transcription.42 HG-U133 set microarrays were hybridized with 10 µg cRNA and processed per the manufacturer’s protocol (Affymetrix, Foster City, CA). Individual arrays were determined to be of high quality by visual inspection, comparison of the overall fluorescence intensity (scaling factor) to other arrays in the group, and low 3’/5’ ratios for GAPDH and β-Actin (ratio < 3). This procedure insures that each of the arrays in the group can be directly compared, and that the input mRNA was intact. Hybridization signals and detection calls were generated in BioConductor, using the “Robust Multi-Array Average” (RMA) expression measure.43 This expression dataset has been deposited in the NCBI Gene Expression Omnibus and is publicly available as accession GSE4342.
6. NOD/SCID N-Hep G2 Xenograft Mouse Model
The in vivo efficacy of PPD, relative to Dox, was initially measured against tumors derived from N-Hep G2 cells in NOD/SCID mice. NOD/SCID mice (4–6 week old females) obtained from the Jackson Labs (Barr Harbor, ME) were maintained in accordance with UCHSC institutional guidelines using an approved IACUC protocol. N-Hep G2 cells (~1.5 × 10⁷ per mouse) were injected subcutaneously in the left flank, and i.v. injection via the tail vein of vehicle, 3 mg/kg Dox, 3 mg/kg PPD Dox-equivalent weight, 4 mg/kg PPD Dox-equivalent weight, or 5 mg/kg PPD Dox-equivalent weight (10 mice group) began one week after cell implantation. Control mice received the delivery vehicle only. PPD or Dox was dissolved in 50 µL of DMSO, to which 950 µL of isotonic water/5% dextrose (D5W) was added immediately prior to injection of 100 µL per mouse. Three rounds of injections were performed, spaced by one week each. Approximate tumor volumes (π × short diameter2 × long diameter / 6) and animal body weight were measured weekly. To determine whether the drugs were capable of slowing the growth of large, rapidly growing tumors, mice in the 3 mg/kg PPD group were treated with 5 mg/kg PPD at days 45 and 52.
7. Stability of PPD in Mouse and Human Plasma
To test for the presence of prodrug-activating activity in the plasma of NOD/SCID mice, 10 µL of a 1 mM DMSO stock solution of PPD was diluted in 190 µL of mouse plasma from healthy mice (thawed from flash frozen stock) and incubated at 37 °C. Aliquots (90 µL) were removed at 0 and 24 h. Proteinase K (2 mg/mL) was added and the reaction incubated at 37 °C for an additional 4 h to avoid incorporating PPD and/or Dox into the precipitated protein, thereby masking it from inclusion in the analysis. PPD was stable to 2 mg/mL proteinase K for 24 h. Following incubation of the prodrug in plasma with proteinase K, the solution was analyzed by C-18 reverse phase HPLC (Agilent 1050/1100 instrument, Santa Clara, CA, with Agilent 4.6 mm i.d. × 15 cm column with 5 µm, C18 packing) eluting with a gradient of 20 mM triethylammonium acetate pH 6.0 buffer with acetonitrile starting at 80% buffer, isocratic to 1 min, to 60% buffer at 5 min, to 20% buffer at 10 min, isocratic to 17 min and detecting at 480 nm. Stability in pooled human plasma from 40 normal individuals (thawed from flash frozen stock, SomaLogic, Inc., Boulder, CO) was similarly determined.
8. Nude Mouse H1435 Xenograft Model
As an additional measure of the antitumor efficacy of PPD, its activity was tested against subcutaneous tumors of H1435 cells, a non-small cell lung cancer (NSCLC) line that responded well by in vitro growth inhibition assays. Athymic nude mice (4–6 week old females) obtained from the National Cancer Institute (Bethesda, MD) were maintained in accordance with UCHSC institutional guidelines using an approved IACUC protocol. H1435 cells were injected into the left flank of each mouse (~2 × 10⁶) at day 0. Owing to the potent systemic toxicity of Dox treatment in the NOD/SCID experiment, the dosage of Dox was reduced for this study. Treatment groups were control, 2.5 mg/kg Dox, 3 mg/kg PPD Dox-equivalent weight, and 4 mg/kg PPD Dox-equivalent weight (10 mice/group). Three i.v. injections were given, separated by a week, starting one week after implantation. As before, the tumor volume was determined by caliper measurement and calculated by the formula: π × short diameter2 × long diameter/6. Due to the unplanned pregnancies of two mice, body weight measurements were not recorded. Retreatment of all groups was performed on days 56, 63, and 70.
9. Statistical analysis of H1435 tumor growth inhibition
The data have the structure of longitudinal repeated measurements with equal sample sizes of 10 for each of the 11 time points for each treatment. Tumor size was calculated so that the cube root represented the radius for the sphere of the same size. The cube roots of the tumor size were analyzed since they had reasonable homogeneity of variance at each point of time for assessment. Since the tumor size measured at day 7 was not affected by treatment, it served as a baseline covariate in the model for tumor size at the beginning of treatment.
The mixed model was used to produce the results for the repeated measurements for the entire course of the experiment.44 Although the covariance structure in the model should be unstructured (UN), 10 time points for post-treatment assessment is excessive for an overall sample size of 40. In accordance with the study design, an appropriate way to perform the analysis is to partition the entire study into three periods (day 14–28, day 35–56, day 63–77) with these representing the beginning, middle and the end of the study. An average was calculated within each period, and so the number of quantities analyzed was reduced to what can be managed by the model. The pattern of treatment differences across three periods has analysis through the model including effects for treatments, periods, treatment × period interaction and day 7 as baseline. This model enabled assessment of overall differences among treatments through the weighted mean of treatment differences across the three periods. It also enabled assessment of heterogeneity of treatment differences across the periods (i.e., treatment × period interaction) through treatment comparisons for the difference between the last period and the first period. Since such heterogeneity was significantly evident (p<0.001), treatment comparisons within each period can have separate assessment through the model. SAS 9.1.3 (SAS Institute, Inc., Cary, NC) was used in conducting all the analysis.
10. Histology
Mice from the second study (H1435 cells into nude mice) were sacrificed by CO2/cervical dislocation. Hearts, livers, kidneys, and sections of the ileum were recovered and fixed in 10% formalin for 24 h. The tissues were embedded in paraffin blocks by the University of Colorado Histology Core facility (Aurora, CO). Tissue sections 4 µm thick were cut and mounted onto glass microscope slides coated with 3-aminopropyltriethyoxysilane (APES; Sigma Aldrich, St. Louis, MO) according the manufacturer’s instructions.
The mounted sections of heart and liver tissues were placed into an oven at 60 °C for 2 h to melt the wax and deparaffinized by soaking in xylenes (10 min, 2 changes), 100% ethanol (5 min), and 95% ethanol (5 min). They were then rinsed in distilled water (5 min) and stained in hematoxylin stain (Mayer’s, Sigma Aldrich) for 2 min. The stained slides were washed in tap water (30 sec) and 1% ammonium hydroxide (5 dips × 1 sec), followed by distilled water (2 min). They were dehydrated in 95% ethanol (5 min) and counterstained with Eosin Yellowish Stain (30 sec, Thermo Fischer Scientific, Waltham, MA). The slides were rinsed in 95% ethanol (1 min), 100% ethanol (2 min, 2 changes), and xylenes (15 min, 2 changes). Coverslips were applied with Permount (Daigger Inc., Vernon Hills, IL).
Kidney and ileum tissues were deparaffinized by 2 changes of xylene (2 min each) and rehydrated with 1 min soaks in ethanol (100%, 2 changes, 95%, 70%), followed by deionized water (1 min). The slides were stained in Harris hematoxylin (Anatech LTD, Battle Creek, MI) for 50 sec. The slides were washed in deionized water (20 sec) followed by two washes of tap water (20 sec each) and five dips into Scott’s Water (1% MgSO4, 0.2% NaHCO3). The tissues were washed with tap water (2 × 20 dips) and dehydrated in 70% ethanol (20 dips). The slides were counterstained with Eosin Y (Anatech, 3 dips) and rinsed with 2 changes of 95% ethanol (6 dips, 12 dips) and 2 changes of 100% ethanol (12 dips, 15 dips). The stained tissues were dehydrated with 2 changes of xylene (20 dips) and coverslips mounted with Richard-Allen Mounting Medium (American MasterTech, Lodi, CA).
11. NCI 60-Tumor Panel
Doxoform, synthesized as described previously and equivalent to Doxaz with respect to toxicity,4 and pentyl PABC-Doxaz were supplied as solid material to the Developmental Therapeutics Program at the NCI. Following their analysis, raw cell growth data for both compounds (NSC numbers 699940 and 741302 for Doxoform/Doxaz and PPD, respectively) was extracted and reprocessed to fit the data to a variable-slope sigmoidal dose-response curve (as opposed to the point-to-point method used by NCI) in GraphPad Prism version 4.0 software (GraphPad Software, Inc., La Jolla, CA). The raw growth data are shown in Supporting Information. As a comparison to both drugs, data for Dox (NSC 123127) were gathered. CES2 expression data were gathered on the basis of 1) Affymetrix U133 series chips, which were used in the NSCLC panel above and 2) multiple experiments by the same lab. With these selection criteria, data for six microarrays were collected: Pattern ID numbers GC174516, GC178011, GC168722, GC228167, GC228168, and GC224427. Multiple regression analysis was performed using SAS version 9.1.3.
Supplementary Material
Acknowledgement
We thank Barbara Knowles at the Jackson Laboratories for N-Hep G2 cells, Paul Bunn, Jr., and the Colorado SPORE-Lung Program for the NSCLC cells, Monique Spillman at University of Colorado Denver for the ovarian cancer cells, and the Developmental Therapeutics Program of the NCI for their 60 cell screen of PPD, doxoform/doxazolidine, and doxorubicin and their measurement of the MTD of doxoform/doxazolidine in mice. We thank Xiaomei Sui for the H&E staining of kidney and colon tissue sections. We acknowledge POC grants from the University of Colorado Office of Technology Transfer and the State of Colorado to THK and DCFC, an IGP grant from the University of Colorado Graduate School to THK, a grant from the Cristol Fund of the Department of Chemistry and Biochemistry to THK, the US NIH for support of BLB under training grant T32 GM008759, and a grant from The Flight Attendants Medical Research Institute to CDC.
Footnotes
Abbreviations: CE, carboxylesterase; CES1, carboxylesterase 1; CES2, carboxylesterase 2; Dox, doxorubicin; Doxaz, doxazolidine; DoxF, doxoform; DTP, Developmental Therapeutics Program; NCI, National Cancer Institute; NSCLC, non-small cell lung cancer; PPD or pentyl PABC-Doxaz, pentyl carbamate of p-aminobenzyl carbamate of doxazolidine.
Supporting Information Available: Statistical analysis of inhibition of H1435 tumor growth, NCI-DTP cell growth inhibition data for Doxaz, NCI-DTP cell growth inhibition data for PPD, and statistical analysis of the cell data.
References
- 1.Pommier Y. Anthracycline Antibiotics: New Analogues, Methods of Delivery, and Mechanisms of Action. Washington, DC: American Chemical Society; 1995. DNA topoisomerases and their inhibition by anthracyclines; pp. 183–203. [Google Scholar]
- 2.Beretta GL, Zunino F. Molecular mechanisms of anthracycline activity. Top. Curr. Chem. 2008;283:1–19. doi: 10.1007/128_2007_3. [DOI] [PubMed] [Google Scholar]
- 3.Kalet BT, McBryde MB, Espinosa JM, Koch TH. Doxazolidine induction of apoptosis by a topoisomerase II-independent mechanism. J. Med. Chem. 2007;50:4493–4500. doi: 10.1021/jm070569b. [DOI] [PMC free article] [PubMed] [Google Scholar]
- 4.Post GC, Barthel BL, Burkhart DJ, Hagadorn JR, Koch TH. Doxazolidine, a proposed active metabolite of doxorubicin that cross-links DNA. J. Med. Chem. 2005;48:7648–7657. doi: 10.1021/jm050678v. [DOI] [PubMed] [Google Scholar]
- 5.Menna P, Salvatorelli E, Minotti G. Anthracycline cardiotoxicity. Top. Curr. Chem. 2008;283:21–44. doi: 10.1007/128_2007_11. [DOI] [PubMed] [Google Scholar]
- 6.Fenick DJ, Taatjes DJ, Koch TH. Doxoform and Daunoform: Anthracyclineformaldehyde conjugates toxic to resistant tumor cells. J. Med. Chem. 1997;40:2452–2461. doi: 10.1021/jm970237e. [DOI] [PubMed] [Google Scholar]
- 7.Kratz F, Warnecke A, Schmid B, Chung D-E, Gitzel M. Prodrugs of anthracylcines in cancer chemotherapy. Curr. Med. Chem. 2006;13:477–523. doi: 10.2174/092986706776055751. [DOI] [PubMed] [Google Scholar]
- 8.Burkhart DJ, Barthel BL, Post GC, Kalet BT, Nafie JW, et al. Design, synthesis, and preliminary evaluation of Doxazolidine carbamates as prodrugs activated by carboxylesterases. J. Med. Chem. 2006;49:7002–7012. doi: 10.1021/jm060597e. [DOI] [PMC free article] [PubMed] [Google Scholar]
- 9.Miwa M, Ura M, Nishida M, Sawada N, Ishikawa T, et al. Design of a novel oral fluoropyrimidine carbamate, capecitabine, which gnerates 5-fluorouracil selectively in tumors by enzymes concentrated in human liver and cancer tissue. Eur. J. Cancer. 1998;34:1274–1281. doi: 10.1016/s0959-8049(98)00058-6. [DOI] [PubMed] [Google Scholar]
- 10.Parker WB, Cheng YC. Metabolism and mechanism of action of 5-fluorouracil. Pharmacol. Ther. 1990;48:381–395. doi: 10.1016/0163-7258(90)90056-8. [DOI] [PubMed] [Google Scholar]
- 11.Walko CM, Lindley C. Capecitabine: A review. Clin. Therap. 2005;27:23–44. doi: 10.1016/j.clinthera.2005.01.005. [DOI] [PubMed] [Google Scholar]
- 12.Kunimoto T, Nitta K, Tanaka T, Uehara N, Baba H, et al. Antitumor activity of 7-ethyl-10-[4-(1-piperidino)-1-piperidino]carbonyloxy-camptothecin, a novel water soluble derivative of camptothecin, against murine tumors. Cancer Res. 1987;47:5944–5947. [PubMed] [Google Scholar]
- 13.Wall ME, Wani MC, Cook CE, Palmer KH. Plant antitumor agents, I: the isolation and structure of camptothecin, a novel alkaloid leukemia and tumor inhibitor from Camptotheca acuminata. J. Am. Chem. Soc. 1966;88:3888–3890. [Google Scholar]
- 14.Hsiang YH, Hertzberg R, Hecht S, Liu LF. Camptothecin induces protein-linked DNA breaks via mammalian DNA topoisomerase I. J. Biol. Chem. 1988;260:14873–14878. [PubMed] [Google Scholar]
- 15.Hsiang YH, Liu LF. Identification of mammalian DNA topoisomerase I as an intracellular target of the anticancer drug camptothecin. Cancer Res. 1988;48:1722–1726. [PubMed] [Google Scholar]
- 16.Bencharit S, Morton CL, Yu X, Potter PM, Redinbo MR. Structural basis of heroin and cocaine metabolism by a promiscuous human drug-processing enzyme. Nat. Struct. Biol. 2003;10:349–356. doi: 10.1038/nsb919. [DOI] [PubMed] [Google Scholar]
- 17.Rivory LP, Bowles MR, Robert J, Pond SM. Conversion of irinotecan (CPT-11) to its active metabolite, 7-ethyl-10-hydroxycamptothecin (SN-38), by human liver carboxylesterase. Biochem. Pharmacol. 1996;52:1103–1111. doi: 10.1016/0006-2952(96)00457-1. [DOI] [PubMed] [Google Scholar]
- 18.Sanghani SP, Quinney SK, Fredenburg TB, Davis WI, Murry DJ, et al. Hydrolysis of Irinotecan and its oxidation matabolites, 7-ethyl-10-[4-N-(5-aminopentanoic acid)-1-piperidino] carbonyloxycamptothecin and 7-ethyl-10-[4-(1-piperidino)-amino]-carbonyloxycamptothecin, by human carboxylesterases CES1A1, CES1, and a newly expressed carboxylesterase isoenzyme, CES3. Drug Metab. Dispos. 2004;32:505–511. doi: 10.1124/dmd.32.5.505. [DOI] [PubMed] [Google Scholar]
- 19.Carl PL, Chakravarty PK, Katzenellenbogen JA. A novel connector linkage applicable in prodrug design. J. Med. Chem. 1981;24:479–480. doi: 10.1021/jm00137a001. [DOI] [PubMed] [Google Scholar]
- 20.Barthel BL, Torres RC, Hyatt JL, Edwards CC, Hatfield MJ, et al. Identification of human intestinal carboxylesterase as the primary enzyme for activation of a doxazolidine carbamate prodrug. J. Med. Chem. 2008;51:298–304. doi: 10.1021/jm7011479. [DOI] [PubMed] [Google Scholar]
- 21.Brandi G, Dabard J, Raibaud P, Di Batista M, Bridonneau C, et al. Intestinal microflora and digestive toxicity of irinotecan in mice. Cancer Therapy: Preclinical. 2006;12:1299–1307. doi: 10.1158/1078-0432.CCR-05-0750. [DOI] [PubMed] [Google Scholar]
- 22.Cecchin E, Corona G, Masier S, Biason P, Cattarossi G, et al. Carboxylesterase isoform 2 mRNA expression in peripheral blood mononuclear cells is a predictive marker of the irinotecan to SN38 activation step in colorectal cancer patients. Clin Cancer Res. 2005;11:6901–6907. doi: 10.1158/1078-0432.CCR-05-0602. [DOI] [PubMed] [Google Scholar]
- 23.Saltiel E, McGuire W. Doxorubicin (adriamycin) cardiomyopathy. West J Med. 1983;139:332–341. [PMC free article] [PubMed] [Google Scholar]
- 24.Kimura T, Fujita I, Itoh N, Muto N, Nakanishi T, et al. Metallothionein acts as a cytoprotectant against doxorubicin toxicity. J. Pharmacol. Exp. Ther. 2000;292:299–302. [PubMed] [Google Scholar]
- 25.Gokcimen A, Cim A, Tola HT, Bayram D, Kocak A, et al. Protective effect of Nacetylcysteine, caffeic acid and vitamin E on doxorubicin hepatotoxicity. Hum. Exp. Toxicol. 2007;26:519–525. doi: 10.1177/0960327107076885. [DOI] [PubMed] [Google Scholar]
- 26.Yagmurca MO, Bas O, Mollaoglu H, Sahin O, Nacar A, et al. Protective effects of erdosteine on doxorubicin-induced hepatotoxicity in rats. Arch. Med. Res. 2007;38:380–385. doi: 10.1016/j.arcmed.2007.01.007. [DOI] [PubMed] [Google Scholar]
- 27.El-Shitany NA, El-Haggar S, El-desoky K. Silymarin prevents adriamycin-induced cardiotoxicity and nephrotoxicity in rats. Food Chem Toxicol. 2008;46:2422–2428. doi: 10.1016/j.fct.2008.03.033. [DOI] [PubMed] [Google Scholar]
- 28.Boonsanit D, Kanchanapangka S, Buranakarl C. L-carnitine ameliorates doxorubicininduced nephrotic syndrome in rats. Nephrology (Carlton) 2006;11:313–320. doi: 10.1111/j.1440-1797.2006.00592.x. [DOI] [PubMed] [Google Scholar]
- 29.Okuda S, Oh Y, Tsuruda H, Onoyama K, Fujimi S, et al. Adriamycin-induced nephropathy as a model of chronic progressive glomerular disease. Kidney International. 1986;29:502–510. doi: 10.1038/ki.1986.28. [DOI] [PubMed] [Google Scholar]
- 30.Mimnaugh EG, Trush MA, Gram TE. A possible role for membrane lipid peroxidation in anthracycline nephrotoxicity. Biochem Pharmacol. 1986;35:4327–4335. doi: 10.1016/0006-2952(86)90713-6. [DOI] [PubMed] [Google Scholar]
- 31.Deman A, Ceyssens B, Pauwels M, Zhang J, Houte KV, et al. Altered antioxidant defence in a mouse adriamycin model of glomerulosclerosis. Nephrol Dial Transplant. 2001;16:147–150. doi: 10.1093/ndt/16.1.147. [DOI] [PubMed] [Google Scholar]
- 32.Okasora T, Takikawa T, Utsunomiya Y, Senoh I, Hayashibara H, et al. Suppressive effect of superoxide dismutase on adriamycin nephropathy. Nephron. 1992;60:199–203. doi: 10.1159/000186739. [DOI] [PubMed] [Google Scholar]
- 33.Wu SH, Yang YC, Wang ZM. Role of oxygen radicals in adriamycin-induced nephrosis. Chin Med J (Engl) 1990;103:283–289. [PubMed] [Google Scholar]
- 34.Furihata T, Hosokawa M, Nakata F, Satoh T, Chiba K. Purification, molecular cloning, and functional expression of inducible liver acylcarnitine hydrolyase in C57BL/6 mouse, belonging to the carboxylesterase multigene family. Arch. Biochem. Biophys. 2003;416:101–109. doi: 10.1016/s0003-9861(03)00286-8. [DOI] [PubMed] [Google Scholar]
- 35.Shinohara H, Killion JJ, Kuniyasu H, Kumar R, Fidler IJ. Prevention of intestinal toxic effects and intensification of irinotecan's therapeutic efficacy against murine colon cancer liver metastases by oral administration of the lipopeptide JBT 3002. Clin Cancer Res. 1998;4:2053–2063. [PubMed] [Google Scholar]
- 36.Boushey RP, Yusta B, Drucker DJ. Glucagon-like peptide (GLP)-2 reduces chemotherapy-associated mortality and enhances cell survival in cells expressing a transfected GLP-2 receptor. Cancer Res. 2001;61:687–693. [PubMed] [Google Scholar]
- 37.Kaneda N, Nagata H, Furta T, Yokokura T. Metabolism and pharmacokinetics of the camptothecin analogue CPT-11 in the mouse. Cancer Res. 1990;50:1715–1720. [PubMed] [Google Scholar]
- 38.Senter PD, Marquardt H, Thomas BA, Hammock BD, Frank IS, et al. The role of rat serum carboxylesterase in the activation of paclitaxel and camptothecin prodrugs. Cancer Res. 1996;56:1471–1474. [PubMed] [Google Scholar]
- 39.Tsuji T, Kaneda N, Kado K, Yokokura T. CPT-11 converting enzyme from rat serum: purification and some properties. J. Pharmacobiodyn. 1991;14:341–349. doi: 10.1248/bpb1978.14.341. [DOI] [PubMed] [Google Scholar]
- 40.Xu G, Zhang W, Ma MK, McLeod HL. Human carboxylesterase 2 is commonly expressed in tumor tissue and is correlated with activation of irinotecan. Clin. Cancer Res. 2002;8:2605–2611. [PubMed] [Google Scholar]
- 41.Mosmann T. Rapid colorimetric assay for cellular growth and survival: application to proliferation and cytotoxicty assays. J. Immunol. Methods. 1983;65:55–63. doi: 10.1016/0022-1759(83)90303-4. [DOI] [PubMed] [Google Scholar]
- 42.Golpon HA, Coldren CD, Zamora MR, Cosgrove GP, Moore MD, et al. Emphysema lung tissue gene expression profling. Am. J. Respir. Cell Mol. Biol. 2004;31:595–600. doi: 10.1165/rcmb.2004-0008OC. [DOI] [PubMed] [Google Scholar]
- 43.Gentleman RC, Carey VJ, Bates DM, Bolstad B, Dettling M, et al. Bioconductor: open software development for computational biology and bioinformatics. Genome Biol. 2004;5:R80. doi: 10.1186/gb-2004-5-10-r80. [DOI] [PMC free article] [PubMed] [Google Scholar]
- 44.Koch GG, Elashoff JD, Amara IA. Encyclopedia of Statistical Sciences. New York: Wiley and Sons, Inc.; 1987. Repeated measurements studies, design and analysis; pp. 46–73. [Google Scholar]
Associated Data
This section collects any data citations, data availability statements, or supplementary materials included in this article.


