

Abstract
The ultrastructural view of the axonal cytoskeleton as an extensively cross-linked network of neurofilaments (NFs) and other cytoskeletal polymers contrasts with the dynamic view suggested by axonal transport studies on cytoskeletal elements. Here we reconcile these perspectives by showing that neurons form a large NF network along axons which is unequivocally stationary, metabolically stable, and maintained by NFs and nonfilamentous subunit assemblies undergoing slow transport by intermittent rapid movements and pauses. In mouse primary cortical neurons transfected with EGFP-NFL, formation of this stationary NF network requires a critical level of NFs, which explains its absence in NF-poor developing neurons studied previously. Most NFs at proximal axon regions were in a stationary structure coexisting with a smaller pool of moving EGFP-NFL assemblies that were mainly nonfilamentous. Distally along the same axon, EGFP-labeled NFL was much less abundant, and we detected only short filaments moving bidirectionally by slow transport (rapid movements and pauses) as previously described. In living mice, >25% of radiolabeled newly synthesized NFs remained in optic axons after slowly transported NFs had exited. Retained NF remained fixed over several months in a nonuniform distribution and exhibited exceptionally slow turnover (t1/2 >2.5 months), implying that, at steady state, >90% of NFs in mature optic axons comprise the stationary cytoskeleton and <10% are undergoing slow transport. These findings reconcile in vitro and in vivo axonal transport observations, showing that slowly transported NFs or subunit oligomers are precursors to a highly stable stationary cytoskeletal network that supports mature axons.
Introduction
In CNS neurons, NFs are assembled into long linear polymers containing four subunits, NFH, NFM, NFL, and α-internexin (Yuan et al., 2006). Because of their unique sidearms and ability to align in parallel arrays, NFs are well suited to support the extreme polar shapes of neurons (Hirokawa, 1991) and expand axons for optimal electrical impulse conduction (Hursh, 1939).
The kinetic behaviors of NFs and their incorporation into the axonal cytoskeleton have long been controversial. In one view, NFs and oligomeric NF subunit assemblies undergoing slow transport are a minor proportion of NFs in mature axons and constitute the precursor pool for a large stationary network of NF integrated with other cytoskeletal elements (Nixon and Logvinenko, 1986; Hirokawa, 1993; Nixon, 1998). While fixed in place along axons, this network undergoes exceptionally slow turnover and replacement by transported precursors. This model accords well with the ultrastructure of the axonal cytoskeleton as a meshwork of NFs, microtubules, and actin filaments linked together by cross-bridging proteins (Hirokawa, 1991; Fuchs and Cleveland, 1998; Perkins et al., 2008) and with observations that NF persist in place in peripheral axons for many months after NFL synthesis is turned off (Millecamps et al., 2007). According to a second view, initially proposed by Lasek et al. (1992), NFs comprise a single population of NFs that translocate by slow axonal transport and are continually replaced at the proximal end by newly synthesized NFs. More-recent studies of fluorescently labeled NF in cultured sympathetic neurons showed that slow transport rates reflect an average of intermittent rapid movements and pauses of short or longer durations (Wang et al., 2000; Trivedi et al., 2007). These two transport models have strikingly different implications for explaining the architecture and stability of the axonal cytoskeleton and its roles as a skeletal support and stable scaffold for organelles and receptors.
To reconcile these two models, we monitored movements of EGFP-tagged NFL assemblies in primary neurons in vitro and the long-term fate of pulse-radiolabeled NFs in retinal ganglion cell (RGC) neurons in vivo. For in vitro transport analyses, we used primary cortical neurons (Ackerley et al., 2000), which by comparison to sympathetic neurons (Yan et al., 2007), achieved a more advanced state of maturity, including greater NF abundance. Our findings show that the NF cytoskeleton in mature axons is a large fixed network containing >90% of the total NF in axons. This structure exhibits exceptionally slow turnover and is maintained by a small population of NFs and oligomeric subunit precursors undergoing slow axonal transport by moving rapidly and pausing for varying lengths of time.
Materials and Methods
Construction of plasmids.
The expression vectors for mouse NFL, NFM, and NFH were constructed by cloning into pcDNA3.1. The expression plasmid of rat α-internexin (pRSV-α) was used as previously described (Ching and Liem, 1993). The EGFP-tagged NFL expression vector was constructed using mouse NFL cDNA (Gill et al., 1990) by cloning into EcoRI of pEGFP-C1 (Clontech). The EGFP-tagged NFH and NFM expression vectors were constructed using genomic clones in pcDNA3.1 (Rao et al., 1998, 2003). pDsRed2-Mito (targeting sequence from subunit VIII of cytochrome c oxidase) living-color vector is from Clontech.
Cell cultures.
SW13vim- cells were cultured in DMEM with 10% fetal bovine serum (FBS) and 100 U/ml penicillin and 0.1 mg/ml streptomycin. Transfection into SW13- cells was performed using Lipofectamine 2000 (Invitrogen) according to the manufacturer's instructions. Primary cortical neurons were prepared from the fetuses of wild-type mice (C57BL/6J strain) at embryonic day 17.5. Cerebral cortices were collected into ice-cold Hibernate E medium (HEM) (BrainBits) and minced by using a scalpel, followed by incubation for 15 min at 37°C in HEM containing 10 U/ml papain (Worthington Biochemical) and DNase (50 μg/ml). The reaction was stopped by adding an equal volume of HEM containing 10% FBS and DNase (50 μg/ml). The pieces of cortices were collected by centrifugation at 1000 × g for 3 min at 25°C and then triturated in DMEM/F-12 supplemented with 5% horse serum and 5% FBS and followed by passing through a nylon cell trainer (Thermo Fisher Scientific) to remove cell debris and aggregates. Thirty-five thousand neurons (final cell density, 300,000 cells/cm2) were plated on the center of a coverslip-bottom 35 mm dish (BD Biosciences) and cultured in a CO2 incubator. Two milliliters of neurobasal medium supplemented with B27 and 0.5 mm Glutamax (Invitrogen) was added to the culture after incubation for 40 min.
Transfection of cultured neurons with EGFP-NFL and NFM.
Primary cortical neurons at 4 d in vitro (DIV) were cotransfected with endotoxin free EGFP-NFL and NFM using Lipofectamine 2000 (Invitrogen) according to the manufacturer's procedure. DsRed2-Mito was also cotransfected to monitor the active transport of mitochondria. Before transfection, 1 ml of the conditioned medium was transferred into a new tube and then 1 ml of fresh medium was added. The transfection complex prepared with 5 μg of plasmid DNA and 5 μl of Lipofectamine 2000 in 500 μl of Opti-MEM (Invitrogen) was added into the culture and incubated for 30 min at 37°C. The transfected neurons were then washed twice with fresh neurobasal medium and maintained in medium consisting of 1 ml of the conditioned medium and 1 ml of fresh neurobasal medium until time-lapse imaging.
Individual NF movements in vitro.
To reduce fluorescence background before imaging, culture medium was replaced with Hibernate E low-fluorescence medium (BrainBits) supplemented with B27 and 0.5 mm Glutamax after 3 d of transfection. The culture dishes were placed in a 37°C humidified chamber fitting into a Zeiss LSM510 confocal microscope. To create the blank area on the axon filled with EGFP fluorescence, we used the function of photobleaching equipped with a Zeiss LSM510 confocal microscope. Time-lapse images of NF transport were acquired with 1 s exposure at 5 s intervals for 30 min using LSM510 software under a 40× objective lens. Motion was analyzed by tracking the position of the leading or trailing ends of the filaments. Both anterograde and retrograde NF transport was analyzed using the software ImageJ, a Java image-processing program derived from NIH Image (ImageJ, W. Rasband, http://rsb.info.nih.gov/ij/, 1997–2007). Unhealthy-appearing cells and those expressing very high (potentially toxic) levels of EGFP-NFL (as judged by fluorescence) were not used for imaging NFs.
In vitro NF stationary assay.
Neurons were cotransfected with EGFP-NFL and NFM at 4 DIV and examined at 7 DIV to allow adequate maturation and NF expression. A 5 μm nonbleached window was made in the proximal area of axon at a standard distance from the cell body by creating flanking 10 ∼ 12.5 μm photobleached regions. After photobleaching, images were captured every 5 s for 30 min to 5 h without altering microscope settings except to adjust focus. The presence of a stationary NF network is defined by the absence of movement of the unbleached 5 μm window and its minimal decline in fluorescence.
Immunofluorescence staining of transfected cells.
Transfection and immunofluorescence staining of SW13vim(-) cells were performed as described previously (Sasaki et al., 2006). For staining of primary cortical neurons, cells were fixed with 4% paraformaldehyde in PBS for 20 min and then permeabilized and blocked with 0.3% Triton X-100 and 5% normal goat serum in PBS (TNGS) for 15 min. After blocking, cells were probed with primary antibodies in TNGS overnight at 4°C. After washes with 0.3% Triton X-100 in PBS, they were stained with fluorescently conjugated secondary antibodies in TNGS for 2 h at room temperature. After being washed, specimens were mounted with 90% glycerol containing 1 mg/ml p-phenylenediamine in PBS. NFL was probed with anti-NFL rabbit polyclonal antibody AB9568 (500-fold dilution, Sigma-Aldrich). NFM was probed with mouse monoclonal antibody NN18 (500-fold dilution, Sigma-Aldrich) or anti-NFM rabbit polyclonal antibody (200-fold dilution) prepared using purified mouse NFM protein as an antigen. NFH was probed with anti-NFH rabbit polyclonal antibody raised against the COOH-terminal 12 aa of mouse NFH (2000-fold dilution) (Xu et al., 1993), and rat α-internexin was probed with anti α-internexin mouse monoclonal antibody MAB5224 (200-fold dilution, Sigma-Aldrich) or anti α-internexin rabbit polyclonal antibody AB5354 (200-fold dilution, Sigma-Aldrich). Synapsin I and tubulin were probed with rabbit polyclonal anti-synapsin I and anti-tubulin antibodies (2000-fold dilution, Sigma-Aldrich). Images were acquired with an LSM 510 laser scanning confocal microscope (Carl Zeiss).
Electron microscopy.
Neurons were washed (three times) with supplement-free neurobasal medium and fixed with 4% paraformaldehyde and 1% glutaraldehyde in 0.1 m sodium cacodylate buffer (Electron Microscopy Sciences), pH 7.2, for 3 h at room temperature. After fixation, neurons were washed (three times) in cacodylate buffer, postfixed in 1% osmium tetroxide, progressively dehydrated in a graded series of ethanol (50–100%), and embedded in Epon. Thin sections of 1 μm were cut from the polymer, followed by ultrathin sectioning (70–80 nm) using a Recheirt Ultracut S microtome, and the sections were placed on copper grids for structural analysis. Grids were briefly stained with uranyl acetate and lead citrate before being examined with a Philips electron microscope (model CM 10). Images were captured on a digital camera (Hamamatsu; model C4742-95) using Advantage charge-coupled device camera system software (Advanced Microscopy Techniques).
Isotope injections.
Adult mice (C57BL/6J, 12–16 weeks of age at the time of injection) were anesthetized with 13–20 μl/g body weight of Avertin (0.5 g of tribromoethanol and 0.25 g of 2-methyl-2-butanol in 39.5 ml of distilled water) and received 0.30 μl of phosphate-buffered normal saline, pH 7.4, which contained 25 μCi of [3H]proline (specific activity, 30–50 Ci/mmol) purchased from Perkin-Elmer Life Science Inc.. Isotope was injected into the vitreous of each eye with a glass micropipette (70–100 μm) apparatus as described previously (Nixon and Logvinenko, 1986; Yuan, 2007; Yuan et al., 2008).
Analyses of stationary NF in vivo.
By injecting identical amounts of [3H]proline intravitreously into each mouse in a single large group, we quantitated from subgroups analyzed at different time points the total amount of radiolabeled NF that enters optic axons and the proportion of labeled NF retained in axons after the moving wave of labeled NF proteins has exited (Nixon and Logvinenko, 1986). All the experimental protocols were approved by New York University Medical School and Nathan Kline Institute Institutional Animal Care and Use Committees under the guidelines of the Institutional Animal Care and Use Committee of the National Institutes of Health.
SDS-PAGE and immunoblot analysis.
Protein concentrations were determined with BCA assay (Sigma-Aldrich). Antibodies used were monoclonal antibodies to NFL (NR4), NFM (NN18), NFH (N52), α-internexin (MAB5224, Chemicon), β-actin (AC-15) (Sigma), α-internexin (MAB5224, Chemicon), and EGFP (JL-8, Clontech). The RT-97 monoclonal antibody clone was a kind gift from Dr. Brian Anderton (Institute of Psychiatry, King's College London, London, UK). SDS-PAGE was performed according to the work of Laemmli (1970). Separated proteins were transferred to Immobilon membranes (Millipore) as described previously (Yuan et al., 2000). Blots were probed with primary antibodies, followed by an alkaline phosphatase-conjugated secondary antibody (1000-fold dilution, DAKA). The reaction was developed using a BCIP/NBT phosphatase system (KPL) as described previously (Mills et al., 1996).
Results
Axonal transport kinetics in established cultures of cortical neurons
We used primary cortical neurons cultured at high density (3 × 10⁵ cells/cm2) in these studies to enable us to capture NF dynamic behaviors of NFs at a more mature stage of neuronal development than that present in the sympathetic neurons used in earlier analyses of NF kinetics (Roy et al., 2000; Wang et al., 2000; Trivedi et al., 2007; Yan et al., 2007). Cortical neurons under our culture conditions express NFH, acquire NF phosphoepitopes associated with a relatively mature state of axons, and exhibit typical slow bulk transport of NFs along axons similar to that seen in vivo (Ackerley et al., 2000). Using immunofluorescence labeling with a polyclonal antibody to α-synapsin I, we observed the formation of synaptic junctions beginning at 3 DIV after plating, which reached a plateau between 7 and 10 DIV, indicating a leveling off of axonal growth under these conditions (Fig. 1A). Consistent with previous findings, unphosphorylated and phosphorylated forms of NFH gradually appeared in neurons along with a relatively constant presence of the other three NF subunits, NFL, NFM, and α-internexin (Fig. 1B) (Ackerley et al., 2000; Yuan et al., 2006).
Figure 1.

Characterization of high-density cultures of mouse primary cortical neurons. A, Primary cortical neurons plated at a density of 3 × 10⁵ cells/cm2 and stained with anti-synapsin I antibody at 1, 3, 5, 7, and 10 DIV revealed increasing numbers of puncta positive for synapsin I, a marker of synapses, beginning by 3 DIV and reaching a plateau by 7–10 DIV. B, Western blot analysis of NF protein subunits at 3–10 DIV and β-actin as a loading control. Increasing RT-97 immunoreactivity appeared on both NFH and NFM beginning at 4 DIV. C, D, In a neuron transfected at 4 DIV with EGFP, axon morphology did not change between 5 (C) and 7.5 (D) DIV (white arrowheads), whereas dendrite arborization changed dramatically (yellow and red arrowheads). E, F, Depicted are three axons from primary cortical neurons: E represents a relatively proximal level of an axon, in which relatively abundant NFs are seen (arrows), and F represents a proximal level (P), showing abundant NFs and a distal level (D) showing isolated NFs and a high proportion of MTs. Scale bars: A, 20 μm; (in D) C, D, 50 μm; (in F) E, F, 100 nm.
The axon of a given cortical neuron was identified as a single long relatively straight process that changed minimally in morphology from 5 to 7.5 DIV (Fig. 1C,D). At proximal regions of the axon, ultrastructural analyses revealed abundant longitudinally aligned NFs, usually arrayed in bundles which were interspersed among microtubules and vesicular organelles (Fig. 1E). At more distal axonal regions, isolated NFs were present among more abundant microtubules (Fig. 1F). By comparison to axons, dendrites appeared as relatively short tapering processes that changed morphology dramatically during the period in culture (Fig. 1C,D). At the ultrastructural level, proximal dendrites exhibited abundant vesicular organelles and microtubules but rare NFs (supplemental Fig. 2, available at www.jneurosci.org as supplemental material).
To visualize NF dynamics in cortical neurons, we constructed an expression vector in which EGFP is linked to the N terminal of NFL. Transfection of EGFP-NFL in SW13vim(-) cells, which lack intermediate filament networks, resulted in expression of a protein with an apparent molecular weight of 95 kDa that is recognized on Western blots by antibodies specific for either NFL (Fig. 2A, lane 1) or EGFP (Fig. 2A, lane 2). Thus, EGFP-NFL directs the expression of full-length EGFP-NFL fusion protein. In SW13vim(-) cells, double transfection of pEGFP-NFL with either one or all of the other three CNS NF subunits, NFM, NFH, and α-internexin, combined with immunofluorescence analysis using the appropriate NF subunit antibodies, demonstrated that EGFP-NFL can form filaments in these cells with any one or all three of the other subunits (Fig. 2B–S).
Figure 2.
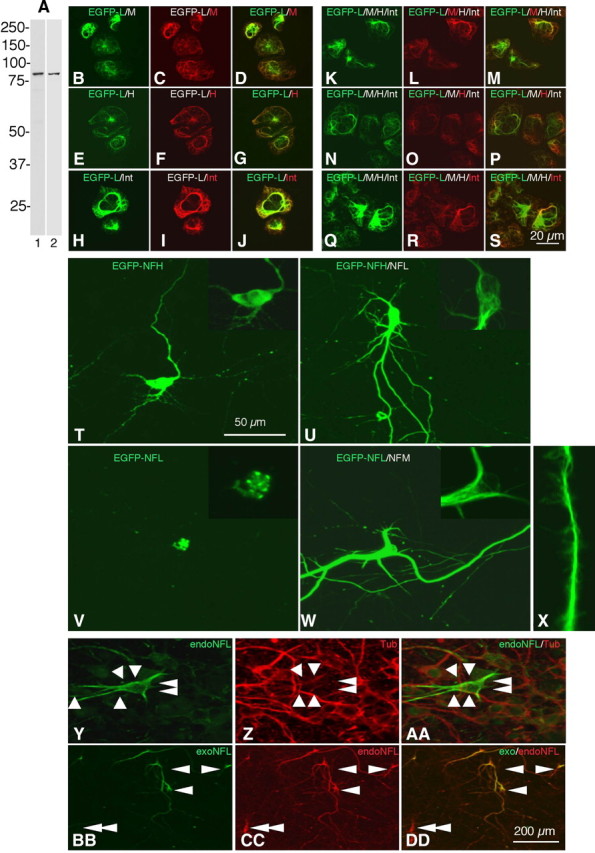
EGFP-tagged NFL forms filaments with all four subunits of NFs and are transported into axons and dendrites. A, Immunoblot analysis of SW13vim(-) cells transfected with EGFP-NFL detects full-length EGFP-NFL fusion protein (95 kDa) using an NFL-specific antibody (NR4) (lane 1) and an EGFP antibody (JL-8) (lane 2). B–J, Double transfection of pEGFP-NFL with NFM or NFH or α-internexin shows EGFP-NFL is able to form filaments with NFM (B–D), NFH (E–G), or α-internexin (H–J) in SW13vim(-) cells. K–S, Quadruple transfection with EGFP-NFL, NFM, NFH, and α-internexin shows that EGFP-NFL is a component of a filamentous network composed of all of the other subunits. Shown is the double staining with EGFP-NFL and NFM (K–M), EGFP-NFL and NFH (N–P), and EGFP-NFL and α-internexin (Q–S). T–W, Primary cortical neurons were transfected at 4 DIV with EGFP-NFH (T), EGFP-NFH and NFL (U), EGFP-NFL (V), or EGFP-NFL and NFM (W). The EGFP signals of each neuron were observed after 3 DPT. The enlarged images of cell body are displayed in insets. X, In neurons transfected with EGFP-NFL and NFM and extracted with Triton X-100 before fixation, filaments can be seen splaying from the neurite axis. Y–AA, Untransfected cortical neurons at 7 DIV were immunostained with NFL and tubulin antibodies. NFL expression is heterogenous, with low levels in most neurons and high levels in some neurons (white arrowheads). BB–DD, Neurons transfected with EGFP-NFL and NFM were stained with EGFP and NFL. The expression level of exogenous EGFP-NFL (arrowheads) does not exceed the range of expression levels of endogenous NFL in cortical neurons (double arrowheads). Scale bars: (in S) B–S, 20 μm; (in T), T–AA, 50 μm; (in DD), BB–DD, 200 μm.
We also constructed expression vectors in which EGFP was fused to the N terminal of NFH or the C terminal of NFM. EGFP-NFH or NFM-EGFP expressed alone in cortical neurons distributed diffusely in the cell body. This was caused by an overexpression of transfected subunits relative to the endogenous subunits: when NFL was cotransfected, a filamentous network formed in place of the diffuse perikaryal distribution pattern of NFH or NFM (Fig. 2T–W). Expression of EGFP-NFL in cortical neurons in the absence of other intermediate filament subunits caused it to aggregate in the cell body (Fig. 2V), consistent with previous evidence that proper assembly and export into axons in vivo requires heterodimerization between specific pairs of NF subunits and proper ratios of NF subunits (Xu et al., 1996; Yuan et al., 2003). When expressed in cortical neurons together with either NFM or NFH, EGFP-NFL consistently formed filamentous structures in the cell bodies and neurites (Fig. 2U–X). The level of expression of exogenous NFL was maintained within the normal range of expression levels of endogenous NFL observed in the cortical neuron cultures (Fig. 2Y–DD). For consistency in all of the following experiments, we cotransfected EGFP-NFL with NFM at 4 DIV and DsRed2-Mito was cotransfected to simultaneously monitor the preservation of mitochondrial transport in the same axons. Transport kinetics were examined at 7 DIV [3 d post-transfection (3 DPT)] by monitoring the movements of individual fluorescent NF through a 20 μm photobleached zone created at a specific proximal, intermediate, or distal region along a given axon. Under these conditions, we observed, as reported in previous studies (Roy et al., 2000; Wang et al., 2000), robust anterograde and retrograde transport of NF puncta or short filaments in distal regions of the axon in which NFs were low in number, allowing movements of single filaments to be visualized against a nonfluorescent background (Fig. 3A).
Figure 3.
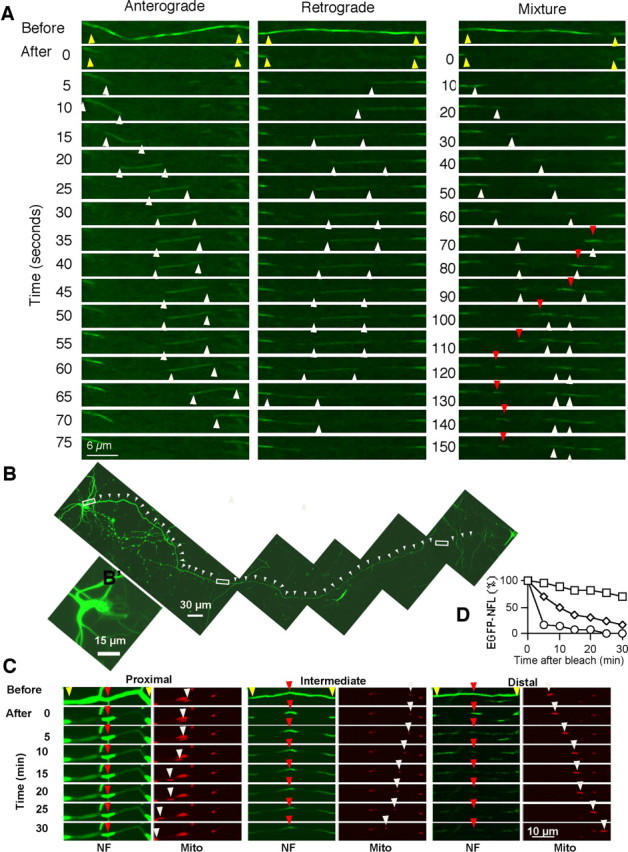
Different NF dynamics within a single axon of a cultured cortical neuron. Cortical neurons transfected with EGFP-NFL and NFM were examined at 7 DIV, 3 DPT. A, The distal regions of different axons were examined by time-lapse imaging with 5 s intervals after photobleaching. The first and second rows in each column show the images before and after photobleaching, respectively. The yellow arrowheads mark the outer edges of photobleached regions. Left and center columns display 5 s intervals of serial images showing intermittent NF movements in the anterograde, and retrograde directions, respectively. The white arrowheads mark the leading and/or trailing ends of the filaments. The right column displays 10 s intervals of serial images showing several short NFs moving anterogradely (white arrowheads) or retrogradely (red arrowheads) within the same axon. Scale bar, 6 μm. B, NF dynamics was also examined at different regions of the same axon. Shown is the distribution of EGFP-NFL in the neuron transfected together with NFM. NFs are distributed at least 1.5 mm along the length of this axon (white arrowheads). Scale bar, 30 μm. B′, Magnified view of the cell body showing that NFs form a normal filamentous network, indicating that the level of NF expression yielded normal patterns of NF organization. Scale bar, 15 μm. C, Differential dynamics of NFs was examined at proximal (left) (supplemental Movie 1, available at www.jneurosci.org as supplemental material), intermediate (center), and distal (right) regions of the same axon indicated by the white rectangles in B. A 5-μm-long window of fluorescent NF flanked by two photobleached areas was created. Then, images were recorded every 5 s for 30 min. Each left column shows the NF images every 5 min. Yellow arrowheads indicate the edges of the photobleached area, and red arrowheads point to the 5 μm window of fluorescent NFs. Each right column displays the serial images of 5 s intervals with transported mitochondria (white arrowheads) at the corresponding photobleached regions, proving axonal transport is active in the observed axon. Scale bar, 10 μm. D, Densitometric analysis of EGFP-NFL levels during the recovery from photobleaching in a 5-μm-long window containing fluorescent NF at proximal (squares), intermediate (diamonds), and distal (circles) regions of a circle (representative of 5 experiments).
We analyzed the movement of short filaments that could be tracked unambiguously using recorded time-lapse movies of 24 bleached axons from 24 neurons (Fig. 4A). The duration of the movies ranged from 15 to 30 min. We observed one moving filament from 2.44 to 10 min, on average, per 4 min of observation. The filament lengths ranged from 1.3 to 19.4 μm (average, 5.95 ± 0.58 μm; mean ± SEM; n = 39) in the anterograde direction and from 1.4 to 24.4 μm (average, 5.33 ± 0.56 μm; mean ± SEM; n = 59) in the retrograde direction (Fig. 4C). The filament widths ranged from 0.25 to 0.50 μm (average, 0.39 ± 0.01 μm; mean ± SEM; n = 39) in the anterograde direction and from 0.25 to 0.50 μm (average, 0.38 ± 0.01 μm; mean ± SEM; n = 59) in the retrograde direction. There was no significant difference between the lengths (p = 0.204, Mann–Whitney test) or widths (p = 0.365, Mann–Whitney test) of the anterograde and retrograde filaments. The average time spent pausing was 32.13 ± 4.17% (mean ± SEM; n = 38) for filaments in the anterograde direction and 23.44 ± 3.58% (mean ± SEM; n = 38) in the retrograde direction, and there was no significant difference between them (p = 0.162; Mann–Whitney test). The average velocity excluding the pauses ranged from 0.22 to 1.19 μm s−1 in the anterograde direction (average, 0.59 ± 0.04 μm s−1; mean ± SEM; n = 38) and from 0.28 to 1.3 μm s−1 in the retrograde direction (average, 0.71 ± 0.04 μm s−1; mean ± SEM; n = 38). The peak velocity ranged from 0.4 to 1.8 μm s−1 in the anterograde direction (average, 0.95 ± 0.06 μm s−1; mean ± SEM; n = 39) and from 0.5 to 2.2 μm s−1 in the retrograde direction (average, 1.08 ± 0.05 μm s−1; mean ± SEM; n = 59). The average (p = 0.0046; Mann–Whitney test) and peak (p = 0.0451; Mann–Whitney test) velocities were significantly lower in the anterograde direction than in the retrograde direction (Fig. 4B).
Figure 4.

Analysis of moving neurofilaments. A, Movements of four representative filaments. Shown are an anterogradely moving filament interrupted by two pauses of varying duration (top left), a retrogradely moving filament interrupted by two brief pauses (top right), an anterogradely moving filament interrupted by multiple pauses of varying duration (middle), and an anterogradely moving filament interrupted by multiple pauses of varying duration and some transient reversals (bottom). The vertical axis represents the distance translocated by the filament from its starting position, measured along the axon in micrometers. The horizontal axis represents the time elapsed since the start of the movie. Exposures are every 5 s. Anterograde or retrograde transport is indicated as positive or negative movement, respectively. B, Column graphs of average velocities (excluding pauses defined as movement of <0.0685 μm s−1) and peak velocities (defined as the maximum velocity attained in a single time-lapse interval) for 76–98 filaments. The average (p = 0.0046; Mann–Whitney test) and peak (p = 0.0451; Mann–Whitney test) velocities were significantly lower in the anterograde direction than in the retrograde direction. C, Column graph of filament length for 98 filaments that moved. The lengths ranged from 1.3 to 19.4 μm (average, 5.95 μm) in the anterograde direction and from 1.4 to 24.4 μm (average, 5.33 μm) in the retrograde direction. There were no significant differences between the lengths of filaments moving in either direction (p = 0.2040; Mann–Whitney test).
NF transport kinetics vary regionally along the same axon
A discrete 5 μm fluorescent (i.e., unbleached) window was created by photobleaching flanking regions of 10–12.5 μm in length, which allowed us to observe the movement, if any, of fluorescent NFs out of the unbleached window as well as the entry and movement of NF within the flanking photobleached zones. We used this approach to compare the kinetics of NF subunit movement at three different regions of the same axon (Fig. 3B). Images of EGFP-NFL distribution captured in a single axon confirmed an adequate expression level and showed that the intensity of NF fluorescence by visual inspection clearly decreased proximally to distally (Fig. 3B)—a pattern consistently seen in all transfected neurons. At three different regions of the same axon, we then captured images every 5 s after photobleaching for up to 30 min using the same sensitivity settings (Fig. 3C).
At the most distal region of the axon analyzed, NF fluorescence in the unbleached window disappeared completely within 30 min (Fig. 3C). During this period, we observed NFs moving anterogradely or retrogradely through the two bleached zones at typical rapid transport rates, although no fluorescent structures deposited locally within this region (Fig. 3C, lower right). At the most proximal region of the axon, in contrast, we detected no significant loss of fluorescent NF from the unbleached window (Fig. 3C, lower left; supplemental Movie 1, available at www.jneurosci.org as supplemental material). The lack of significant decline in fluorescence of the unbleached zone was not a result of a saturated level of fluorescence signal at the early time points because images of proximal axons in similar neurons captured at low signal intensity also showed minimal decline. No net movement or broadening of the unbleached window was detected at proximal axon regions. Moreover, movements of NFs into or through the photobleached zones were extremely rare (0–2 transport events of filamentous structure/30 min) even though a significant proportion of the original fluorescence within these bleached regions recovered over 30 min. The absence of movement of fluorescent NFs out of the unbleached window was not because of disruption of axonal transport, because mitochondria transported normally throughout the recording (Fig. 3C; supplemental Movie 1, available at www.jneurosci.org as supplemental material).
At an intermediate region of the same axon, in which NF fluorescence intensity was intermediate between proximal and distal regions, NF kinetic behavior was also intermediate (Fig. 3C, lower middle). The intensity of fluorescence signal in the unbleached window declined significantly but did not completely disappear during the 30 min period as seen at distal regions, and the fluorescent window broadened, indicating very slow net movement of some fluorescent NFs within the unbleached window. These findings, which were consistently observed in analyses of other axons, indicate that NF kinetic behaviors vary at different regions of the axon, with the mobility of NF dramatically increasing at more distal regions of these developing axons (Fig. 3D).
Formation of a completely stationary NF network in proximal axons
Although a 30 min period of time-lapse imaging is relatively long to monitor transport phenomena in vitro, it is insufficiently long to exclude entirely the possible movement of NFs from the window of fluorescent NFs created at a proximal region of the axon. Therefore, we extended the time of image recording up to 5 h, taking images every 5 min (Fig. 5B; supplemental Movie 2, available at www.jneurosci.org as supplemental material). The anterograde and retrograde movements of mitochondria in proximal regions of axons were also continuously confirmed during the recording to establish that axonal transport mechanisms remained competent during a 5 h period of observation (Fig. 5D, blue arrowheads; supplemental Movie 2, available at www.jneurosci.org as supplemental material). Even with this duration of monitoring, the unbleached window containing fluorescent NFs exhibited no appreciable loss of signal and no change in its location or width, indicating that the NF located within proximal axons are unequivocally stationary (Fig. 5B,C). In the blank area, the signal recovered gradually without distinguishable filamentous movement (Fig. 5B; supplemental Movie 2, available at www.jneurosci.org as supplemental material). Since EGFP-NFL subunits alone are not efficiently transported (Fig. 2V), this flow of signal recovery likely reflects a transport of hetero-oligomer assemblies rather than NF, in contrast to the predominantly filamentous forms of EGFP-NFL that are moving along axons at more distal regions.
Figure 5.
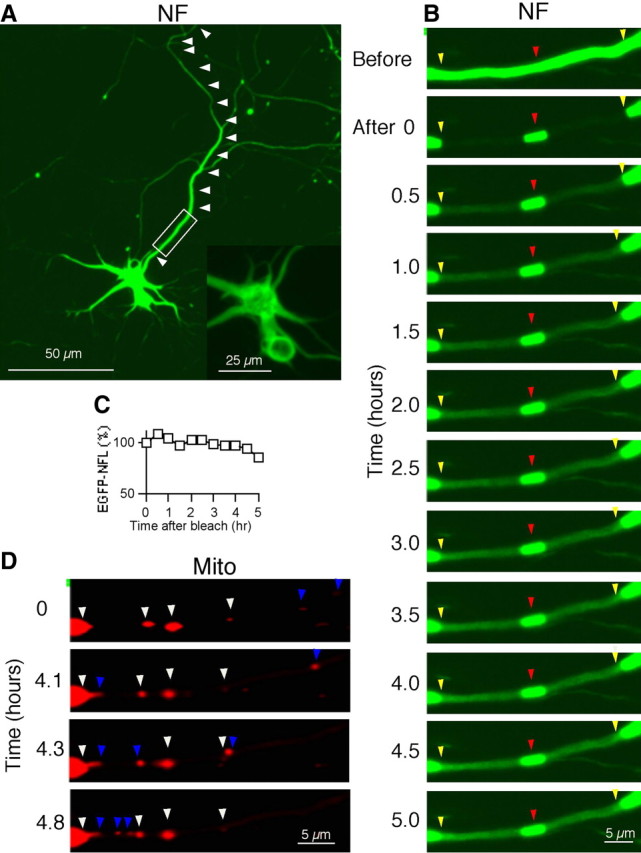
Stationary NFs in proximal axons are immobile for up to 5 h in cultured cortical neurons. The mobility of NF in the proximal axon region was examined over a 5 h interval. Time-lapse imaging was performed for 5 h as in Figure 3, except that the time intervals were changed to every 5 min. A, Transfected neuron with EGFP-NFL and NFM. Arrowheads indicate the axon, and the rectangle indicates the region observed. Scale bar, 50 μm. The inset displays the magnified view of the cell body, showing that NFs form a normal filamentous network. Scale bar, 25 μm. B, NF images every 30 min. Yellow arrowheads indicate the edges of the photobleached area and red arrowheads point to the 5 μm window of fluorescent NF. C, Densitometric analysis of EGFP-NFL protein level during the course of photobleaching in the 5-μm-long window of stationary fluorescent NF (representative of 3 experiments). D, Transport of mitochondria within the photobleached region during the observation period. The white and blue arrowheads mark the stationary and moving (both anterograde and retrograde direction) mitochondria, respectively. Scale bar, 10 μm. See supplemental Movie 2, available at www.jneurosci.org as supplemental material.
Formation of a stationary NF network is dependent on the level of NFs in cultured neurons
Because NFs are much more abundant at proximal axonal regions than more distally, we further investigated whether stationary NF network formation is dependent on the higher NF content at proximal regions or on other local factors in proximal axons. For this analysis, we studied the dynamics of NF at proximal axonal regions in neurons containing different levels of NFs. EGFP-NFL signals could be detected from 1 DPT, when they were cotransfected with NFM into cultured cortical neurons at 4 DIV. Their expression level, however, was relatively lower and more variable among transfected neurons than that seen in neurons at 3 DPT. Since the morphologies of proximal axons were relatively stable from 5 DIV (Fig. 1C), we could assess how establishment of a stationary NF network was affected when the abundance of NFs at the same proximal region of the axon varied in different transfected neurons at 5 DIV, 1 DPT (Fig. 6A–C, left). In time-lapse imaging analyses similar to those in Figure 3, we observed in proximal axons with a low content of fluorescent NFs that NFs moved out of the unbleached window, and NF fluorescence was largely eliminated from the window by 30 min (Fig. 6A; supplemental Movie 3, available at www.jneurosci.org as supplemental material). In axons with intermediate regions of NF deposition (Fig. 6B; supplemental Movie 4, available at www.jneurosci.org as supplemental material), the window of unbleached NF was partially preserved; however, the width of the window broadened and the fluorescence intensity was diminished by 30 min, similar to the observations made on axons at regions of intermediate distance from the cell body (Fig. 3B). In contrast, in axons with high NF content proximally, the loss of fluorescent NF from the unbleached zone was much more gradual, and the width of the window did not change over the period of observation (Fig. 6C,D; supplemental Movie 5, available at www.jneurosci.org as supplemental material).
Figure 6.
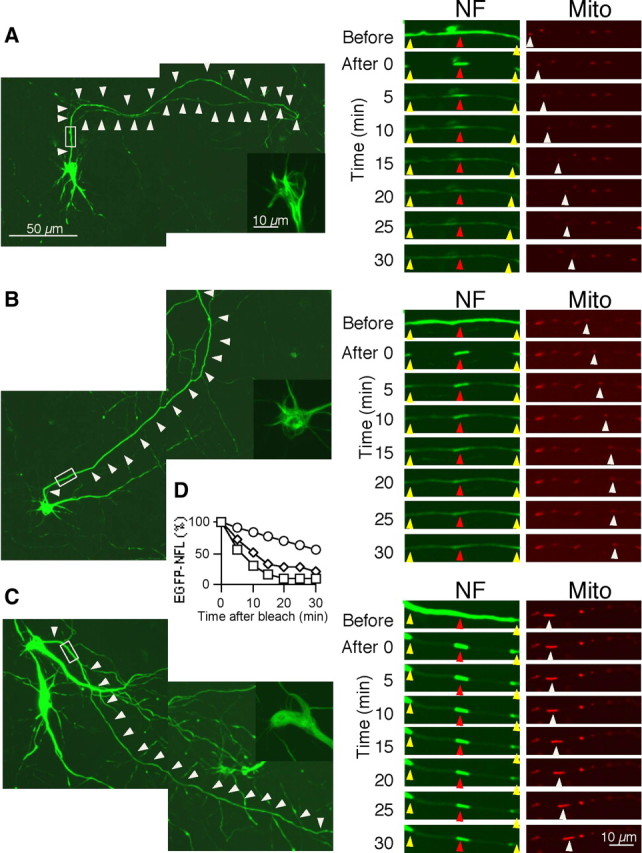
Formation of stationary NF networks requires a critical level of NFs in cultured cortical neurons. A, An axon with less abundant NFs at 1 d post-transfection and 5 d in vitro. Scale bar, 50 μm. White arrowheads mark the position of axon. The inset is the magnified image of the cell body. The rectangle represents the segment photobleached (A, right). The time-lapse images demonstrate the rapid disappearance of EGFP-NFL assemblies from the unbleached zone between photobleached regions. Images are selected from a time-lapse movie in which images were acquired at 5 min intervals. Yellow arrowheads indicate the edges of the photobleached area, and red arrowheads point to the 5 μm window of fluorescent NFs (A–C). The movement of mitochondria within the photobleached region during the interval is shown. White arrowheads mark the positions before and after fluorescence photobleaching and changes in position of mitochondria. Scale bar, 10 μm. See supplemental Movie 3. B, An axon with intermediate levels of NF is depicted. Time-lapse images from a movie in which images were acquired at 5 min intervals show the presence of NFs with limited mobility in the unbleached zone, which are networks. See supplemental Movie 4. C, An axon with higher levels of NFs. Time-lapse images (right) show a well established stationary NF structure, similar to that in Figures 3B and 4B in the window, between photobleached regions selected from a time-lapse movie in which images were acquired at 5 min intervals. See supplemental Movie 5. D, Densitometric analysis of EGFP-NFL protein level during the course of photobleaching in the 5-μm-long window of stationary fluorescent NF at low (circles), intermediate (diamonds), and high (squares) levels (representative of 6 neurons). Supplemental Movies are available at www.jneurosci.org as supplemental material.
Stationary NF network formation is associated with increased axon caliber
The importance of NF in specifying normal axonal caliber has been well established in vivo (Ohara et al., 1993; Eyer and Peterson, 1994; Lee and Cleveland, 1996; Zhu et al., 1997; Elder et al., 1998). To investigate this relationship in vitro, we transfected primary cortical neurons with EGFP alone, together with NFH, NFM, NFL, or with combinations of NFH plus NFL or NFM plus NFL. Axon calibers of the transfected neurons were then measured with ImageJ software. Transfection with the individual NF subunits NFH, NFM, or NFL did not significantly alter axon caliber compared with those transfected with EGFP alone, as shown in Figure 7. In contrast, the average caliber of axons expanded by 105% when we cotransfected with NFM plus NFL (n = 8; p = 0.0002; Mann–Whitney test) (Fig. 7C) and by 21% when NFH was cotransfected with NFL (n = 8; p = 0.04; Mann–Whitney test). These results strongly suggest that the formation of a stationary NF cytoskeleton along axons is associated with the expansion of axon caliber as predicted from in vivo studies (Hoffman et al., 1987).
Figure 7.
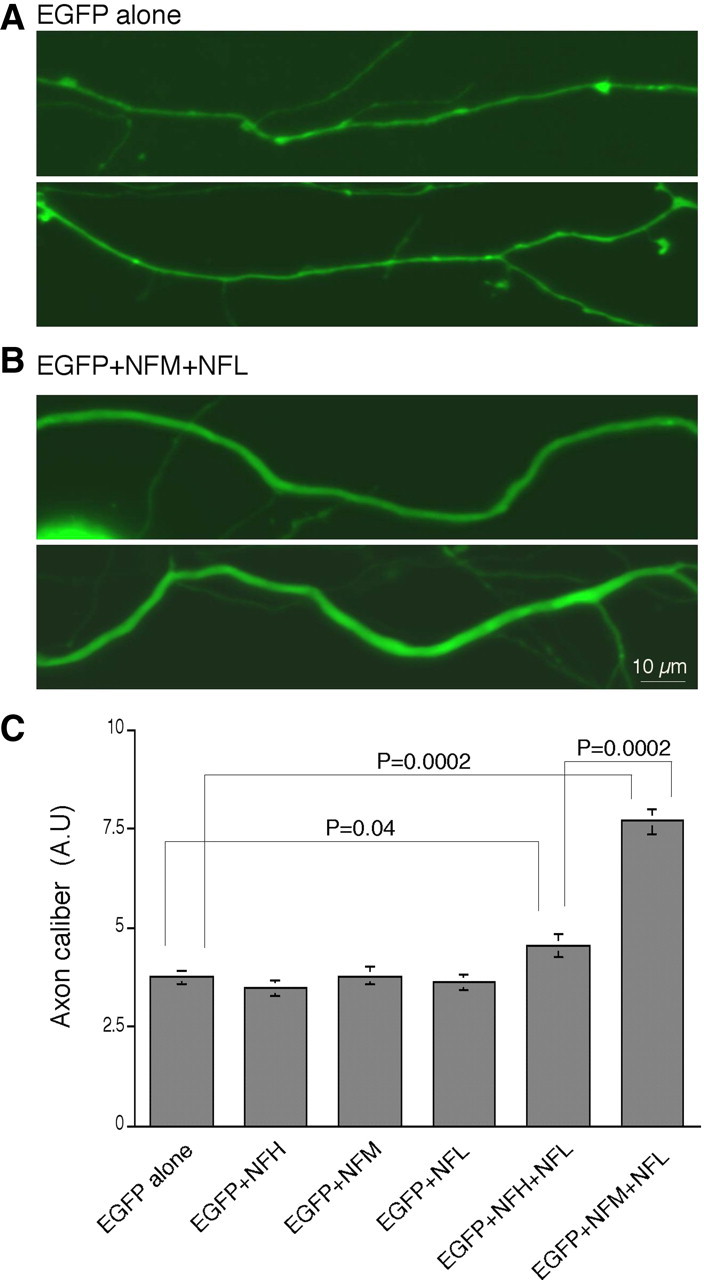
Coexpression of NFM and NFL or NFH and NFL increases the radial growth of axons in primary cortical neurons. A, B, Cortical neurons at 4 DIV were transfected with EGFP empty vector alone (A), double transfected with EGFP together with NFH, NFM, or NFL, or triple transfected with NFH plus NFL or NFM plus NFL (B), and axon calibers of the transfected neurons were measured at 3 DPT from EGFP fluorescent images of proximal axons. Scale bar: (in B) A, B, 10 μm. C, Compared with what was seen for axons transfected with EGFP alone, the average caliber of axons significantly increased when NFM plus NFL or NFH plus NFL were cotransfected but not when individual NF subunits were transfected. This effect was much more striking in the axons cotransfected with NFM and NFL compared with those with NFH and NFL. A and B are the representative images of the proximal axon regions transfected with EGFP empty vector alone and together with NFM plus NFL, respectively. The abundant branching of distal axons precluded meaningful comparisons of axon calibers at this level. Data are presented as mean ± SEM (n = 8). AU, Arbitrary units.
NFs are stationary in axons in vivo
Our previous quantitative studies on the long-term fate of pulse-radiolabeled NF protein in vivo provided evidence that most NFs in axons of RGC neurons exist in a nonuniform stationary NF network (Nixon and Logvinenko, 1986). Although this concept was challenged on technical grounds (Lasek et al., 1992; Brown et al., 2005), the different experimental conditions used in the study by Lasek et al. (1992), especially the use of different electrophoresis conditions and a different radioisotopic amino acid, which yielded very low radioactivity levels and different protein labeling patterns, introduced variables absent from our earlier study (Nixon and Logvinenko, 1986) and precluded any valid comparison with our earlier study. To establish further the characteristics of the stationary pool of NFs in optic axons, we determined how newly synthesized radiolabeled NFL and NFM subunits are distributed along RGC axons at intervals from 3 to 198 d after intravitreous injection of [3H]proline. During the first 71–75 d after injection, the wave front of radiolabeled NF proteins moved through consecutive optic pathway segments (Fig. 8A); however, after 71–75 d, little change occurred over the next 117–128 d in the distribution of radiolabeled NFs that remained in axons. The proportion of radiolabeled NF proteins in the optic nerve (segments 1–4) remained constant (37.5%) between 71–75 and 192–198 d after injection. The persistence of radiolabeled free amino acid in RGC perikarya bodies cannot account for appreciable ongoing export of new radiolabeled proteins into the nerve beyond 1 week after intravitreous injection (Nixon and Logvinenko, 1986). The kinetics and axonal distribution of radiolabeled NF proteins after 71–75 d indicate that these “retained” NFs are stationary.
Figure 8.

Radiolabeled NFs in mature axons are stationary for up to 198 d in vivo. A, The optic pathways from mice at various intervals after intravitreous injection of [3H]proline were cut into eight consecutive 1 mm segments as described in Materials and Methods. Each segment was combined with corresponding segments from six to eight mice and, after Triton-insoluble preparations were resolved by SDS-PAGE, radioactivity associated with NF proteins was quantitated for each site along the optic pathway. Postinjection intervals are shown in the figure. The symbols indicate NFL (squares) and NFM (diamonds). Each time point is the average of from two to four separate experiments, each involving six to eight mice (mean ± SEM). B, NFs pulse-labeled in vivo disappear from optic axons at two different rates. Radiolabled NFM protein within a standard 8 mm segment of the mouse optic pathway disappeared rapidly (t1/2 = 22 d) (inset graph) in the first 50 d, consistent with the exit from this segment of axons at the typical rate of slow axonal transport. Another pool of radiolabeled NF proteins, corresponding to the pool of retained or stationary NFs, disappeared much more slowly between 50 and 240 d (t1/2 = 83 d) (inset graph). The smaller pool of the slowly disappearing labeled NF proteins contributes to the most to the total NF content of axons.
Slow turnover of stationary NFs in vivo
To estimate the relative proportions of stationary NF in optic axons, we measured the rate of loss of [3H]proline-labeled NFs proteins after they enter into optic axons. If identical amounts of [3H]proline are administered intravitreously to each mouse in a single large group, levels of NF-associated radioactivity can be compared reliably across subgroups of mice analyzed at different time intervals. Using this approach, we quantitated the total amount of radiolabeled NF protein that enters optic axons and the rate of disappearance from a standard length of the axon.
A group of 90 mice was injected intravitreously with [3H]proline, and three groups of 4 mice each were analyzed at seven different intervals between 6 and 192 d after injection. The radioactivity of the three NF subunits within an 8 mm segment of the optic pathway, designated as the axonal window, was measured after Triton-insoluble cytoskeletal fractions were prepared and subjected to SDS-PAGE using 4–7% polyacrylamide gradients. The purity of the separated subunits was further established by peptide mapping and two-dimensional gel electrophoresis (supplemental Fig. 1, available at www.jneurosci.org as supplemental material). Peak incorporation of [3H]proline into each subunit, which was previously shown to occur by 6–9 d after injection (Lewis and Nixon, 1988), was between 6000 and 9000 dpm. Data from a second group of 18 mice similarly injected and analyzed after 9, 140, or 240 d (n = 4–7 in each group) were combined by normalizing the NF-associated radioactivity at 9 d, in this experiment to that of the average dpm value at 9 d in the first experiment. Beginning at 6 d postinjection, NFs reached the end of the window, and 37% of the total labeled pool disappeared at an approximately linear rate between 6 and 50 d with a half-life of 22 d, in agreement with established SCa (Slow Component a) transport rates of 0.1–1.0 mm/d (Nixon, 1998). By 103 d after injection, >20% of the total pulse-labeled NF pool still resided in axons, and this pool of labeled NF disappeared more slowly. More than half of this pool was still present after 192 d, indicating a half-life for this retained NF population of >100 d, ∼4-fold slower than the residence time in axons of NFs in slow transport. Therefore, the stationary NF pool, conservatively estimated at 37% of total newly synthesized NF proteins entering axons, represents at least 90% of the axonal NFs at steady state. This percentage of labeled NFs retained in axons represents an underestimate because we did not include the entire length of the optic tract in the 8 mm window analyzed. Extrapolating to the total length of the optic nerve and tract (11 mm) yields the estimate that >95% of NF in optic axons is present in the stationary cytoskeleton and <5% is undergoing slow transport.
Discussion
Our studies reconcile in vitro and in vivo views of NF transport by directly showing that neurons expressing sufficient levels of NF subunits establish an unequivocally immobile NF network along axons, maintained by filaments or nonfilamentous subunit assemblies undergoing slow axonal transport. Formation of this NF stationary network was associated with radial growth of axons in primary cortical neurons, similar to the relationship seen in vivo (Hoffman et al., 1987) (Nixon et al., 1994). In our study, we could discern less than a 0.5 μm displacement of the edge of the window of EGFP-NFs flanked by two photobleached zones. The absence of a detectable displacement or spreading of this window during a 5 h interval of observation indicates that, if these NFs were not stationary, their movement was <0.00003 μm s−1 (Figs. 5, 9), which is at least 100-fold slower than NFs moving in slow transport in vivo and at least 600-fold slower than the slowest-moving “on-track” NFs reported in in vitro studies (Wang et al., 2000). These results in primary cortical neurons are in accord with our current in vivo studies and our earlier studies (Nixon and Logvinenko, 1986), which showed no net redistribution of radiolabeled NFs proximally to distally along optic axons from 71–75 to 192–198 d after isotope injection. In both experimental systems, the stationary NF network was highly stable metabolically. Estimated NF subunit half-lives of more than several months are similar to those recently calculated in vivo based on the disappearance of exogenous NFL after its synthesis was inhibited in tetracycline-controlled human NFL transgenic mice (Millecamps et al., 2007).
Figure 9.
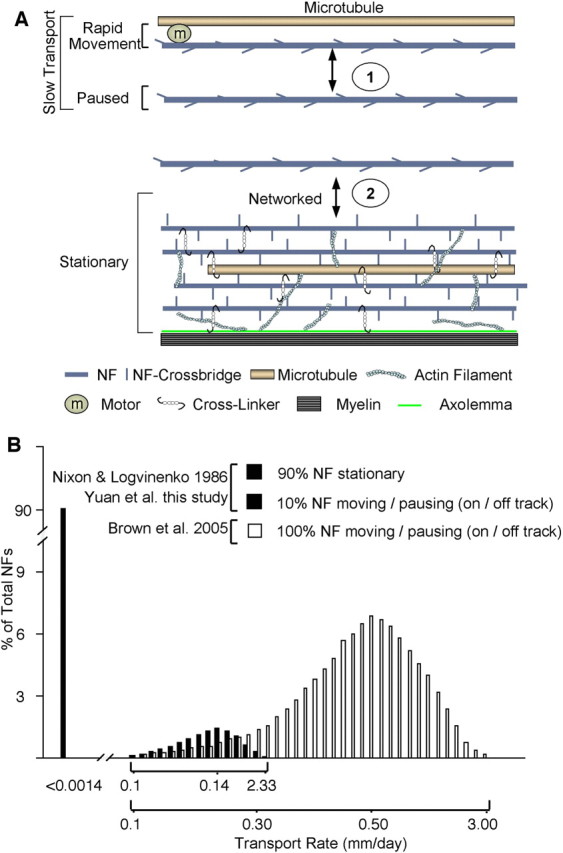
Distinctions between models of NF behavior in axons. A, Based on our data and others referenced in the text, the formation and maintenance of the NF cytoskeleton in axons consists of two major processes. (1) Slow transport reflecting the net rate of NF translocation achieved by rapid movements, presumably involving a molecular motor moving on microtubules (on track), and “pauses” (off track) of varying duration, including ones of longer duration [e.g., 1 h in cultured neurons, recently described by Trivedi et al. (2007)]. This process corresponds to the transport model described by Brown and colleagues (Wang et al., 2000; Brown et al., 2005). (2) A second process, seen in axons achieving sufficient NF protein expression (e.g., most mature axons) but not in developing sympathetic neurons, involves the active integration of “off-track” NF into a distinct stationary axonal cytoskeleton composed of NF, MT, actin, and other skeletal proteins often connected by cross-linking proteins (e.g., BPAG, plectin). To account for the exceptionally slow turnover of axonal NF in vivo (half-lives of several months), we have previously proposed (Nixon and Logvinenko, 1986) that NF or NF fragments may degrade locally or very slowly detach and be transported to another site for degradation. The diagram in A and the schematic representation of experimental data (B) from our study (black columns, x-axis markers from 0.1 to 2.33) and that of Brown and colleagues (open columns, x-axis labeled 0.1–3.00) (Brown et al., 2005; Trivedi et al., 2007) illustrate the fundamental differences between our model and that of Brown and colleagues. Based on in vivo data in optic axons, >90% of NFs are stationary, defined as a rate below the limit of detection (<0.0014 mm/d), corresponding to the stationary network in A. This stationary structure is maintained by a small pool of filaments/oligomers (<10% of total NF in optic axons) that are undergoing slow transport. In the Brown model, 100% of NFs move in the slow phase of transport at a broad range of rates averaging 0.5 mm/d (Trivedi et al., 2007) (white columns). This rate is governed by the balance of rapid (on-track) movements and pauses, and most of the NFs in slow transport may be pausing or off track at any given time.
Our studies provide a basis for why a stationary NF network has not been previously detected in cultured sympathetic neurons, the system most widely used in earlier transport studies. Because sympathetic neurons in culture contain relatively few NFs, they are ideal for characterizing the kinetics of individual NFs. We observed, however, that formation of a stationary NF network requires a critical mass of NFs and possibly other factors related to a more advanced state of maturity of the neuron and associated properties of the NF. In this regard, the cortical neurons used in our studies expressed all four CNS NF subunits, which, in turn, displayed the higher state of phosphorylation that is seen at later stages of neuronal maturation. In contrast, the NFs present in sympathetic neurons, cultured at 5 d of development, lack NFH subunit and certain phosphoepitopes on NFH and NFM C-terminal domains that are associated with axonal maturation (Yan et al., 2007) and are markers of the presence of a stationary NF network (Carden et al., 1987; Lin and Szaro, 1994; Haynes et al., 2005). Cortical neurons in our studies established synaptic connections and achieved significantly higher levels of NF expression, which were further amplified by transfecting NFL and NFM to more closely mimic the neurons in the culture that were expressing the highest levels of endogenous NF proteins.
Our studies revealed striking regional differences in the kinetics and assembly states of NF proteins at different regions along axons of developing cortical neurons. The greater stability of the NF cytoskeleton network in proximal axons than more distally, where NFs are fewer, reinforces our conclusion that formation of a stationary NF cytoskeleton requires a critical level of NFs. A population of NFs with relatively longer durations of pausing in sympathetic neurons was described as corresponding to the stationary pool in vivo (Trivedi et al., 2007); however, the axonal window containing these fluorescent NFs broadened and actually move en bloc over time, indicating that these NFs were pausing, not stationary, and were still considered to be constituents of the single NF population undergoing slow axonal transport. This NF population corresponds more to that at intermediate axon regions of cortical neurons, where a discrete window of EGFP-NF broadened, suggesting some movement of individual NFs. In our studies, however, even this window of fluorescent NFs in cortical neurons was more stable than that described as stationary in sympathetic neurons because it did not move en bloc as seen in the sympathetic neuron system. The smaller subpopulation of NFs that were undergoing transport displayed the kinetic properties of slowly transported NFs as previously described (Wang et al., 2000).
The kinetics of NFs in vitro accords with the behavior of radiolabeled NFs in mature optic axons in vivo, in which stationary NFs were estimated to comprise >90% of the NFs based on the amount retained in axons and their turnover rate. The stability and stationary nature of the NF cytoskeleton is compatible with ultrastructural evidence in mature axons that NFs form extensive cross-bridges with each other through their long C-terminal tail domains and, in turn, integrate into a network with other stationary cytoskeletal elements in axons (Nixon, 1998; Prahlad et al., 2000; Perkins et al., 2008), such as microtubules (Lim et al., 1990; Okabe and Hirokawa, 1993) and the membrane skeleton (Frappier et al., 1991; Svitkina et al., 1996; Yang et al., 1996, 1999). NF proteins have binding sites for microtubule-associated proteins, such as tau (Miyata et al., 1986) and MAP1 and 2 (Leterrier et al., 1982; Miyata et al., 1986; Frappier et al., 1991; Ma et al., 2000), which are believed to mediate reversible interactions between NFs and microtubules (Leterrier and Eyer, 1987). Moreover, spectrins bind NF proteins (Frappier et al., 1987, 1991), actin (Frappier et al., 1992), and other cytoskeletal compartments of a stationary axolemma. In some neurons, BPAG (bullous pemphigoid antigen) (Yang et al., 1996, 1999) or plectin (Svitkina et al., 1996) link together NFs, microtubules, and actin filaments, possibly tethering the cortical cytoskeleton to the stationary axolemma and membrane skeleton (Hirokawa, 1982).
The stationary cytoskeleton model based on our data (Fig. 9) is fundamentally different from the single NF population transport model of Brown and colleagues. Our data show that the vast majority of NF in mature axons are stationary (fixed in place for months in vivo) and below limits of movement detection (i.e., at least 100-fold slower than the average transport rate in vitro) and that they compose a distinctive cross-linked network in axons with other cytoskeletal elements as visualized ultrastructurally. The stationary cytoskeleton can be compared by analogy to a building formed from different structural elements (e.g., NFs) delivered to the construction site over time (i.e., slow transport), some of which are then joined together to create the building. There is no equivalent to the building in the Brown model, which our data suggest is because developing sympathetic neurons do not express sufficient numbers of NFs to induce formation of a stationary cytoskeleton. In the Brown model, the NF cytoskeleton as composed of a single population of NFs moving and pausing to achieve an average rate for the population that defines slow NF transport. According to this model, all NFs are within slow transport (Fig. 9), which may well apply to highly immature axons containing few filaments, such as developing sympathetic neurons.
The two models of the axonal cytoskeleton in Figure 9 have different functional/mechanistic implications. For example, the Brown model implies that NFs in a segment of an axon would be replaced (turned over) at a rate governed by the length of the axon segment and the rate of slow transport. This prediction is not supported by our data [Nixon and Logvinenko (1986) and present work[ and the work of the Julien group (Millecamps et al., 2007). The turnover of NF from a given segment of a mature axon is, in fact, several orders of magnitude slower than that predicted by the Brown model. Only a cytoskeleton that is fixed in place over many months can account for this exceptionally slow turnover, a fundamental property of NFs in axons. A fixed stable network of cytoskeletal proteins has very different functional capabilities than a fluid array of NFs moving in slow transport. In contrast to a continuing slow flow of individual fibrous elements, the formation of a fixed cytoskeletal structure in axons more easily accounts for the ultrastructural appearance of the axonal cytoskeleton as an extensively cross-linked structure, the considerable regional variation in NF abundance and architecture along axons, roles for the exceptionally complex regulation of NFs by phosphorylation, and emerging evidence that NFs act as a stable scaffold for vesicles and membrane-bound receptors (M. V. Rao, P. S. Mohan, A. Kumar, L. Montagna, J. Campbell, A. Yuan, E. M. Espreafico, J. P. Julien, and R. A. Nixon, unpublished observations).
An NF cytoskeleton that is stationary and relatively metabolically stable also has distinct advantages for neurons over an NF cytoskeleton that is continually replaced at the rate of slow axonal transport. One advantage is the much smaller metabolic burden required to maintain the axon. The axon often comprises 99% of the neuron's total volume, so continually replacing its structural lattice, a huge proportion of the total cellular protein content, constitutes a great synthetic burden. By establishing a stationary network of slowly turned-over proteins, neurons can maintain the cytoskeleton with far less new protein synthesis. Based on quantitative autoradiographic analyses, neurons having the largest axons synthesize 100- to 300-fold less protein than would be expected if their axonal constituents were being replaced in proportion to the volume of axoplasm (von Bernhardi and Alvarez, 1989). Also, new data are emerging that the NF network acts as a scaffold for anchoring proteins and certain organelles within specific domains of the neuron, which may significantly influence their function (Ehlers et al., 1998; Kim et al., 2002; Ratnam and Teichberg, 2005). Each of these scaffolding roles is better served by an immobile and stable three-dimensional superstructure.
Footnotes
This work was supported by Grant 5R01AG005604 (R.A.N.) from the National Institutes on Aging. We thank Corrinne Peterhoff for assistance with figures and Nicole Piorkowski for manuscript preparation.
References
- Ackerley S, Grierson AJ, Brownlees J, Thornhill P, Anderton BH, Leigh PN, Shaw CE, Miller CC. Glutamate slows axonal transport of neurofilaments in transfected neurons. J Cell Biol. 2000;150:165–176. doi: 10.1083/jcb.150.1.165. [DOI] [PMC free article] [PubMed] [Google Scholar]
- Brown A, Wang L, Jung P. Stochastic simulation of neurofilament transport in axons: the “stop-and-go” hypothesis. Mol Biol Cell. 2005;16:4243–4255. doi: 10.1091/mbc.E05-02-0141. [DOI] [PMC free article] [PubMed] [Google Scholar]
- Carden MJ, Trojanowski JQ, Schlaepfer WW, Lee VM. Two-stage expression of neurofilament polypeptides during rat neurogenesis with early establishment of adult phosphorylation patterns. J Neurosci. 1987;7:3489–3504. doi: 10.1523/JNEUROSCI.07-11-03489.1987. [DOI] [PMC free article] [PubMed] [Google Scholar]
- Ching GY, Liem RK. Assembly of type IV neuronal intermediate filaments in nonneuronal cells in the absence of preexisting cytoplasmic intermediate filaments. J Cell Biol. 1993;122:1323–1335. doi: 10.1083/jcb.122.6.1323. [DOI] [PMC free article] [PubMed] [Google Scholar]
- Ehlers MD, Fung ET, O'Brien RJ, Huganir RL. Splice variant-specific interaction of the NMDA receptor subunit NR1 with neuronal intermediate filaments. J Neurosci. 1998;18:720–730. doi: 10.1523/JNEUROSCI.18-02-00720.1998. [DOI] [PMC free article] [PubMed] [Google Scholar]
- Elder GA, Friedrich VL, Jr, Bosco P, Kang C, Gourov A, Tu PH, Lee VM, Lazzarini RA. Absence of the mid-sized neurofilament subunit decreases axonal calibers, levels of light neurofilament (NF-L), and neurofilament content. J Cell Biol. 1998;141:727–739. doi: 10.1083/jcb.141.3.727. [DOI] [PMC free article] [PubMed] [Google Scholar]
- Eyer J, Peterson A. Neurofilament-deficient axons and perikaryal aggregates in viable transgenic mice expressing a neurofilament-beta-galactosidase fusion protein. Neuron. 1994;12:389–405. doi: 10.1016/0896-6273(94)90280-1. [DOI] [PubMed] [Google Scholar]
- Frappier T, Regnouf F, Pradel LA. Binding of brain spectrin to the 70-kDa neurofilament subunit protein. Eur J Biochem. 1987;169:651–657. doi: 10.1111/j.1432-1033.1987.tb13657.x. [DOI] [PubMed] [Google Scholar]
- Frappier T, Stetzkowski-Marden F, Pradel LA. Interaction domains of neurofilament light chain and brain spectrin. Biochem J. 1991;275:521–527. doi: 10.1042/bj2750521. [DOI] [PMC free article] [PubMed] [Google Scholar]
- Frappier T, Derancourt J, Pradel LA. Actin and neurofilament binding domain of brain spectrin beta subunit. Eur J Biochem. 1992;205:85–91. doi: 10.1111/j.1432-1033.1992.tb16754.x. [DOI] [PubMed] [Google Scholar]
- Fuchs E, Cleveland DW. A structural scaffolding of intermediate filaments in health and disease. Science. 1998;279:514–519. doi: 10.1126/science.279.5350.514. [DOI] [PubMed] [Google Scholar]
- Gill SR, Wong PC, Monteiro MJ, Cleveland DW. Assembly properties of dominant and recessive mutations in the small mouse neurofilament (NF-L) subunit. J Cell Biol. 1990;111:2005–2019. doi: 10.1083/jcb.111.5.2005. [DOI] [PMC free article] [PubMed] [Google Scholar]
- Haynes RL, Borenstein NS, Desilva TM, Folkerth RD, Liu LG, Volpe JJ, Kinney HC. Axonal development in the cerebral white matter of the human fetus and infant. J Comp Neurol. 2005;484:156–167. doi: 10.1002/cne.20453. [DOI] [PubMed] [Google Scholar]
- Hirokawa N. Cross-linker system between neurofilaments, microtubules, and membranous organelles in frog axons revealed by the quick-freeze, deep-etching method. J Cell Biol. 1982;94:129–142. doi: 10.1083/jcb.94.1.129. [DOI] [PMC free article] [PubMed] [Google Scholar]
- Hirokawa N. Molecular architecture and dynamics of the neuronal cytoskeleton. In: Burgoyne RD, editor. The neuronal cytoskeleton. New York: Wiley; 1991. pp. 5–74. [Google Scholar]
- Hirokawa N. Axonal transport and the cytoskeleton. Curr Opin Neurobiol. 1993;3:724–731. doi: 10.1016/0959-4388(93)90144-n. [DOI] [PubMed] [Google Scholar]
- Hoffman PN, Cleveland DW, Griffin JW, Landes PW, Cowan NJ, Price DL. Neurofilament gene expression: a major determinant of axonal caliber. Proc Natl Acad Sci U S A. 1987;84:3472–3476. doi: 10.1073/pnas.84.10.3472. [DOI] [PMC free article] [PubMed] [Google Scholar]
- Hursh J. Conduction velocity and diameter of nerve fibers. Am J Physiol. 1939;127:131–139. [Google Scholar]
- Kim OJ, Ariano MA, Lazzarini RA, Levine MS, Sibley DR. Neurofilament-M interacts with the D1 dopamine receptor to regulate cell surface expression and desensitization. J Neurosci. 2002;22:5920–5930. doi: 10.1523/JNEUROSCI.22-14-05920.2002. [DOI] [PMC free article] [PubMed] [Google Scholar]
- Laemmli UK. Cleavage of structural proteins during the assembly of the head of bacteriophage T4. Nature. 1970;227:680–685. doi: 10.1038/227680a0. [DOI] [PubMed] [Google Scholar]
- Lasek RJ, Paggi P, Katz MJ. Slow axonal transport mechanisms move neurofilaments relentlessly in mouse optic axons. J Cell Biol. 1992;117:607–616. doi: 10.1083/jcb.117.3.607. [DOI] [PMC free article] [PubMed] [Google Scholar]
- Lee MK, Cleveland DW. Neuronal intermediate filaments. Annu Rev Neurosci. 1996;19:187–217. doi: 10.1146/annurev.ne.19.030196.001155. [DOI] [PubMed] [Google Scholar]
- Leterrier JF, Eyer J. Properties of highly viscous gels formed by neurofilaments in vitro. A possible consequence of a specific inter-filament cross-bridging. Biochem J. 1987;245:93–101. doi: 10.1042/bj2450093. [DOI] [PMC free article] [PubMed] [Google Scholar]
- Leterrier JF, Liem RK, Shelanski ML. Interactions between neurofilaments and microtubule-associated proteins: a possible mechanism for intraorganellar bridging. J Cell Biol. 1982;95:982–986. doi: 10.1083/jcb.95.3.982. [DOI] [PMC free article] [PubMed] [Google Scholar]
- Lewis SE, Nixon RA. Multiple phosphorylated variants of the high molecular mass subunit of neurofilaments in axons of retinal cell neurons: characterization and evidence for their differential association with stationary and moving neurofilaments. J Cell Biol. 1988;107:2689–2701. doi: 10.1083/jcb.107.6.2689. [DOI] [PMC free article] [PubMed] [Google Scholar]
- Lim SS, Edson KJ, Letourneau PC, Borisy GG. A test of microtubule translocation during neurite elongation. J Cell Biol. 1990;111:123–130. doi: 10.1083/jcb.111.1.123. [DOI] [PMC free article] [PubMed] [Google Scholar]
- Lin W, Szaro BG. Maturation of neurites in mixed cultures of spinal cord neurons and muscle cells from Xenopus laevis embryos followed with antibodies to neurofilament proteins. J Neurobiol. 1994;25:1235–1248. doi: 10.1002/neu.480251006. [DOI] [PubMed] [Google Scholar]
- Ma D, Himes BT, Shea TB, Fischer I. Axonal transport of microtubule-associated protein 1B (MAP1B) in the sciatic nerve of adult rat: distinct transport rates of different isoforms. J Neurosci. 2000;20:2112–2120. doi: 10.1523/JNEUROSCI.20-06-02112.2000. [DOI] [PMC free article] [PubMed] [Google Scholar]
- Millecamps S, Gowing G, Corti O, Mallet J, Julien JP. Conditional NF-L transgene expression in mice for in vivo analysis of turnover and transport rate of neurofilaments. J Neurosci. 2007;27:4947–4956. doi: 10.1523/JNEUROSCI.5299-06.2007. [DOI] [PMC free article] [PubMed] [Google Scholar]
- Mills RG, Minamide LS, Yuan A, Bamburg JR, Bray JJ. Slow axonal transport of soluble actin with actin depolymerizing factor, cofilin, and profilin suggests actin moves in an unassembled form. J Neurochem. 1996;67:1225–1234. doi: 10.1046/j.1471-4159.1996.67031225.x. [DOI] [PubMed] [Google Scholar]
- Miyata Y, Hoshi M, Nishida E, Minami Y, Sakai H. Binding of microtubule-associated protein 2 and tau to the intermediate filament reassembled from neurofilament 70-kDa subunit protein. Its regulation by calmodulin. J Biol Chem. 1986;261:13026–13030. [PubMed] [Google Scholar]
- Nixon RA. The slow axonal transport of cytoskeletal proteins. Curr Opin Cell Biol. 1998;10:87–92. doi: 10.1016/s0955-0674(98)80090-2. [DOI] [PubMed] [Google Scholar]
- Nixon RA, Logvinenko KB. Multiple fates of newly synthesized neurofilament proteins: evidence for a stationary neurofilament network distributed nonuniformly along axons of retinal ganglion cell neurons. J Cell Biol. 1986;102:647–659. doi: 10.1083/jcb.102.2.647. [DOI] [PMC free article] [PubMed] [Google Scholar]
- Nixon RA, Paskevich PA, Sihag RK, Thayer CY. Phosphorylation on carboxyl terminus domains of neurofilament proteins in retinal ganglion cell neurons in vivo: influences on regional neurofilament accumulation, interneurofilament spacing, and axon caliber. J Cell Biol. 1994;126:1031–1046. doi: 10.1083/jcb.126.4.1031. [DOI] [PMC free article] [PubMed] [Google Scholar]
- Ohara O, Gahara Y, Miyake T, Teraoka H, Kitamura T. Neurofilament deficiency in quail caused by nonsense mutation in neurofilament-L gene. J Cell Biol. 1993;121:387–395. doi: 10.1083/jcb.121.2.387. [DOI] [PMC free article] [PubMed] [Google Scholar]
- Okabe S, Hirokawa N. Do photobleached fluorescent microtubules move?: re-evaluation of fluorescence laser photobleaching both in vitro and in growing Xenopus axon. J Cell Biol. 1993;120:1177–1186. doi: 10.1083/jcb.120.5.1177. [DOI] [PMC free article] [PubMed] [Google Scholar]
- Perkins GA, Sosinsky GE, Ghassemzadeh S, Perez A, Jones Y, Ellisman MH. Electron tomographic analysis of cytoskeletal cross-bridges in the paranodal region of the node of Ranvier in peripheral nerves. J Struct Biol. 2008;161:469–480. doi: 10.1016/j.jsb.2007.10.005. [DOI] [PMC free article] [PubMed] [Google Scholar]
- Prahlad V, Helfand BT, Langford GM, Vale RD, Goldman RD. Fast transport of neurofilament protein along microtubules in squid axoplasm. J Cell Sci. 2000;113:3939–3946. doi: 10.1242/jcs.113.22.3939. [DOI] [PubMed] [Google Scholar]
- Rao MV, Houseweart MK, Williamson TL, Crawford TO, Folmer J, Cleveland DW. Neurofilament-dependent radial growth of motor axons and axonal organization of neurofilaments does not require the neurofilament heavy subunit (NF-H) or its phosphorylation. J Cell Biol. 1998;143:171–181. doi: 10.1083/jcb.143.1.171. [DOI] [PMC free article] [PubMed] [Google Scholar]
- Rao MV, Campbell J, Yuan A, Kumar A, Gotow T, Uchiyama Y, Nixon RA. The neurofilament middle molecular mass subunit carboxyl-terminal tail domains is essential for the radial growth and cytoskeletal architecture of axons but not for regulating neurofilament transport rate. J Cell Biol. 2003;163:1021–1031. doi: 10.1083/jcb.200308076. [DOI] [PMC free article] [PubMed] [Google Scholar]
- Ratnam J, Teichberg VI. Neurofilament-light increases the cell surface expression of the N-methyl-D-aspartate receptor and prevents its ubiquitination. J Neurochem. 2005;92:878–885. doi: 10.1111/j.1471-4159.2004.02936.x. [DOI] [PubMed] [Google Scholar]
- Roy S, Coffee P, Smith G, Liem RK, Brady ST, Black MM. Neurofilaments are transported rapidly but intermittently in axons: implications for slow axonal transport. J Neurosci. 2000;20:6849–6861. doi: 10.1523/JNEUROSCI.20-18-06849.2000. [DOI] [PMC free article] [PubMed] [Google Scholar]
- Sasaki T, Gotow T, Shiozaki M, Sakaue F, Saito T, Julien JP, Uchiyama Y, Hisanaga S. Aggregate formation and phosphorylation of neurofilament-L Pro22 Charcot-Marie-Tooth disease mutants. Hum Mol Genet. 2006;15:943–952. doi: 10.1093/hmg/ddl011. [DOI] [PubMed] [Google Scholar]
- Svitkina TM, Verkhovsky AB, Borisy GG. Plectin sidearms mediate interaction of intermediate filaments with microtubules and other components of the cytoskeleton. J Cell Biol. 1996;135:991–1007. doi: 10.1083/jcb.135.4.991. [DOI] [PMC free article] [PubMed] [Google Scholar]
- Trivedi N, Jung P, Brown A. Neurofilaments switch between distinct mobile and stationary states during their transport along axons. J Neurosci. 2007;27:507–516. doi: 10.1523/JNEUROSCI.4227-06.2007. [DOI] [PMC free article] [PubMed] [Google Scholar]
- von Bernhardi R, Alvarez J. Is the supply of axoplasmic proteins a burden for the cell body? Morphometry of sensory neurons and amino acid incorporation into their cell bodies. Brain Res. 1989;478:301–308. doi: 10.1016/0006-8993(89)91510-2. [DOI] [PubMed] [Google Scholar]
- Wang L, Ho CL, Sun D, Liem RK, Brown A. Rapid movement of axonal neurofilaments interrupted by prolonged pauses. Nat Cell Biol. 2000;2:137–141. doi: 10.1038/35004008. [DOI] [PubMed] [Google Scholar]
- Xu Z, Cork LC, Griffin JW, Cleveland DW. Increased expression of neurofilament subunit NF-L produces morphological alterations that resemble the pathology of human motor neuron disease. Cell. 1993;73:23–33. doi: 10.1016/0092-8674(93)90157-l. [DOI] [PubMed] [Google Scholar]
- Xu Z, Marszalek JR, Lee MK, Wong PC, Folmer J, Crawford TO, Hsieh ST, Griffin JW, Cleveland DW. Subunit composition of neurofilaments specifies axonal diameter. J Cell Biol. 1996;133:1061–1069. doi: 10.1083/jcb.133.5.1061. [DOI] [PMC free article] [PubMed] [Google Scholar]
- Yan Y, Jensen K, Brown A. The polypeptide composition of moving and stationary neurofilaments in cultured sympathetic neurons. Cell Motil Cytoskeleton. 2007;64:299–309. doi: 10.1002/cm.20184. [DOI] [PMC free article] [PubMed] [Google Scholar]
- Yang Y, Dowling J, Yu QC, Kouklis P, Cleveland DW, Fuchs E. An essential cytoskeletal linker protein connecting actin microfilaments to intermediate filaments. Cell. 1996;86:655–665. doi: 10.1016/s0092-8674(00)80138-5. [DOI] [PubMed] [Google Scholar]
- Yang Y, Bauer C, Strasser G, Wollman R, Julien JP, Fuchs E. Integrators of the cytoskeleton that stabilize microtubules. Cell. 1999;98:229–238. doi: 10.1016/s0092-8674(00)81017-x. [DOI] [PubMed] [Google Scholar]
- Yuan A. Neurofilament protein partnership, export, transport, phosphorylation and neurodegeneration. In: Arlen RK, editor. New research on neurofilament proteins. New York: Nova Science; 2007. pp. 53–79. [Google Scholar]
- Yuan A, Mills RG, Chia CP, Bray JJ. Tubulin and neurofilament proteins are transported differently in axons of chicken motoneurons. Cell Mol Neurobiol. 2000;20:623–632. doi: 10.1023/A:1007090422866. [DOI] [PMC free article] [PubMed] [Google Scholar]
- Yuan A, Rao MV, Kumar A, Julien JP, Nixon RA. Neurofilament transport in vivo minimally requires hetero-oligomer formation. J Neurosci. 2003;23:9452–9458. doi: 10.1523/JNEUROSCI.23-28-09452.2003. [DOI] [PMC free article] [PubMed] [Google Scholar]
- Yuan A, Rao MV, Sasaki T, Chen Y, Kumar A, Veeranna, Liem RK, Eyer J, Peterson AC, Julien JP, Nixon RA. α-Internexin is structurally and functionally associated with the neurofilament triplet proteins in the mature CNS. J Neurosci. 2006;26:10006–10019. doi: 10.1523/JNEUROSCI.2580-06.2006. [DOI] [PMC free article] [PubMed] [Google Scholar]
- Yuan A, Kumar A, Peterhoff C, Duff K, Nixon RA. Axonal transport rates in vivo are unaffected by tau deletion or overexpression in mice. J Neurosci. 2008;28:1682–1687. doi: 10.1523/JNEUROSCI.5242-07.2008. [DOI] [PMC free article] [PubMed] [Google Scholar]
- Zhu Q, Couillard-Després S, Julien JP. Delayed maturation of regenerating myelinated axons in mice lacking neurofilaments. Exp Neurol. 1997;148:299–316. doi: 10.1006/exnr.1997.6654. [DOI] [PubMed] [Google Scholar]