Abstract
Dihydropteroate synthase (DHPS) is the target of the sulfonamide class of antibiotics and has been a validated antibacterial drug target for nearly 70 years. The sulfonamides target the p-aminobenzoic acid (pABA) binding site of DHPS and interfere with folate biosynthesis and ultimately prevent bacterial replication. However, widespread bacterial resistance to these drugs has severely limited their effectiveness. This study explores the second and more highly conserved pterin binding site of DHPS as an alternative approach to developing novel antibiotics that avoid resistance. In this study, five commonly-used docking programs, FlexX, Surflex, Glide, GOLD, and DOCK, and nine scoring functions, were evaluated for their ability to rank-order potential lead compounds for an extensive virtual screening study of the pterin binding site of B. anthracis DHPS. Their performance in ligand docking and scoring was judged by their ability to reproduce a known inhibitor conformation and to efficiently detect known active compounds seeded into three separate decoy sets. Two other metrics were used to assess performance; enrichment at 1% and 2%, and Receiver Operating Characteristic (ROC) curves. The effectiveness of post-docking relaxation prior to rescoring and consensus scoring were also evaluated. Finally, we have developed a straightforward statistical method of including the inhibition constants of the known active compounds when analyzing enrichment results to more accurately assess scoring performance, which we call the ‘sum of the sum of log rank’ or SSLR. Of the docking and scoring functions evaluated, Surflex with Surflex-Score and Glide with GlideScore were the best overall performers for use in virtual screening against the DHPS target, with neither combination showing statistically significant superiority over the other in enrichment studies or pose selection. Post-docking ligand relaxation and consensus scoring did not improve overall enrichment.
INTRODUCTION
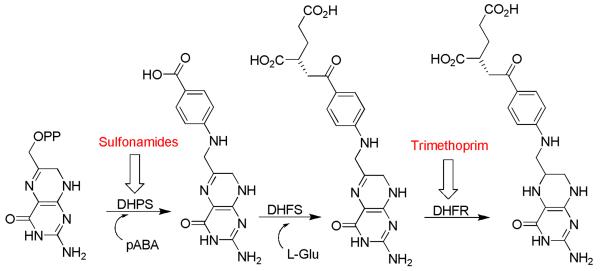
The enzyme dihydropteroate synthase (DHPS) catalyzes the addition of p-amino benzoic acid (pABA) to dihydropterin pyrophosphate (DHPP) to form dihydropteroate as a key step in bacterial folate biosynthesis (Figure 1). DHPS is the target of the sulfonamide antibiotics that mimic pABA and bind to the pABA binding site of the enzyme. Interruption of the folate biosynthetic pathway by these agents results in an inability of bacteria to perform one-carbon transfer reactions, which includes the synthesis of nucleic acid precursors essential for DNA synthesis. Sulfonamides have been used since the 1930's to treat a wide variety of Gram-positive and Gram-negative infections. However, bacterial resistance and undesirable side effects have limited the clinical usefulness of these antibiotics.1 The pterin binding pocket in DHPS represents an attractive alternative target for the design of novel antibacterial agents. There is a high degree of conservation in the residues that comprise this pocket, and no resistance mutations have been documented in or adjacent to this site (Figure 2). To date, a variety of DHPS apo- and holo- crystal structures have been deposited in the Protein Data Bank from six bacterial species (E. coli, S. aureus, M. tuberculosis, B. anthracis, T. thermophilus, and S. pneumonia) as well as one fungal species (S. cerevisiae).2-8
Figure 1.
Key steps in the bacterial folate pathway. Enzyme targets of the sulfonamide drug class and trimethoprim are indicated.
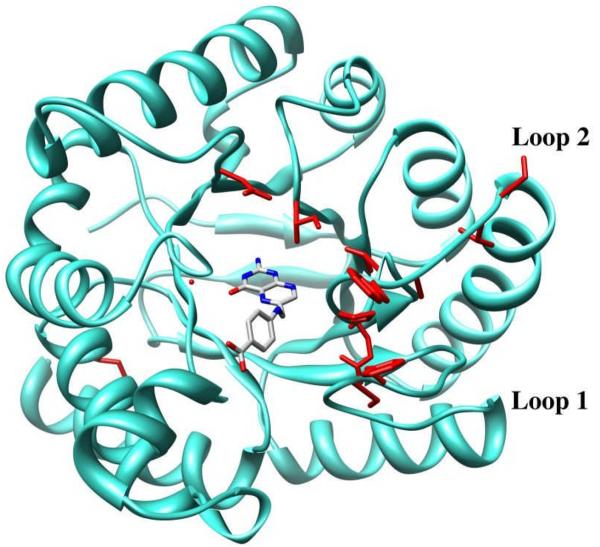
Figure 2.
B. anthracis DHPS enzyme shown with loops 1 and 2 modeled. Product pteroic acid is shown in the pterin site. Residues conferring sulfonamide resistance are shown in red and loops 1 and 2 are labeled.
The overall goal of this research project is the discovery of novel compounds with significant binding affinities for the pterin pocket of B. anthracis DHPS using virtual screening approaches. Large-scale virtual screening or high-throughput molecular docking (HTD) of in-house or commercial databases has become a common lead discovery technique in drug design. It has been shown to be a complementary tool to traditional, high-throughput screening, with hit rates that can be orders of magnitude higher than those from the latter.9 In this study, we specifically address the problem of selecting an appropriate docking and scoring combination for virtual screening against a specific target and accurately rank-ordering the virtual hits for further analysis. A review of the literature reveals that there are many docking programs and scoring functions which have been investigated in numerous docking validation studies since 2000.10-24 It is clear from these studies that, given the large number of docking and scoring functions available, and the variability in their performance with different targets, it is crucial to perform a docking validation study prior to embarking on any virtual screening experiment.12, 13, 15, 20, 21, 24 Ideally, the identification of the optimal docking and scoring combination will decrease the number of false positives and false negatives while ensuring optimal hit rates.
A number of methods have been reported for validating docking programs and scoring functions.25, 26 One commonly used method is pose selection whereby docking programs are used to re-dock into the target's active site a compound with a known conformation and orientation, typically from a co-crystal structure. Programs that are able to return poses below a preselected Root Mean Square Deviation (RMSD) value from the known conformation (usually 1.5 or 2 Å depending on ligand size) are considered to have performed successfully. Pose selection is then followed by scoring and ranking to study which of the available scoring functions most accurately ranks the poses with respect to their RMSD values.
Another validation method is to dock a so-called decoy set of inactive, or presumed inactive, compounds that has been ‘seeded’ with compounds with known activity against the target in question. After ranking the docked decoy set by score, enrichment can be calculated and enrichment plots or Receiver Operating Characteristic (ROC) curves plotted.27-29 ROC curves plot the sensitivity (Se) of a given docking/scoring combination against specificity (Sp), and Area's Under the Curve (AUC) can be calculated for comparison. There are two reported advantages of ROC curves over enrichment plots; they are independent of the number of actives in the decoy set and they include information on sensitivity as well as specificity.26, 30 However, the former advantage has recently been challenged.31
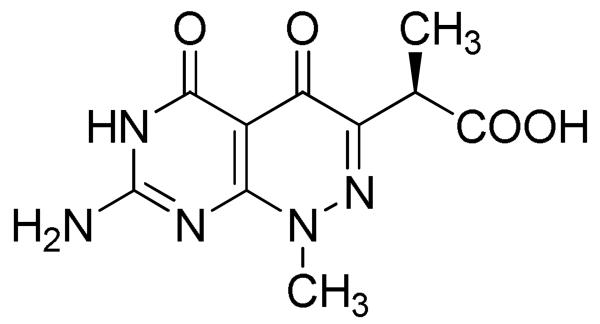
In this study of the B. anthracis DHPS pterin-binding pocket, five docking programs and nine scoring functions were evaluated using pose selection/scoring and enrichment studies. Pose selection and scoring used the 7-amino-3-(1-carboxyethyl)-1-methyl-pyrimido (4,5-c)-pyridazine-4,5(1H; 6H)-dione (AMPPD) co-crystal structure (Figures 3 and 4) as the source structure. AMPPD was first described as a pterin-based DHPS inhibitor by researchers at Burroughs Wellcome Co.32-35 We have been able to re-synthesize AMPPD and obtain a 2.3 Å resolution co-crystal structure using B. anthracis DHPS. RMSD calculations were used to determine how well specific docking/scoring combinations pose and score the ligand in the pterin site. Enrichment studies were performed using 10 compounds also identified in the Burroughs Wellcome efforts, with measured inhibitory activity against E. coli DHPS that are known to bind to the pterin-binding site.34, 35 These active compounds were seeded into three separate decoy sets, each of which has been used in previously reported docking validation studies. Enrichment at 1% and 2%, and ROC curves were used to compare docking/scoring combinations, and results across decoy set were also compared.
Figure 3.
7-amino-3-(1-carboxyethyl)-1-methyl-pyrimido (4,5-c)-pyridazine-4,5(1H; 6H)-dione, AMPPD.
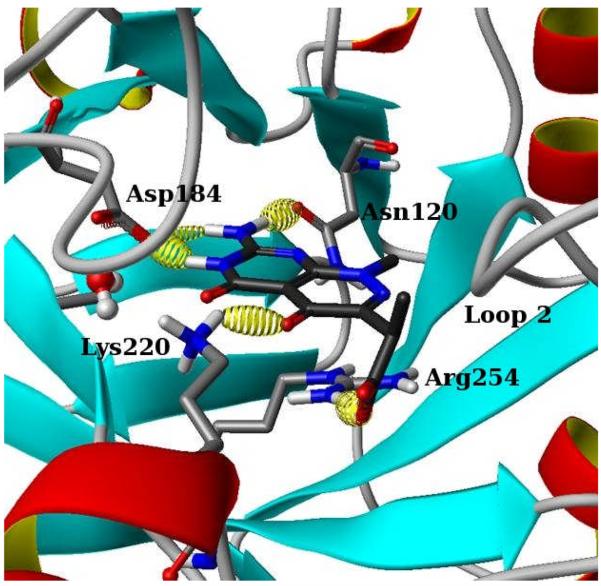
Figure 4.
AMPPD, a known DHPS inhibitor, is shown here bound into the pterin binding pocket. Key hydrogen bonds are indicated by yellow ellipsoids.
The work reported here seeks to address eight questions. (1) How useful is simple pose selection and scoring for determining the optimal docking/ scoring combinations for use against a specific target? (2) How do enrichment calculations at 1% and 2% compare with Areas under ROC curves in evaluating the docking/scoring combinations? (3) How important is decoy set selection? (4) How do docking failures affect results and how should these be accounted for? (5) How does post-docking relaxation affect enrichment results? (6) Can the use of consensus scoring improve enrichment results? (7) Is it possible to incorporate the known inhibitory activities of the seeded active compounds to more accurately distinguish between the docking/scoring combinations? Finally, and most importantly for our project, (8) which is the best docking/scoring combination for use in virtual screening against the pterin-binding pocket of the B. anthracis DHPS enzyme?
EXPERIMENTAL METHODS
Docking Programs and Scoring Functions
Five docking programs were evaluated in this study, FlexX, DOCK, Glide, GOLD, and Surflex. FlexX36 v1.20.1 and Surflex37 v2.0.1 are included in the Sybyl 7.3 molecular modeling suite of Tripos, Inc.38 GOLD39 v3.1.1 was obtained from Cambridge Crystallographic Data Centre (CCDC)40, Glide41, 42 v4.0 is available from Schrödinger, Inc.43, and DOCK44-46 v6.0 is freely available to academic institutions from the University of California, San Francisco. FlexX, Surflex, and DOCK use incremental construction algorithms to select compound poses. GOLD uses a genetic algorithm, and Glide is a hybrid method that uses a torsional energy optimization and Monte Carlo sampling47 for refinement. Nine Scoring functions were investigated. F-Score36, Surflex-Score48, ChemScore49, and GlideScore41 are empirical scoring functions, PMF-Score50 is knowledge-based, and D-Score44, G-Score39, GOLD-Score and Grid-Score are force-field scoring functions. F-Score, D-Score, G-Score, ChemScore, and PMF-Score are included in the Cscore module of Sybyl 7.3, while Surflex-Score, GOLD-Score, and GlideScore are the native scoring functions for Surflex, GOLD, and Glide, respectively. F-Score is also the native scoring function for FlexX, and Grid scoring was selected for use with the DOCK program.
DHPS Target Structure
The crystal structure of AMPPD in complex with B. anthracis DHPS (Figure 4) was used for all the molecular docking exercises performed in this study. We have determined the structures of B. anthracis DHPS in complex with several ligands including pterin site binders and a product analog.5 The AMPPD structure was chosen for use in this study for three reasons; it binds solely within the pterin binding pocket and does not interact with the adjacent pABA site, it has two rotatable bonds which adds an additional degree of complexity to the docking problem compared to the rigid pterin site binders available to us, and at 2.3 Å, its complex with DHPS is one of the highest resolution structures that we have determined. The structure was prepared using the Biopolymer tool of Sybyl 7.3. Missing residues within mobile loops 1 and 2 were modeled using the closely similar E. coli and M. tuberculosis DHPS structures previously reported.2, 4 Loops 1 and 2 are believed to participate in pABA binding and catalysis, but appear to play little or no role in pterin binding to the enzyme. Hydrogen atoms were added and AMBER FF99 charges were calculated for the protein. A structurally conserved water molecule that interacts with residues Ile187 and Gly216 directly adjacent to the pterin site was included as part of the receptor. A 1000 iteration minimization of the hydrogen atoms was followed by a 100 ps molecular dynamics simulation to refine the positions of the mobile loops 1 and 2. The simulation was performed with the Dynamics tool of Sybyl7.3 using the NTP ensemble, standard temperature and pressure, and 2 fs steps. All residues and ligands with the exception of those in loops 1 and 2 were held under tight constraints. The average structure from the last 20 ps of the simulation was calculated, and a 100 iteration minimization was applied to the entire structure to obtain the final receptor structure.
Docking Methodology
General
For consistency, site description files for all docking programs were generated using the AMPPD ligand and an 8 Å spherical radius. The structurally conserved water molecule was included in all docking runs for all programs.
FlexX v1.20.1
A receptor description file was built using the saved .pdb file. Ligands were docked as mol2 files and prepared as discussed below. All other parameters accepted default settings for docking runs.
GOLD v3.1.1
Default speed settings were accepted for both pose selection and enrichment studies. The input structure was the mol2 file with ligand extracted. The structurally conserved water molecule was set ‘on’ with spin orientation enabled, and the set atom types function was ‘on’ for ligand and ‘off’ for the protein. The fitness function was set to GOLD-Score (ChemScore disabled) with default input and annealing parameters. The Genetic Algorithm default settings were accepted as population size 100, selection pressure 1.1, number of operations 100,000, number of islands 5, niche size 2, migrate 10, mutate 95, and crossover 95. All other parameters accepted the default settings.
Surflex v2.0.1
The SFXC file was built using the mol2 prepared protein structure. The protomol was generated using the AMPPD ligand with a threshold of 0.50 and bloat set to 0 (default settings). Ligands were prepared as described below and docked as mol2 files. Cscore calculations were enabled on all Surflex docking runs. All other parameters accepted the default settings.
Glide v4.0
The receptor grid was generated using the mol2 file and was based upon the AMPPD ligand and an 8 Å enclosing box. Default values were accepted for van der Waals scaling and input partial charges were used. Standard precision docking was used for all Glide docking runs, with default settings for all other parameters and no constraints or similarity scoring applied.
DOCK v6.0
The structure and ligand were prepared as discussed above and saved as mol2 files. The molecular surface was generated with the dms tool, included in the DOCK v6.0 package, with a default probe radius of 1.4 Å. Sphgen was used to generate spheres using the dms output and default settings. The active site was defined using the sphere selector tool and an 8 Å radius about the AMPPD ligand, and a corresponding 8 Å grid was generated for scoring using the showbox and grid tools. Flexible ligand docking was utilized with grid scoring as primary and secondary scoring, and ligand minimization was enabled. All other docking parameters accepted default settings for docking runs.
Ligand Preparation
Ligands were prepared for docking using the Sybyl 7.3 Molecular Modeling Suite of Tripos, Inc. 3D conformations were generated using Concord 4.051, hydrogen atoms were added and charges were loaded using the Gasteiger and Marsili charge calculation method.52 Basic amines were protonated and acidic carboxyl groups were de-protonated prior to charge calculation. The AMPPD ligand was minimized with the Tripos Force Field prior to docking using the Powell method with an initial Simplex53 optimization and 1000 iterations or gradient termination at 0.01 kcal/(mol*A). Input ligand file format was mol2 for all docking programs investigated.
Pose Selection and Scoring
The AMPPD compound was prepared for docking as described above. It was then docked into the DHPS active site of the AMPPD co-crystal structure with each docking program using the methods described above. The number of poses returned by each docking program was determined by the default settings, and the poses were scored using that program's native scoring function. Using the five scoring functions available in the Cscore module of Sybyl, the poses were scored once again in a process that we define as ‘rescoring’. The rms analysis tool in the GOLD utilities was used to calculate non-hydrogen RMSD of the docked and scored poses relative to the crystal structure conformation of the AMPPD compound. We used an RMSD of 1.5 Å as our threshold for determining success or failure as opposed to the commonly used 2 Å because of the relatively low number of freely rotatable bonds in the AMPPD compound. For pose selection, the pose with the lowest RMSD was determined from all poses returned by the docking program, regardless of rank. For scoring utility, the RMSD of the best scoring compound was calculated (see results and discussion).
Enrichment Studies
Decoy Sets
Three compound sets that had been used in previous validation studies were chosen as the decoy sets. The Schrödinger decoy set was used to validate the Glide docking program.41, 42 It consists of 1000 drug-like compounds with an average molecular weight of 400 Daltons and was downloaded as a 3D SD file from the Schrödinger website. The ZINC decoy set of 1000 compounds was used by Pham & Jain in a validation study of the Surflex scoring function.54 The Available Chemicals Directory (ACD) decoy set of 861 compounds was used by Bissantz and co-workers in a large docking/scoring validation study.24 Both the ZINC and ACD decoy sets are available in the Sybyl demo material as 3D SLN files.
Active Compounds
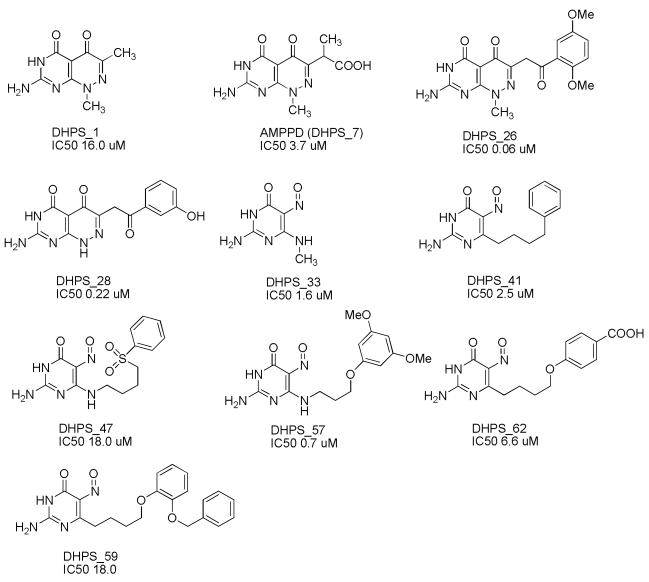
The active compounds that were seeded into each of the decoy sets are shown in Figure 5. They were chosen from a previously published series of 65 DHPS inhibitors that are known to bind to the pterin site of E. coli DHPS34, 35 which is virtually identical to that of B anthracis DHPS. The compounds were chosen to reflect as broad a range of binding affinities and structural differences as possible, with the requirement that the activity of the compounds is below an IC50 of 20 μM. The compounds were built using the Sketch tool of Sybyl 7.3 and prepared for docking as described above.
Figure 5.
DHPS active compounds used in enrichment studies with activity against E. coli DHPS shown.
Rescoring
The highest scoring pose of each compound in the enrichment sets (both active and decoy) was saved for each docking program and imported into a Sybyl Molecular Spreadsheet for rescoring using the Cscore functions F-Score, ChemScore, PMF-Score, D-Score, and G-Score. The effect of relaxing the compounds in the active site using the Cscore relaxation option was investigating by scoring before and after the relaxation. Additionally, a composite score was calculated using the 5 Cscore functions for both the relaxed and unrelaxed calculated scores.
Statistical Analysis
We have developed a non-parametric statistic, sum of the sum of log rank (SSLR) statistic, to test whether a scoring function performs better than random ordering and to compare the docking performances of two scoring functions. The SSLR statistic not only rewards early detection of active compounds but also rewards for correct ordering the active compounds by their known inhibitory constants. Early detection is rewarded by taking log transformation of ranks of the active compounds and correct ordering is rewarded by assigning heavier weight to more active compounds. To be more specific, the weight vector we chose is w = {n, n −1, …, 1}. Assuming r = {r1, r2, …, rn} is the vector of ranks of n active compounds and they have been ordered by their inhibitory constants, i.e. r1 being the rank of the most active compound and rn being the rank of the least active compound, SSLR statistic is defined as
where rj is the rank of the jth active compound among all N. By default, the smaller the inhibitory constant is the more active is the compound; small SSLR favors early detection and correct ordering of active compounds.
Just for illustration, assuming there are 10 active compounds and their ranks are 1, 2, …, 10, the SSLR statistic is different when they are ordered differently. SSLR statistic reaches minimum when the ordering is completely correct.
Test if a scoring function performs better than random scoring
The exact distribution of SSLR under null hypothesis is difficult to derive mathematically but can be easily obtained numerically by simulations. The null hypothesis assumes that the ranks of the active compounds are assigned completely at random. We simulate this random scoring study 1 million times and record all their SSLR values. The empirical distribution of the simulated values represents an estimate to the exact distribution. We believe that 1 million simulations should be sufficient enough to produce a reasonably good estimate. The p value of the test is simply the proportion of the times that the simulated SSLRs are less than the observed SSLR.
Compare the performances of two scoring functions
We have developed a permutation test to compare the performance of two scoring functions. Under the null hypothesis that two scoring functions are equal, i.e. SSLRx − SSLRy = 0, the ranks of the active compounds of the two scoring functions are interchangeable. Assuming xi and yi are ranks of the ith active compound for the two scoring functions, the permuted rank is given by and , where qi is from Bernoulli distribution with success probability 0.5. Empirical distribution of the difference of SSLR is obtained based on the permuted data and the p value of the test is given by the proportion of the times that the permuted differences are greater or less than the observed difference, depending on the direction of alternative hypothesis. For example, let x = {55,2,4,16,150,1,3,7,215,744} and y = {27,65,47,595,158.5,200,22,440.5,223,40} be the ranks of 10 active compounds from two scoring functions, our objective is to test if x is statistically better than y. The observed test statistic is SSLRx − SSLRy = 134.46 − 248.07 = −113.61. Let q = {1,1,0,1,0,0,1,0,0,1} be a vector of Bernoulli sample, the permuted data becomes x➡ = {55,2,47,16,158.5,200,3,440.5,223,744} and y➡ = {27,65,4,595,150,1,22,7,215,40} and the new statistic of the permuted data is SSLRx⬆ − SSLRy⬆ = 193.49 − 189.03 = 4.46. 1000 such permutations are calculated and the observed test statistic is less than the permuted statistic 968 times, which results in a p value of 0.03. So we conclude that x is significantly better than y.
Missing values
In situations where the docking and scoring combination failed to return poses (failed docking), we have penalized the docking/scoring combination by giving those compounds with missing scores the worst score returned by that particular scoring function for a compound in the decoy set.
RESULTS
Pose Selection and Scoring
Table 1 shows the results of the pose selection and scoring validation trials. The number of poses returned by the five individual docking programs is listed in parentheses below the docking program name. The best pose, as determined by lowest RMSD, and the rank of that pose by the docking program's native scoring function is given in column 2. Column 3 lists the RMSD of the top scored pose by the native scoring function of each docking program. Scored poses with an RMSD of less than or equal to 1.5 Å are considered to be successful. Each of the five docking programs successfully returned a correct pose, and four of the five native scoring functions ranked a correct pose as the highest. The one exception was the GOLD and Gold-Score function combination which ranked a pose with a 3.29 Å RMSD as the highest. Columns 4 through 8 in Table 1 give the rescoring results with the Cscore scoring functions; the RMSD of the top ranked pose after rescoring is presented together with the rank of that pose by the native scoring function in parentheses. In most cases, the Cscore scoring functions were able to rank successful poses, and the failures are shown in red in Table 1. Three of the scoring functions were not able to rank the FlexX poses, and D-Score performed particularly poorly in this respect, ranking a failed docking pose (outside the pterin site) as the highest. However, D Score was able to correctly rank a successful pose as the highest when used to score output from the other four docking programs. G-Score and ChemScore were not able to correctly rank poses generated by FlexX, and G-Score also failed with the poses generated by GOLD. Overall, F-Score and PMF-Score correctly rescored the poses generated by all the docking programs and were the best performing functions in this respect. We also note that the poses returned by the Surflex, Glide, and DOCK programs were always successfully scored by both the native functions and the Cscore functions.
Table 1.
Pose Selection and Scoring Results. Non-hydrogen RMSD values are shown; RMSD values less than 1.5 Angstroms are considered correct poses, greater than 1.5 Angstroms are considered failed.
| Docking Program |
Best Pose (Pose Rank) |
Native Scoring Function (1st) |
F-Score (Pose Rank) |
G-Score (Pose Rank) |
D-Score (Pose Rank) |
ChemScore (Pose Rank) |
PMF-Score (Pose Rank) |
|---|---|---|---|---|---|---|---|
|
FlexX (30 Poses) |
0.56 Å (3rd) |
1.19 Å | 1.19 Å (1st) |
1.87 Å (10th) |
17.22 Å (21st) |
1.87 Å (10th) |
1.03 Å (2nd) |
|
Surflex (10 Poses) |
1.48 Å (3rd) |
1.49 Å | 1.50 Å (10th) |
1.50 Å (10th) |
1.49 Å (6th) |
1.49 Å (1st) |
1.48 Å (4th) |
|
Glide (30 Poses) |
0.37 Å (10th) |
1.13 Å | 0.40 Å (11th) |
0.43 Å (15th) |
1.13 Å (1st) |
0.37 Å (10th) |
0.40 Å (12th) |
|
GOLD (5 Poses) |
1.30 Å (4th) |
3.29 Å | 1.30 Å (4th) |
3.37 Å (3rd) |
1.30 Å (4th) |
1.30 Å (4th) |
1.30 Å (4th) |
|
DOCK (10 Poses) |
0.38 Å (10th) |
0.85 Å | 0.85 Å (1st) |
1.00 Å (4th) |
0.52 Å (10th) |
0.85 Å (1st) |
1.00 Å (5th) |
Enrichment Calculations
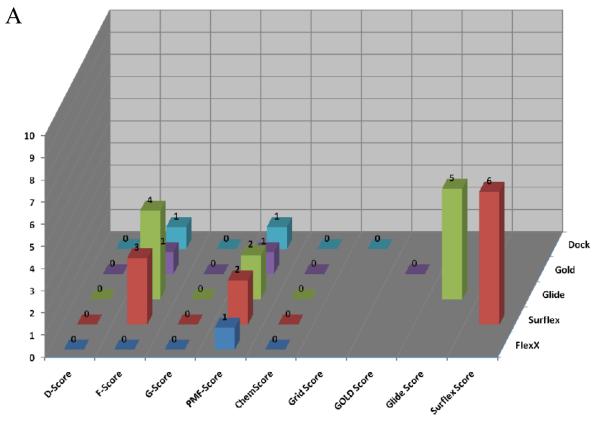
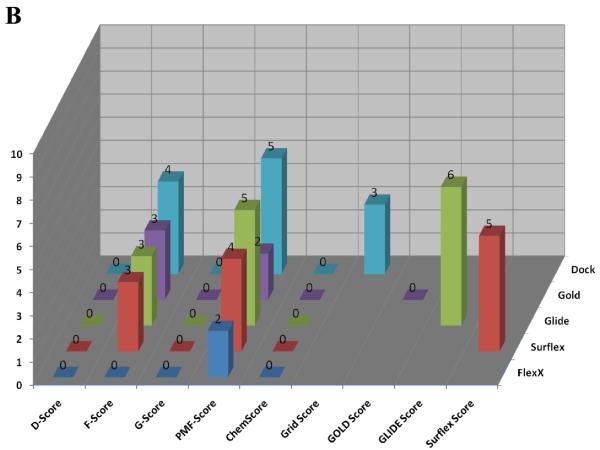
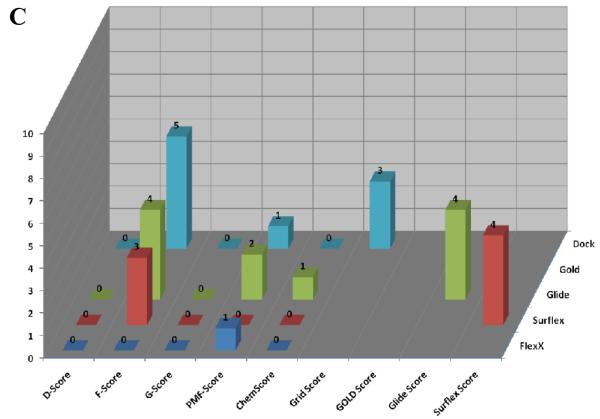
Figure 6 shows the calculated enrichment at 1% for each docking program/scoring function combination when used with each of the three decoy sets used in this study. It should be noted that we were not able to complete the GOLD docking of the ACD decoy set due to licensing issues, but the ZINC and Schrödinger decoy sets were successfully docked by the GOLD docking program. Enrichment is defined as the number of active compounds detected at a given percent of total decoy set by score ranked pose. Enrichment was calculated at 1% and 2% of the total decoy set rather than 1% and 2% of compounds successfully docked. This requires further explanation. Table 2 displays the number of poses (1 pose per compound) returned by the docking programs investigated in this validation study. It is apparent that some programs were able to return more poses than other programs, and this must be taken into account so as not to unfairly penalize programs that failed to dock some of the decoy compounds.
Figure 6.
Enrichment Factors at 1% of total validation set docked. A. ZINC decoy set; 1000 compounds + 10 actives. B. Schrödinger Decoy Set; 1000 compounds + 10 actives. C. ACD Decoy Set; 861 compounds + 10 actives
Table 2.
Active and Decoy Compounds Average Characteristics
| Set | Vol | AC | cLogP | HD | HA | RB |
|---|---|---|---|---|---|---|
| Actives | 211 | 37 | 0.29 | 3 | 7 | 5 |
| ACD | 287 | 42 | 3.27 | 2 | 4 | 5 |
| Schrödinger | 341 | 50 | 3.77 | 2 | 6 | 6 |
| ZINC | 310 | 42 | 3.02 | 1 | 4 | 5 |
Several observations can be made from the data presented in Figure 6. First, the two force field based functions, D-Score and G-Score, and the empirical function ChemScore all performed poorly for each decoy set. Second, the Glide and Surflex docking programs with their native scoring functions performed well (4 or more actives detected at 1%) against each of the three decoy sets. Finally, when used as the FlexX native scoring function, F-Score performed poorly against all three decoy sets, but when used to rescore for the other four docking programs F-Score returned modest to good results. Most notably, F-Score detected 5 of the 10 active compounds when used with DOCK against the ZINC validation set.
Enrichment was also calculated at 2% of the total decoy set docked for comparison (see supplementary material). D-Score, G-Score and ChemScore continued to perform poorly. The scoring functions F-Score and PMF-Score were able to detect on average 1 or 2 more active compounds at 2%. Notably, the top performers at 1%, GlideScore and SurflexScore, continued to show excellent results at 2%, detecting between 6 and 8 of the 10 active compounds.
When comparing the enrichment results with respect to the choice of decoy set, there was a clear difference in performance for the various docking/scoring combinations. Overall, the ZINC decoy set returned the best enrichment results, while the ACD decoy set returned the worst results. It might be expected that the docking programs would have the most difficulty in distinguishing the active compounds from the decoy set when they are close in size and lipophilicity, but this trend was not seen in our enrichment studies. The Schrödinger decoy set differed most from the active compounds with respect to these two parameters but returned the worst enrichment results, while the ZINC and ACD sets, which have the closest parameters, yielded better enrichment results.
Receiver-Operating Characteristic Curves
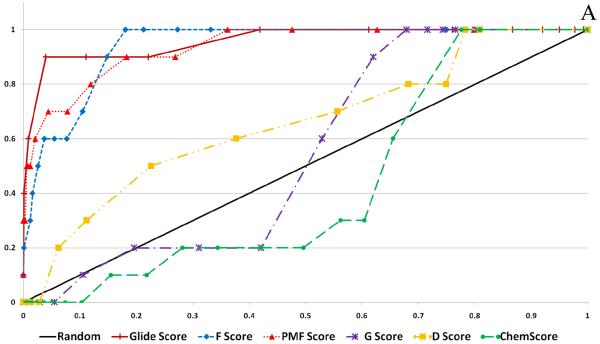
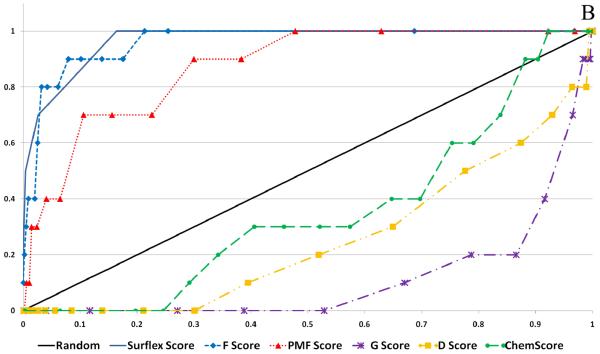
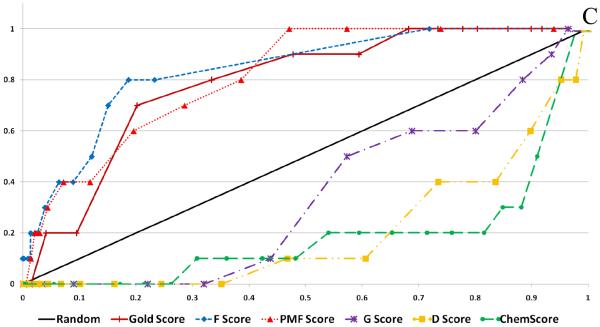
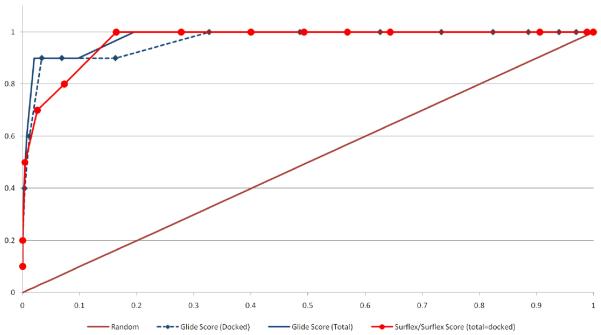
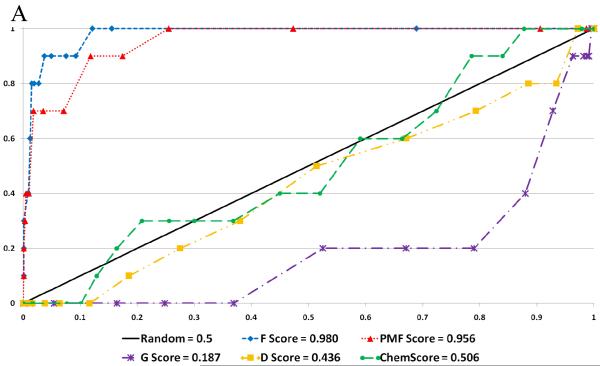
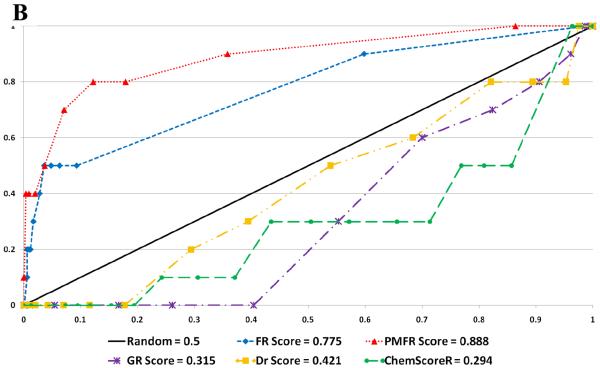
Figure 7 shows representative ROC plots for three of the five docking programs evaluated in this study. The results from the native scoring functions and from rescoring with the five Cscore scoring functions are shown. The calculated areas under the receiver-operating characteristic curves (AU-ROC) values for each docking program with its native scoring function and the five Cscore functions are given in Table 3, and are color coded according to performance; green - excellent (above 0.9), black – moderately well (0.9 to 0.6), red – poor (less than 0.6). Calculated p values are shown in parentheses in Table 3. At a significance level (α) of 0.05, p values less than 0.05 indicate significant improvement over random selection while p values greater than 0.05 indicate no significant difference over random selection. It should be noted that, when creating the ROC curves, we used the total number of compounds in the validation set rather than total number of docked compounds to enable a more direct comparison of the performance of the docking and scoring algorithms. This point has been discussed earlier with respect to enrichment values, but it is also relevant here. As can be seen from Figure 8, when calculating the area under the ROC for Glide using both the total Schrödinger decoy set versus the total successfully docked, there is a small but noticeable difference. This presents a problem when comparing results with a docking program such as Surflex that was able to dock the complete Schrödinger decoy set.
Figure 7.
Selected ROC Plots. A. Glide Docking of ZINC Decoy Set B. Surflex Docking of Schrodinger Decoy Set C. GOLD Docking of Schrodinger Decoy Set
Table 3.
Calculated AU-ROC with p values from ROC Curves for 5 Docking Programs, Native Score and Cscore (unrelaxed) Functions.
| Docking Program / Validation Set |
Native Scorea | F-Score | PMF-Score | G-Score | D-Score | ChemScore |
|---|---|---|---|---|---|---|
| DOCK - ZINC | 0.835 (<.001) | 0.804 (.001) | 0.962 (<.001) | 0.533 (.338) | 0.721 (.007) | 0.540 (.297) |
| DOCK - Schrödinger | 0.770 (<.001) | 0.793 (.001) | 0.932 (<.001) | 0.584 (.110) | 0.689 (.008) | 0.538 (.271) |
| DOCK - ACD | 0.902 (<.001) | 0.860 (<.001) | 0.958 (<.001) | 0.652 (.021) | 0.794 (<.001) | 0.633 (.010) |
| FlexX - ZINC | see F-Scoreb | 0.813 (<.001) | 0.932 (<.001) | 0.394 (.854) | 0.588 (.183) | 0.317 (.998) |
| FlexX - Schrödinger | see F-Scoreb | 0.746 (<.001) | 0.889 (<.001) | 0.386 (.887) | 0.528 (.376) | 0.289 ( .999) |
| FlexX - ACD | see F-Scoreb | 0.891 (<.001) | 0.915 (<.001) | 0.491 (.534) | 0.701 (.006) | 0.506 (.461) |
| Glide - ZINC | 0.971 (<.001) | 0.941 (<.001) | 0.939 (<.001) | 0.558 (.182) | 0.666 (.039) | 0.547 (.267) |
| Glide - Schrödinger | 0.982 (<.001) | 0.947 (<.001) | 0.889 (<.001) | 0.709 (<.001) | 0.654 (.004) | 0.651 (.010) |
| Glide - ACD | 0.977 (<001) | 0.975 (<.001) | 0.936 (<.001) | 0.588 (.029) | 0.738 (<.001) | 0.728 (<.001) |
| Surflex - ZINC | 0.985 (<.001) | 0.980 (<.001) | 0.956 (<.001) | 0.189 (>.999) | 0.436 (.755) | 0.506 (.472) |
| Surflex - Schrödinger | 0.978 (<.001) | 0.963 (<.001) | 0.880 (<.001) | 0.117 (>.999) | 0.251 (.999) | 0.360 (.966) |
| Surflex - ACD | 0.975 (<.001) | 0.975 (<.001) | 0.926 (<.001) | 0.221 (>.999) | 0.467 (.661) | 0.508 (.448) |
| GOLD - ZINC | 0.763 (.002) | 0.923 (<.001) | 0.930 (<.001) | 0.398 (.883) | 0.401 (.862) | 0.237 (>.999) |
| GOLD - Schrödinger | 0.778 (<.001) | 0.846 (<.001) | 0.827 (<.001) | 0.345 (.993) | 0.197 (>.999) | 0.185 (>.999) |
p values <.05 for AU-ROC values >.5 indicate statistically significant improvement over random selection, p values <.05 for AU-ROC values <.5 indicate statistically significant decrement over random selection.
F-Score is the native scoring function for the FlexX docking program.
Figure 8.
ROC Comparison of Docked Versus Total Set, Schrodinger Decoy Set
Four observations can be made from these results. First, unlike the enrichment results at 1% and 2%, there is little difference in the ROC results for docking programs when compared across decoy sets. Generally, when a docking/scoring combination performed well, it did so against all three decoy sets. The opposite is also true, with poorly performing docking/scoring combinations consistent with all three decoy sets. One exception to this is the noticeable (although not statistically significant) decrease in performance of PMF-Score when rescoring docking output for the Schrödinger decoy set. We also noted the improvement in performance of the D-Score function when rescoring DOCK output and attribute this to the fact that the D-Score function is based on the original DOCK scoring function by Kuntz, et al.44 Second, docking programs generally performed moderately to very well when paired with their own native scoring functions. Glide with Glide-Score and Surflex with Surflex-Score performed exceptionally well, and no improvement to the AU-ROC values was seen when rescoring these poses. DOCK, FlexX, and GOLD performed moderately well when scored with their native scoring functions, Grid-Score, F-Score, and GOLD-Score, respectively, but these showed significant improvement upon rescoring. Specifically, AU-ROC values were markedly improved when DOCK results were rescored with PMF-Score, FlexX results with PMF-Score, and GOLD results with both F-Score and PMF-Score. Third, F-Score and PMF-Score generally performed well in rescoring. Curiously, F-score only performed moderately well with its partner FlexX, but performed exceptionally well when used to re-score the outputs of Glide, Surflex, and GOLD. Finally, we note the moderate to poor performance of G-Score, D-Score, and ChemScore when these functions were used to re-score docking output from all five docking programs. Their performance ranged from moderate with DOCK and Glide, to exceptionally poor with Surflex and GOLD.
SSLR Calculations
The SSLR value reflects the ability of the docking and scoring combination to detect active compounds early and also their ability to correctly rank the active compounds according to their known inhibition constants. Table 4 shows the calculated SSLR statistic and p values for each of the docking/scoring combinations evaluated in this study. Lower values for SSLR are more desirable, and p values (shown in parentheses) of less than 0.05 indicate that the particular combination showed significant improvement over random selection and ordering. Like the AU-ROC values, the SSLR values demonstrate a clear distinction between the performance of the native scoring functions, F-Score, and PMF-Score over G-Score, D-Score, and ChemScore. As was seen with the AU-ROC calculations, the latter three scoring functions performed very poorly when rescoring the poses from all five docking programs, while the former three functions generally performed well across the board. We note that in three instances, D-Score was able to detect and rank the active compounds significantly better than random, as demonstrated by the p values for DOCK docking of the ZINC and ACD decoy sets and FlexX docking of the ACD decoy set. These results follow very closely with the corresponding AU-ROC values. In all cases the native scoring functions were able to detect and rank the actives significantly better than random selection and ordering. Finally, when used to rescore docked poses, PMF-Score and F-Score each performed exceptionally well, matching their performance when gauged with the AU-ROC values.
Table 4.
Calculated SSLR Statistics with p values (in parentheses) for 5 Docking Programs, Native Score and Cscore (unrelaxed) Functions.
| Docking Program / Validation Set |
Native Scorea | F-Score | PMF-Score | G-Score | D-Score | ChemScore |
|---|---|---|---|---|---|---|
| DOCK - ZINC | 212.3 (<.001) | 164.1 (<.001) | 145.8 (<.001) | 312.2 (.220) | 265.6 (.006) | 313.7 (.241) |
| DOCK - Schrödinger | 269.9 (.009) | 211.9 (<.001) | 201.7 (<.001) | 309.4 (.186) | 292.9 (.061) | 322.2 (.382) |
| DOCK - ACD | 183.2 (<.001) | 134.5 (<.001) | 182.6 (<.001) | 281.8 (.025) | 251.2 (.002) | 301.4 (.111) |
| FlexX - ZINC | see F-Scoreb | 244.1 (.001) | 151.3 (<.001) | 331.2 (.568) | 298.0 (.088) | 354.1 (.960) |
| FlexX - Schrödinger | see F-Scoreb | 270.3 (.009) | 204.5 (<.001) | 335.4 (.661) | 316.9 (.290) | 357.6 (.982) |
| FlexX - ACD | see F-Scoreb | 213.7 (<.001) | 190.3 (<.001) | 306.9 (.160) | 273.3 (.012) | 326.7 (.470) |
| Glide - ZINC | 131.4 (<.001) | 152.3 (<.001) | 148.6 (<.001) | 312.1 (.220) | 297.3 (.084) | 305.2 (.143) |
| Glide - Schrödinger | 125.9 (<.001) | 166.7 (<.001) | 192.7 (<.001) | 300.3 (.103) | 310.2 (.196) | 305.5 (.145) |
| Glide - ACD | 141.1 (<.001) | 141.3 (<.001) | 188.0 (<.001) | 312.0 (.219) | 279.2 (.021) | 279.5 (.021) |
| Surflex - ZINC | 112.1 (<.001) | 121.1 (<.001) | 140.0 (<.001) | 360.9 (.993) | 342.9 (.813) | 324.1 (.417) |
| Surflex - Schrödinger | 116.4 (<.001) | 134.4 (<.001) | 205.0 (<.001) | 370.0 (.999) | 363.2 (.997) | 346.7 (.878) |
| Surflex - ACD | 123.1 (<.001) | 132.9 (<.001) | 211.3 (<.001) | 353.5 (.956) | 333.0 (.607) | 325.4 (.443) |
| GOLD - ZINC | 259.6 (.004) | 169.5 (<.001) | 153.4 (<.001) | 349.6 (.916) | 344.5 (.842) | 358.6 (.986) |
| GOLD - Schrödinger | 254.6 (.002) | 203.0 (<.001) | 227.7 (<.001) | 352.3 (.945) | 365.2 (.999) | 360.1 (.991) |
SSLR statistics with p values <.05 are considered to have significant improvement over random selection and ordering.
F-Score is the native scoring function for the FlexX docking program.
In order to compare scoring functions to each other within docking program/decoy set pairs, p values were calculated to detect statistically significant differences in scoring function performance. Tables 5 through 7 show p value cross comparisons both for AU-ROC's and SSLR values for each of the three representative pairs mentioned above. These results are helpful in determining which, if any, of the top performing scoring functions significantly outperformed the other, or if there was no statistically significant difference. For example, in Table 5 the results indicate that between Glide Score, F-Score, and PMF-Score, there was no significant difference in their performance when judged by either AU-ROC or SSLR. Additionally, there is not a significant difference in the performance of D-Score, G-Score, and ChemScore when judged by either metric. In contrast, the data shown in Table 6 indicate that for Surflex docking of the Schrödinger decoy set, there was a significant difference between the performance of Surflex Score and PMF-Score that was detected by both metrics, with Surflex scoring significantly outperforming PMF-scoring. Additionally, it can be seen from Table 6 that a significant difference between PMF- and F-Score could not be detected from the AU-ROC values, but that a difference was detectable when comparing the two scoring functions with SSLR values. The ability of the SSLR value to detect a difference in performance of two scoring functions that was not detected by AU-ROC is also demonstrated in Table 7 when comparing PMF-Score and GOLD-Score, with GOLD-Score showing clear superiority over PMF-Score when judged by SSLR values. There are also instances where SSLR failed to detect a significant difference that was detectable by the AU-ROC method, as can be seen from the ChemScore/G-Score results in Table 7.
Table 5.
Glide Docking of the ZINC Decoy Set. Comparison of p values for AU-ROC's (yellow) and SSLR statistics (green) for each scoring function.
| Docking Program / Validation Set |
Glide Score |
F-Score | PMF- Score |
G-Score | D-Score | ChemScore |
|---|---|---|---|---|---|---|
| Glide Score | --- | .364 | .377 | <.001 | .001 | <.001 |
| F-Score | .674 | --- | .959 | <.001 | .006 | <.001 |
| PMF-Score | .717 | .957 | --- | <.001 | <.001 | <001 |
| G-Score | <.001 | <.001 | <.001 | --- | .281 | .712 |
| D-Score | <.001 | .011 | <.001 | .496 | --- | .212 |
| ChemScore | <.001 | <.001 | <.001 | .454 | .743 | --- |
Table 7.
GOLD Docking of the Schrödinger Decoy Set. Comparison of p values for AU-ROC's (yellow) and SSLR statistics (green) for each scoring function.
| Docking Program / Validation Set |
GOLD Score |
F-Score | PMF- Score |
G-Score | D-Score | ChemScore |
|---|---|---|---|---|---|---|
| GOLD Score | --- | .373 | .297 | <.001 | <.001 | <.001 |
| F-Score | .112 | --- | .780 | <.001 | <.001 | <.001 |
| PMF-Score | .036 | .501 | --- | <.001 | <.001 | <.001 |
| G-Score | <.001 | .003 | <.001 | --- | .001 | .009 |
| D-Score | <.001 | .001 | <.001 | .038 | --- | .829 |
| ChemScore | <.001 | <.001 | <.001 | .251 | .916 | --- |
Table 6.
Surflex Docking of the Schrödinger Decoy Set. Comparison of p values for AU-ROC's (yellow) and SSLR statistics (green) for each scoring function.
| Docking Program / Validation Set |
Surflex Score |
F-Score | PMF- Score |
G-Score | D-Score | ChemScore |
|---|---|---|---|---|---|---|
| Surflex Score | --- | .267 | .018 | <.001 | <.001 | <.001 |
| F-Score | .319 | --- | .059 | <.001 | <.001 | <.001 |
| PMF-Score | <.001 | .003 | --- | <.001 | <.001 | <.001 |
| G-Score | <.001 | <.001 | <.001 | --- | .035 | <.001 |
| D-Score | <.001 | <.001 | <.001 | .042 | --- | .084 |
| ChemScore | <.001 | <.001 | <.001 | <.001 | .215 | --- |
The results of a direct comparison of the native scoring functions to each other for each decoy set studied are given in Tables 8 through 10. It can be seen from the p values that Glide with its native Glide-Score and Surflex with its native Surflex-Score demonstrated a significant superiority over FlexX, GOLD, and DOCK with their own respective native scoring functions. Additionally, a direct comparison of Glide-Score and Surflex-Score shows that there is no significant difference between the results of the two scoring functions, both in terms of the AU-ROC and SSLR methods.
Table 8.
Cscore AU-ROC Results for Docking of ZINC Decoy Set
| Docking Program / Validation Set |
Unrelaxed | Relaxed |
|---|---|---|
| DOCK | .730 | .734 |
| FlexX | .722 | .679 |
| Glide | .891 | .857 |
| GOLD | .716 | .658 |
| Surflex | .622 | .554 |
Table 10.
Native Scoring Functions with the Schrödinger Decoy Set. Comparison of p values for AU-ROC's (yellow) and SSLR statistics (green) for each scoring function.
| Docking Program / Validation Set |
Grid Score | F-Score | Glide Score | Surflex Score |
GOLD Score |
|---|---|---|---|---|---|
| Grid Score | --- | .808 | .004 | .004 | .871 |
| F-Score | .988 | --- | .001 | .001 | .689 |
| Glide Score | <.001 | <.001 | --- | .703 | .003 |
| Surflex Score | .003 | .002 | .829 | --- | .001 |
| GOLD Score | .603 | .714 | <.001 | <.001 | --- |
Post-Docking Relaxation
Several authors have recommended that, when rescoring poses with non-native scoring functions as reported here, the poses should first be optimized using the native scoring function before generating the score.11, 25 This procedure was not applied to the enrichment and AU-ROC data reported above, and it may explain the poor results observed with the D-Score, G-Score, and ChemScore algorithms. To investigate the effects of optimizing the ligand poses prior to rescoring, we applied the molecule relaxation function of Cscore to the docking output prior to rescoring with the five Cscore scoring functions. This relaxation function uses the Tripos Force Field to perform a 100 iteration torsional minimization of the docked ligand. Figure 9 shows the effects of this relaxation procedure on the rescored AU-ROC values for the poses generated by Surflex docking of the ZINC decoy set. There was little change in the calculated AU-ROC values for D-Score, some improvement for G-Score, and significantly decreased AU-ROC values for the F-Score, ChemScore, and PMF-Score functions. Similar results were obtained for all the docking programs and decoy sets investigated in this study (data not shown).
Figure 9.
Effect of molecule relaxation of docking output prior to rescoring with Cscore functions. Surflex Docking of ZINC Validation Set is shown below A. Unrelaxed, B. Relaxed.
Consensus Scoring
Consensus scoring has received mixed reviews in recent validation studies, with some authors reporting enhanced enrichment over single scoring functions55-57 and others reporting little to no improvement.12, 19 To further investigate this in the DHPS system, we used the Cscore module of Sybyl 7.3 to generate consensus scores from the five Cscore functions. We used the default settings, and investigated consensus score values generated from both unrelaxed and relaxed scores. A score of 0 through 5 is generated for each ligand pose depending on the number of “good” scores received from each of the five C-score functions. Table 11 gives the results of consensus scoring on enrichment (by calculated AU-ROC) for each of the five docking programs. Only the data from the ZINC decoy set are shown in the table, but the results were similar for the other two decoy sets. Table 11 gives the results from the unrelaxed and relaxed poses for comparison. Ideally, the majority of the known active compounds should give a high Cscore value of 4 or 5, while the majority of the decoy compounds should have low Cscore values. However, consensus scoring resulted in only a modest enrichment, and it failed to significantly improve the enrichment results obtained when scoring with single scoring functions. We saw no significant difference in the results when Cscore calculations were performed on the unrelaxed poses over the relaxed poses. The best results (an AU-ROC value of 0.891) were seen with consensus scores generated from unrelaxed poses from the Glide docking.
Table 11.
Native Scoring Functions with the ACD (Bissantz) Decoy Set. Comparison of p values for AU-ROC's (yellow) and SSLR statistics (green) for each scoring function.
| Docking Program / Validation Set |
Grid Score | F-Score | Glide Score | Surflex Score |
|---|---|---|---|---|
| Grid Score | --- | .866 | .146 | .120 |
| F-Score | .277 | --- | .043 | .048 |
| Glide Score | .317 | .080 | --- | .888 |
| Surflex Score | .160 | .017 | .707 | --- |
DISCUSSION
Our high resolution crystallographic studies of DHPS from Bacillus anthracis that includes substrate and inhibitor complexes have provided us with the opportunity of using virtual screening methods to identify novel inhibitory compounds that specifically dock into the well characterized binding determinants of the pterin pocket. However, an acknowledged limitation of this method is the ability to accurately score and rank the hits to identify which compounds should be further pursued by in-depth biochemical, kinetic and structural studies. We have therefore performed a thorough investigation of docking and scoring methodologies to identify which combination would be expected to yield the best results when applied to this particular pocket in this particular enzyme. As described in the introduction, we sought answers to eight specific questions and have successfully provided key insights into each of them.
We first investigated pose selection and noted the overall good performance of all five docking programs. Each program was able to generate a successful pose (RMSD less than 1.5 Å), and four of the five native scoring functions were able to rank a successful pose the highest. Additionally, when the poses were rescored with the five Cscore scoring functions, each one performed reasonably well. The majority of the docking and scoring functions were able to generate and rank successful poses, and we therefore conclude that this method of evaluating docking/scoring combinations is useful for eliminating poorly performing combinations but not for selecting the optimal combination.
We then addressed the question of how two commonly-used metrics, enrichment calculations at a given percent of decoy set screened (1% and 2%) and areas under receiver-operating characteristic curves (AU-ROC), compare when used for validation. Although both metrics were generated using the same data, it was easier to note a difference in performance when analyzing the enrichment values. Using the AU-ROCs, we classified combinations as performing either well, moderately well, or poor, but within each classification, it was difficult to determine the best docking/scoring combination. Similar to the pose selection study, the AU- ROCs were most useful for eliminating poorly performing docking/scoring combinations rather than selecting the top performing combination. In contrast, the enrichment calculations which reward early detection of active compounds appear to be more successful in distinguishing the top performing docking/scoring combinations for use against a specific target, based on our results.
We next sought to answer the question of how important is the selection of decoy compounds for use in enrichment studies. A recent study stressed the importance of selecting decoy set compounds that closely match the active compounds in terms of physico-chemical properties in order to avoid artificial enrichment.58 We selected three decoy sets that had previously been used to validate docking programs against a wide variety of enzyme targets. Each of the three decoy sets has slightly different characteristics, and differs in physico-chemical properties from the active compounds to varying degrees. We compared the enrichment and AU-ROC results across decoy sets, and although there were detectable differences when comparing enrichment calculations at 1 and 2%, we were unable to correlate this trend with the degree of difference in physico-chemical properties of the active compounds from the decoy sets. Significantly for our purposes, when comparing the AU-ROC calculations across decoy sets, we did not detect a significant trend either favoring or disfavoring one decoy set over another, and when a docking/scoring combination performed well, it generally did so against all three decoy sets and vice versa. However, our results are not necessarily inconsistent with the previous study where a trend was observed.58 More likely, while our active compounds differed significantly in some physicochemical properties from the 3 decoy sets we selected, the decoy sets themselves did not differ enough between each other to make a clear distinction in performance. This can be seen in Table 12, which shows the average molecular volume (Vol), atom count (AC), cLogP, # of H-bond donors (HD), # of H-bond acceptors, and number of rotatable bonds (RB) for the active set and the three decoy sets. It can be seen that the active compounds tend to be smaller and more hydrophilic than the decoy compounds, but the decoy sets themselves are very similar.
Table 12.
Number of Compounds Docked by Validation Set
| Docking Tool |
ACD | Schrödinger | ZINC |
|---|---|---|---|
| Full Set | 871 | 1010 | 1010 |
| DOCK | 749 | 752 | 852 |
| FlexX | 811 | 991 | 1004 |
| Surflex | 870 | 1010 | 1010 |
| GOLD | n/d | 1010 | 991 |
| Glide | 579 | 607 | 819 |
The question of how to deal with docking failures was also specifically addressed because this issue has received little attention in previous studies. In our study, the docking programs were frequently unable to return poses for some decoy compounds, and this led to a problem in directly comparing the programs. For example, the program Glide in combination with the Schrödinger decoy set returned 607 successful poses while the Surflex program returned the full quota of 1010 poses (1000 decoys plus 10 actives). In the calculation of enrichment, we believe that it would have been an unfair penalty on programs that failed to dock decoy compounds had we selected % compounds docked rather than the % of the total number of compounds, and similarly in the calculation of AU-ROC and SSLR. We therefore used the total number of compounds (decoy + active) to calculate enrichment at 1 and 2%, and assigned the worst reported score to all docking failures when calculating the ROC plots, AU-ROC's, and SSLR values. We recognize that this method may over-compensate because the failure of a program to dock an inactive compound may actually reflect superior performance. Thus, in the event that the performance of two docking/scoring combinations are indistinguishable, we believe it is reasonable to use the number of docking failures for inactive compounds as a means for selecting one over the other.
We next addressed the abilities of post-docking relaxation and consensus scoring to improve enrichment results by evaluating their effects on our AU-ROC metrics. Cole and co-workers have stressed the importance of using scoring functions to optimize docking output prior to rescoring with that function25 and we attributed the poor performance of the D-Score, G-Score, and ChemScore functions to this deficiency in our analyses. To test this, we performed molecule relaxation using a function that is available in the C-Score module of Sybyl (Tripos) prior to rescoring, and compared these results with the unrelaxed scores. The scoring results following relaxation were typically worse in terms of AU-ROC, and this may be due to the function's use of the Tripos Force Field rather than the scoring functions themselves. This is consistent with the findings of Cole and coworkers because the notable exception was the improved performance of G-Score that actually uses the Tripos Force Field parameters. Consensus scoring failed to improve upon the results we were able to obtain with single function scoring, and we believe that this can also be attributed the fact that the Cscore functions were not optimized with respect to the functions themselves. We conclude that, when rescoring with non-native scoring functions, it is very important to optimize with respect to that scoring function.
The known inhibitory constants of the active compounds seeded into the decoy sets represents important information that can be used to further evaluate the performance of docking and scoring combinations. Thus, ideally, the active compounds should not only be identified early but also in the correct order according to inhibition constants. In this study we have introduced a new method for interpreting enrichment study results that simultaneously rewards early detection of active compounds and correct ordering, the ‘sum of the sum of log rank’ or SSLR. Although several methods have been reported that specifically reward early detection31, 59, 60, we believe that this is the first method that takes this approach. The SSLR method was developed to help us distinguish between the top performing docking and scoring combinations that were statistically indistinguishable using traditional AU-ROC methods. In the three representative examples given above, the SSLR method was able to distinguish between scoring functions in two cases where the differences in AU-ROC were not significant but, in general, the SSLR values closely correlated to the AU-ROC results in terms of statistical significance. However, it is very straightforward to apply the SSLR method when relevant data are available, and we consider this a valuable method with potentially great utility for future virtual screening studies.
The ultimate goal of this study was to determine which of the docking and scoring combinations evaluated would be expected to yield the best results in terms of enrichment when used against the pterin binding site of DHPS in a large scale, virtual screening study. We noted the excellent performance of the native scoring functions when used with each of their respective docking programs in our enrichment studies. We also noted the poor performance of the Cscore scoring functions when used to rescore docking output, and explained this by our inability to optimize the poses with respect to the scoring functions themselves. While this may explain the poor performance of G-Score, D-Score, and ChemScore, it does not explain the good to excellent performance of F-Score and PMF-Score. We believe that the nature of the pterin binding site may in part explain this observed phenomenon. Ligand binding into the pterin binding site not only involves van der Waals packing interactions within the tight pocket but also polar hydrogen bonding and ionic interactions.5 Additionally, as can be seen from Figure 4, there is a clear preference for planar, aromatic compounds that can accommodate π-stacking with the side chain of Arg254. Our results are consistent with those of Bissantz and co-workers who found that FlexX scores and PMF scores performed better against polar active sites, while DOCK scores were more reliable against non-polar active sites.24 There is also an explicit aromatic stacking term used in F-Score, unique to this scoring function, which may have also contributed to its good performance.
CONCLUSIONS
In order to select the best performing docking/scoring combination for virtual screening studies against the DHPS pterin binding site, we employed several validation methods. Pose selection studies using a co-crystal structure with a known pterin-site inhibitor bound were useful in identifying docking/scoring combinations that performed poorly but were less helpful in selecting a top performing combination. Similarly, the AU-ROC values were also less helpful at selecting a specific top-performing docking/scoring combination, but clearly identified poorly performing combinations. However, enrichment calculations at 1 and 2% percent of the decoy set screened proved very useful in identifying two top performing docking/scoring combinations, Glide with Glide Score and Surflex with Surflex Score. Finally, we have developed a new metric that can be used as a validation method that we term SSLR. The SSLR statistic not only takes into account early detection of active compounds from decoy sets, but also rewards for correctly ordering the active compounds by their known inhibitory constants. We found that the results of the SSLR tests closely matched the AU-ROC results and in several cases were able to help us distinguish between docking/scoring combinations for which there was not a statistically significant difference using the latter method.
We investigated three separate decoy sets and found a dependence on the decoy set used when calculating enrichment at 1% and 2%, with the ZINC decoy set yielding the highest enrichment values. This dependence was not seen when comparing AU-ROC's from ROC plots, which were generally comparable across validation sets. Our investigations also showed that relaxation of the poses prior to rescoring with the Cscore functions using the relaxation function of the Cscore module implemented in Sybyl 7.3 did not overall improve enrichment and in some cases was actually detrimental. We believe this is due to the fact that the Cscore relaxation function does not use the scoring function to minimize the poses, but instead uses a different force field. No improvement over the best results seen with single scoring functions was observed when applying consensus scoring, with either the relaxed or non-relaxed poses. Again, we postulate that this is due to the fact that the Consensus scoring functions were not optimized with respect to each function prior to scoring.
We demonstrate considerable variability when using these various validation methods and identify clear winners. Indeed, without these analyses, it would be virtually impossible to successfully use virtual screening in our studies. Based upon the results from the enrichment studies, AU-ROC and SSLR calculations, we found that, of the docking programs and scoring functions we evaluated, the most appropriate combination for use in high-throughput virtual screening against DHPS would be Glide with the native Glide Score function or Surflex with the native Surflex Score function.
Supplementary Material
Table 9.
Native Scoring Functions with the ZINC Decoy Set. Comparison of p values for AU-ROC's (yellow) and SSLR statistics (green) for each scoring function.
| Docking Program / Validation Set |
Grid Score | F-Score | Glide Score |
Surflex Score |
GOLD Score |
|---|---|---|---|---|---|
| Grid Score | --- | .822 | .078 | .042 | .015 |
| F-Score | .306 | --- | .019 | .007 | .659 |
| Glide Score | .085 | .030 | --- | .503 | .031 |
| Surflex Score | .050 | .002 | .676 | --- | .013 |
| GOLD Score | .236 | .647 | .018 | <.001 | --- |
ACKNOWLEDGMENTS
The authors would like to thank National Institutes of Health grants AI060953 & AI070721 and ALSAC for financial support, Dr. John Buolamwini for use and help with the GOLD docking program and Schrödinger, Inc. for providing trial licenses for the use of the Glide docking program in this study. We acknowledge the assistance of Dr. Iain Kerr in this study. Support of this research by the American Foundation for Pharmaceutical Education is also gratefully acknowledged.
Footnotes
Supporting Information Available: ROC graphs for the remaining docking programs and decoy sets (Figures 1S to 11S) and their corresponding p-value tables for AU-ROC and SSLR values (Tables 1S to 11S). Enrichment at 2% for the three decoy sets investigated (Figues 12S to 14S). This material is available freely of charge via the Internet at http://pubs.acs.org.
REFERENCES AND NOTES
- 1.Skold O. Sulfonamide resistance: mechanisms and trends. Drug Resist. Updat. 2000;3:155–160. doi: 10.1054/drup.2000.0146. [DOI] [PubMed] [Google Scholar]
- 2.Achari A, Somers DO, Champness JN, Bryant PK, Rosemond J, Stammers DK. Crystal structure of the anti-bacterial sulfonamide drug target dihydropteroate synthase. Nat. Struct. Biol. 1997;4:490–497. doi: 10.1038/nsb0697-490. [DOI] [PubMed] [Google Scholar]
- 3.Hampele IC, D'Arcy A, Dale GE, Kostrewa D, Nielsen J, Oefner C, Page MG, Schonfeld HJ, Stuber D, Then RL. Structure and function of the dihydropteroate synthase from Staphylococcus aureus. J. Mol. Biol. 1997;268:21–30. doi: 10.1006/jmbi.1997.0944. [DOI] [PubMed] [Google Scholar]
- 4.Baca AM, Sirawaraporn R, Turley S, Sirawaraporn W, Hol WG. Crystal structure of Mycobacterium tuberculosis 7,8-dihydropteroate synthase in complex with pterin monophosphate: new insight into the enzymatic mechanism and sulfa-drug action. J. Mol. Biol. 2000;302:1193–1212. doi: 10.1006/jmbi.2000.4094. [DOI] [PubMed] [Google Scholar]
- 5.Babaoglu K, Qi J, Lee RE, White SW. Crystal structure of 7,8-dihydropteroate synthase from Bacillus anthracis: mechanism and novel inhibitor design. Structure. 2004;12:1705–1717. doi: 10.1016/j.str.2004.07.011. [DOI] [PubMed] [Google Scholar]
- 6.Lawrence MC, Iliades P, Fernley RT, Berglez J, Pilling PA, Macreadie IG. The three-dimensional structure of the bifunctional 6-hydroxymethyl-7,8-dihydropterin pyrophosphokinase/dihydropteroate synthase of Saccharomyces cerevisiae. J. Mol. Biol. 2005;348:655–670. doi: 10.1016/j.jmb.2005.03.021. [DOI] [PubMed] [Google Scholar]
- 7.Bagautdinov B, Kunishima N. Crystal Structure of Dihydropteroate Synthase (FolP) from Thermus thermophilus HB8. RCSB Protein Data Bank. www.pdb.org (accessed March 7th, 2008)
- 8.Levy C, Minnis D, Derrick JP. Dihydropteroate synthase from Streptococcus pneumoniae: structure, ligand recognition and mechanism of sulfonamide resistance. Biochem. J. 2008;412:379–388. doi: 10.1042/BJ20071598. [DOI] [PubMed] [Google Scholar]
- 9.Doman TN, McGovern SL, Witherbee BJ, Kasten TP, Kurumbail R, Stallings WC, Connolly DT, Shoichet BK. Molecular docking and high-throughput screening for novel inhibitors of protein tyrosine phosphatase-1B. J. Med. Chem. 2002;45:2213–2221. doi: 10.1021/jm010548w. [DOI] [PubMed] [Google Scholar]
- 10.Onodera K, Satou K, Hirota H. Evaluations of molecular docking programs for virtual screening. J. Chem. Inf. Model. 2007;47:1609–1618. doi: 10.1021/ci7000378. [DOI] [PubMed] [Google Scholar]
- 11.Chen H, Lyne PD, Giordanetto F, Lovell T, Li J. On evaluating molecular-docking methods for pose prediction and enrichment factors. J. Chem. Inf. Model. 2006;46:401–415. doi: 10.1021/ci0503255. [DOI] [PubMed] [Google Scholar]
- 12.Cummings MD, DesJarlais RL, Gibbs AC, Mohan V, Jaeger EP. Comparison of automated docking programs as virtual screening tools. J. Med. Chem. 2005;48:962–976. doi: 10.1021/jm049798d. [DOI] [PubMed] [Google Scholar]
- 13.Warren GL, Andrews CW, Capelli AM, Clarke B, LaLonde J, Lambert MH, Lindvall M, Nevins N, Semus SF, Senger S, Tedesco G, Wall ID, Woolven JM, Peishoff CE, Head MS. A critical assessment of docking programs and scoring functions. J. Med. Chem. 2006;49:5912–5931. doi: 10.1021/jm050362n. [DOI] [PubMed] [Google Scholar]
- 14.Erickson JA, Jalaie M, Robertson DH, Lewis RA, Vieth M. Lessons in molecular recognition: the effects of ligand and protein flexibility on molecular docking accuracy. J. Med. Chem. 2004;47:45–55. doi: 10.1021/jm030209y. [DOI] [PubMed] [Google Scholar]
- 15.Kontoyianni M, McClellan LM, Sokol GS. Evaluation of docking performance: comparative data on docking algorithms. J. Med. Chem. 2004;47:558–565. doi: 10.1021/jm0302997. [DOI] [PubMed] [Google Scholar]
- 16.Kontoyianni M, Sokol GS, McClellan LM. Evaluation of library ranking efficacy in virtual screening. J. Comput. Chem. 2005;26:11–22. doi: 10.1002/jcc.20141. [DOI] [PubMed] [Google Scholar]
- 17.Kellenberger E, Rodrigo J, Muller P, Rognan D. Comparative evaluation of eight docking tools for docking and virtual screening accuracy. Proteins. 2004;57:225–242. doi: 10.1002/prot.20149. [DOI] [PubMed] [Google Scholar]
- 18.Perola E, Walters WP, Charifson PS. A detailed comparison of current docking and scoring methods on systems of pharmaceutical relevance. Proteins. 2004;56:235–249. doi: 10.1002/prot.20088. [DOI] [PubMed] [Google Scholar]
- 19.Xing L, Hodgkin E, Liu Q, Sedlock D. Evaluation and application of multiple scoring functions for a virtual screening experiment. J. Comput.-Aided Mol. Des. 2004;18:333–344. doi: 10.1023/b:jcam.0000047812.39758.ab. [DOI] [PubMed] [Google Scholar]
- 20.Schulz-Gasch T, Stahl M. Binding site characteristics in structure-based virtual screening: evaluation of current docking tools. J. Mol. Model. 2003;9:47–57. doi: 10.1007/s00894-002-0112-y. [DOI] [PubMed] [Google Scholar]
- 21.Bursulaya BD, Totrov M, Abagyan R, Brooks CL., 3rd. Comparative study of several algorithms for flexible ligand docking. J. Comput.-Aided Mol. Des. 2003;17:755–763. doi: 10.1023/b:jcam.0000017496.76572.6f. [DOI] [PubMed] [Google Scholar]
- 22.Wang R, Lu Y, Wang S. Comparative evaluation of 11 scoring functions for molecular docking. J. Med. Chem. 2003;46:2287–2303. doi: 10.1021/jm0203783. [DOI] [PubMed] [Google Scholar]
- 23.Stahl M, Rarey M. Detailed analysis of scoring functions for virtual screening. J. Med. Chem. 2001;44:1035–1042. doi: 10.1021/jm0003992. [DOI] [PubMed] [Google Scholar]
- 24.Bissantz C, Folkers G, Rognan D. Protein-based virtual screening of chemical databases. 1. Evaluation of different docking/scoring combinations. J. Med. Chem. 2000;43:4759–4767. doi: 10.1021/jm001044l. [DOI] [PubMed] [Google Scholar]
- 25.Cole JC, Murray CW, Nissink JW, Taylor RD, Taylor R. Comparing protein-ligand docking programs is difficult. Proteins. 2005;60:325–332. doi: 10.1002/prot.20497. [DOI] [PubMed] [Google Scholar]
- 26.Jain AN. Bias, reporting, and sharing: computational evaluations of docking methods. J. Comput.-Aided Mol. Des. 2008;22:201–212. doi: 10.1007/s10822-007-9151-x. [DOI] [PubMed] [Google Scholar]
- 27.Neyman J, Pearson ES. On the problem of the most efficient tests of statistical hypotheses. Philos. Trans. R. Soc, London, Ser. A. 1933;231:289–337. [Google Scholar]
- 28.Neyman J, Pearson ES. The testing of statistical hypotheses in relation to probabilities a priori. Proc. Cambridge Philos. Soc. 1933;20:492–510. [Google Scholar]
- 29.Swets JA, Dawes RM, Monahan J. Better decisions through science. Sci. Am. 2000;283:82–87. doi: 10.1038/scientificamerican1000-82. [DOI] [PubMed] [Google Scholar]
- 30.Triballeau N, Acher F, Brabet I, Pin JP, Bertrand HO. Virtual screening workflow development guided by the “receiver operating characteristic” curve approach. Application to high-throughput docking on metabotropic glutamate receptor subtype 4. J. Med. Chem. 2005;48:2534–2547. doi: 10.1021/jm049092j. [DOI] [PubMed] [Google Scholar]
- 31.Truchon JF, Bayly CI. Evaluating virtual screening methods: good and bad metrics for the “early recognition” problem. J. Chem. Inf. Model. 2007;47:488–508. doi: 10.1021/ci600426e. [DOI] [PubMed] [Google Scholar]
- 32.Morrison RW, Styles VL. Pyrimido[4,5-c]pyridazines. 5. Summary of cyclizations with vicinally functionalized reagents and studies of the reductive behavior of the ring system. J. Org. Chem. 1982;47:674–680. [Google Scholar]
- 33.Mallory WR, Morrison RW, Styles VL. Pyrimido[4,5-c]pyridazines. 3. Preferential formation of 8-amino-1H-pyrimido[4,5-c]-1,2-diazepin-6(7H)-ones by cyclizations with alpha,gamma-diketo esters. J. Org. Chem. 1982;47:667–674. [Google Scholar]
- 34.Lever OW, Jr., Bell LN, McGuire HM, Ferone R. Monocyclic pteridine analogues. Inhibition of Escherichia coli dihydropteroate synthase by 6-amino-5-nitrosoisocytosines. J. Med. Chem. 1985;28:1870–1874. doi: 10.1021/jm00150a019. [DOI] [PubMed] [Google Scholar]
- 35.Lever OW, Jr., Bell LN, Hyman C, McGuire HM, Ferone R. Inhibitors of dihydropteroate synthase: substituent effects in the side-chain aromatic ring of 6-[[3-(aryloxy)propyl]amino]-5-nitrosoisocytosines and synthesis and inhibitory potency of bridged 5-nitrosoisocytosine-p-aminobenzoic acid analogues. J. Med. Chem. 1986;29:665–670. doi: 10.1021/jm00155a014. [DOI] [PubMed] [Google Scholar]
- 36.Rarey M, Kramer B, Lengauer T, Klebe G. A fast flexible docking method using an incremental construction algorithm. J. Mol. Biol. 1996;261:470–489. doi: 10.1006/jmbi.1996.0477. [DOI] [PubMed] [Google Scholar]
- 37.Jain AN. Surflex: fully automatic flexible molecular docking using a molecular similarity-based search engine. J. Med. Chem. 2003;46:499–511. doi: 10.1021/jm020406h. [DOI] [PubMed] [Google Scholar]
- 38.SYBYL, version 7.3. Tripos International; St. Louis, MO: 2007. [Google Scholar]
- 39.Jones G, Willett P, Glen RC, Leach AR, Taylor R. Development and validation of a genetic algorithm for flexible docking. J. Mol. Biol. 1997;267:727–748. doi: 10.1006/jmbi.1996.0897. [DOI] [PubMed] [Google Scholar]
- 40.GOLD, version 3.1.1. Cambridge Crystallographic Data Centre; Cambridge, UK: 2007. [Google Scholar]
- 41.Friesner RA, Banks JL, Murphy RB, Halgren TA, Klicic JJ, Mainz DT, Repasky MP, Knoll EH, Shelley M, Perry JK, Shaw DE, Francis P, Shenkin PS. Glide: a new approach for rapid, accurate docking and scoring. 1. Method and assessment of docking accuracy. J. Med. Chem. 2004;47:1739–1749. doi: 10.1021/jm0306430. [DOI] [PubMed] [Google Scholar]
- 42.Halgren TA, Murphy RB, Friesner RA, Beard HS, Frye LL, Pollard WT, Banks JL. Glide: a new approach for rapid, accurate docking and scoring. 2. Enrichment factors in database screening. J. Med. Chem. 2004;47:1750–1759. doi: 10.1021/jm030644s. [DOI] [PubMed] [Google Scholar]
- 43.Glide, version 4.0. Schrodinger, Inc.; New York, NY: 2007. [Google Scholar]
- 44.Kuntz ID, Blaney JM, Oatley SJ, Langridge R, Ferrin TE. A geometric approach to macromolecule-ligand interactions. J. Mol. Biol. 1982;161:269–288. doi: 10.1016/0022-2836(82)90153-x. [DOI] [PubMed] [Google Scholar]
- 45.Ewing TJA, Kuntz ID. Critical evaluation of search algorithms for automated molecular docking and database screening. J. Comput. Chem. 1997;18:1175–1189. [Google Scholar]
- 46.Moustakas DT, Lang PT, Pegg S, Pettersen E, Kuntz ID, Brooijmans N, Rizzo RC. Development and validation of a modular, extensible docking program: DOCK 5. J. Comput.-Aided Mol. Des. 2006;20:601–619. doi: 10.1007/s10822-006-9060-4. [DOI] [PubMed] [Google Scholar]
- 47.Binder K. Topics in Applied Physics. Vol. 71. Springer; Berlin: 1993. The Monte Carlo method in condensed matter physics; pp. 1–392. [Google Scholar]
- 48.Welch W, Ruppert J, Jain AN. Hammerhead: fast, fully automated docking of flexible ligands to protein binding sites. Chem. Biol. 1996;3:449–462. doi: 10.1016/s1074-5521(96)90093-9. [DOI] [PubMed] [Google Scholar]
- 49.Baxter CA, Murray CW, Clark DE, Westhead DR, Eldridge MD. Flexible docking using Tabu search and an empirical estimate of binding affinity. Proteins. 1998;33:367–382. [PubMed] [Google Scholar]
- 50.Muegge I, Martin YC. A general and fast scoring function for protein-ligand interactions: a simplified potential approach. J. Med. Chem. 1999;42:791–804. doi: 10.1021/jm980536j. [DOI] [PubMed] [Google Scholar]
- 51.Pearlman RS. Rapid Generation of High Quality Approximate 3-dimension Molecular Structures. Chem. Des. Auto. News. 1987;2:1–7. [Google Scholar]
- 52.Gasteiger J, Marsili M. Iterative Partial Equalization of Orbital Electronegativity - A Rapid Access to Atomic Charges. Tetrahedron. 1980;36:3219–3228. [Google Scholar]
- 53.Press WH, Flannery BP, Teukolsky SA, Vetterling WT. Numerical Recipes in C, The Art of Scientific Computing. Cambridge University Press; Cambridge: 1988. Conjugate Gradients; p. 312. [Google Scholar]
- 54.Pham TA, Jain AN. Parameter estimation for scoring protein-ligand interactions using negative training data. J. Med. Chem. 2006;49:5856–5868. doi: 10.1021/jm050040j. [DOI] [PubMed] [Google Scholar]
- 55.Charifson PS, Corkery JJ, Murcko MA, Walters WP. Consensus scoring: A method for obtaining improved hit rates from docking databases of three-dimensional structures into proteins. J. Med. Chem. 1999;42:5100–5109. doi: 10.1021/jm990352k. [DOI] [PubMed] [Google Scholar]
- 56.Clark RD, Strizhev A, Leonard JM, Blake JF, Matthew JB. Consensus scoring for ligand/protein interactions. J. Mol. Graph. Model. 2002;20:281–295. doi: 10.1016/s1093-3263(01)00125-5. [DOI] [PubMed] [Google Scholar]
- 57.Wang R, Lai L, Wang S. Further development and validation of empirical scoring functions for structure-based binding affinity prediction. J. Comput.-Aided Mol. Des. 2002;16:11–26. doi: 10.1023/a:1016357811882. [DOI] [PubMed] [Google Scholar]
- 58.Verdonk ML, Berdini V, Hartshorn MJ, Mooij WT, Murray CW, Taylor RD, Watson P. Virtual screening using protein-ligand docking: avoiding artificial enrichment. J. Chem. Inf. Comput. Sci. 2004;44:793–806. doi: 10.1021/ci034289q. [DOI] [PubMed] [Google Scholar]
- 59.Sheridan RP, Singh SB, Fluder EM, Kearsley SK. Protocols for bridging the peptide to nonpeptide gap in topological similarity searches. J. Chem. Inf. Comput. Sci. 2001;41:1395–13406. doi: 10.1021/ci0100144. [DOI] [PubMed] [Google Scholar]
- 60.Cramer RD, Webster-Clark DJ. Managing bias in ROC curves. J. Comput.-Aided Mol. Des. 2008;22:141–6. doi: 10.1007/s10822-008-9181-z. [DOI] [PubMed] [Google Scholar]
Associated Data
This section collects any data citations, data availability statements, or supplementary materials included in this article.


