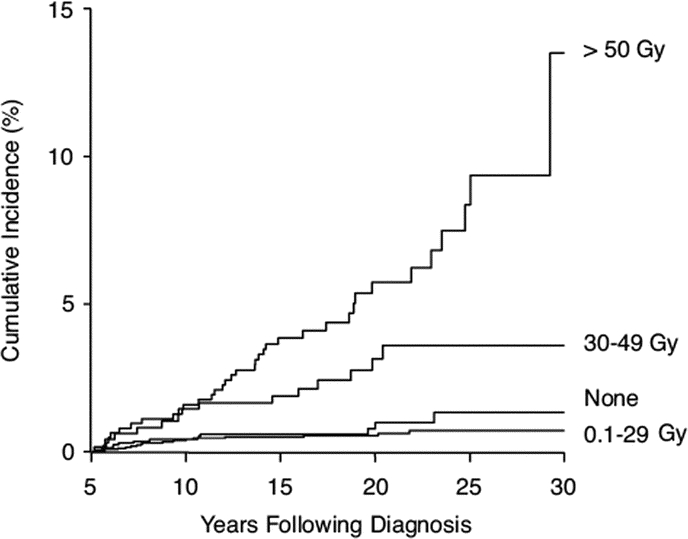
Figure 2 Incidence of late-occurring strokes with respect to radiation dose
The occurrence of stroke over time by maximum dose of cranial radiation therapy to the temporal lobe, hypothalamus, and circle of Willis comparing no radiation vs 0.1 to 29 Gy (p = 0.38), 0.1 to 29 vs 30 to 49 Gy (p = 0.001), and 30 to 49 vs 50 Gy (p = 0.02). Reprinted with permission. © 2008 American Society of Clinical Oncology. All rights reserved. Bowers D, et al. J Clin Oncol 2006;24:5277–5282.
