Abstract
Background:
Lack of clear understanding remains on the overlapping atrophy patterns of aging and early Alzheimer disease (AD) pathology in gray matter (GM) of the brain in vivo.
Objective:
To evaluate the independent and overlapping patterns of GM atrophy in normal aging and AD.
Methods:
A total of 169 cognitively normal subjects and 33 persons with probable AD enrolled in the longitudinal Cardiovascular Health Study–Cognition Study underwent 3-dimensional volumetric MRI scans. Controls remained cognitively normal for at least 5 years after their MRI scans and the probable AD subjects were relatively early in their clinical course with an average modified Mini-Mental State Examination score of 76/100. The scans were analyzed using voxel-based morphometry adjusting for total intracranial volume, gender, education, and race.
Results:
With older age, GM volume was lower in the sensorimotor and heteromodal association areas in frontal, temporal, occipital, and parietal lobes, as well as in the cerebellum (false discovery rate p = 0.05). Additional atrophy was observed in the posterior hippocampus, thalamus, and middle cingulate gyrus. By contrast, atrophy was seen in subjects with AD in the anterior hippocampal/parahippocampal regions and the precuneus. Normal aging and AD overlapped in the hippocampal body and the entorhinal cortex.
Conclusion:
Brain atrophy with aging was observed in supratentorial and infratentorial areas, as well in primary motor, sensory, and heteromodal association regions. Age and Alzheimer disease exert independent gray matter atrophy patterns but these effects overlapped substantially in the hippocampus and entorhinal cortex.
GLOSSARY
- 3MSE
= Modified Mini-Mental State Examination;
- AD
= Alzheimer disease;
- CHS-CS
= Cardiovascular Health Study–Cognition Study;
- GM
= gray matter;
- SPGR
= spoiled gradient recalled acquisition;
- TIV
= total intracranial volume;
- VBM
= voxel-based morphometry;
- WM
= white matter.
Age is the most important risk factor for Alzheimer disease (AD),1 with the prevalence rising substantially between ages 65 and 85.2 AD causes atrophy in allocortex and limbic areas3,4 with the mesial temporal lobe (entorhinal cortex and hippocampus) being vulnerable to atrophy in AD such that hippocampal volume decreases at a rate of 4%–6% per year in the disorder.5 However, AD develops in the context of normal aging, and the brains of elderly adults without dementia have lower brain weight, reduced tissue volume, and expansion of both the cerebral ventricles and sulci.6 With older age, there is loss of neuronal cells in neocortical, hippocampal, and cerebellar areas,7 shrinkage of neurons,8 and suboptimal DNA repair,9 leading to compromised neuronal integrity and reduction in synaptic density.10 As a consequence, age is believed to increase risk for AD because it is independently linked to brain atrophy.11
Understanding age-related brain atrophy is important because AD manifests itself in the context of aging. While age and AD are independent processes, they concurrently affect the brain. The purpose of this study is to establish which specific areas of brain gray matter (GM) are independently and jointly affected by normal aging and AD atrophy. This was done by identifying those areas of GM affected by normal aging alone, AD alone, and the conjunction of aging and AD.
Voxel-based morphometry (VBM)12 is a brain-wide voxel-level method of analyzing brain structure which is not constrained a priori to predefined regions of interest. We utilized data from the Cardiovascular Health Study–Cognition Study (CHS-CS), a community cohort study which has 15–20 years of clinical and neuroimaging data on both healthy aging and probable AD early in the clinical course.13 We used these data to determine the nature and extent of the independent and joint effects of age and AD on GM integrity.
METHODS
Standard protocol approvals, registrations, and patient consents.
The work described in this report was approved by the ethical standards committee on human experimentation at each of the CHS sites. In addition, the study obtained written informed consent from all participants.
Subjects.
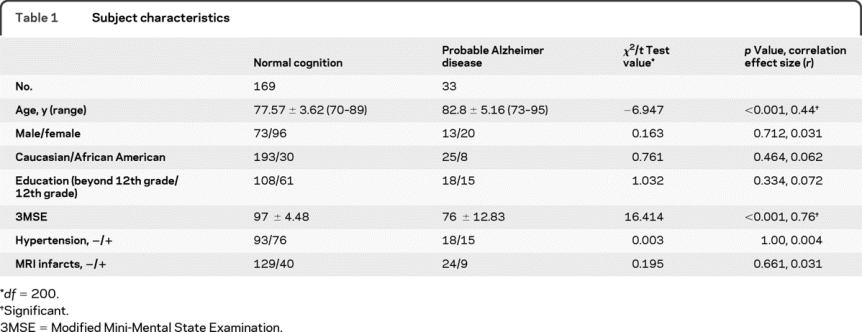
In 1998–1999, 456 CHS-CS participants, drawn from a larger sample of 532, underwent 3-dimensional volumetric MRI scans of the brain with institutional review board approval.13 We selected 169 who remained cognitively normal 5 years after their scan, reducing the likelihood that they harbored preclinical AD. We also selected 33 persons fulfilling National Institute of Neurological and Communicative Disorders and Stroke–Alzheimer’s Disease and Related Disorders Association criteria for probable AD.13 No significant differences were found between the 2 samples with regard to demographic or health-related variables except for age and Modified Mini-Mental State Examination (3MSE) score (table 1). Persons with probable AD were early in the clinical expression of dementia as evidenced by their average 3MSE score being only 4 points below the standard cutoff of 80.14 Neurologic, psychiatric, and neuropsychological evaluations, as well as the diagnostic methodology for dementia in CHS-CS, have been described previously.15,16
Table 1 Subject characteristics
MRI sequence parameters and quality assurance.
All MRI data were acquired at the University of Pittsburgh Medical Center MR Research Center using a 1.5 T GE Signa scanner (GE Medical Systems, Milwaukee, WI, LX Version). A 3-dimensional volumetric spoiled gradient recalled acquisition (SPGR) sequence was obtained (echo time/repetition time = 5/25, flip angle = 40°, number of excitations = 1, slice thickness = 1.5 mm/0 mm interslice gap), with an in-plane acquisition matrix of 256 × 256 × 124 image elements, 250 × 250 mm field of view, and an in-plane voxel size of 0.98 mm3.
Voxel-wise statistical analyses.
We applied voxel-based morphometry.12 First, all MRI scans were processed using Smallest Univalue Assimilating Nucleus from the fMRI Software Library (FSL; http://www.fmrib.ox.ac.uk/fsl/) for 3-dimensional nonlinear noise reduction. Second, we used the Brain Extraction Tool from FSL to automatically strip the skull and scalp from the images (http://www.fmrib.ox.ac.uk/analysis/research/bet/). Third, the VBM script (http://dbm.neuro.uni-jena.de/vbm/vbm2-for-spm2/) was run in Statistical Parametric Mapping (SPM2) (http://www.fil.ion.ucl.ac.uk/spm/) using MATLAB v 7.4 (The MathWorks, Natick, MA) to normalize all images to the custom Pittsburgh Elderly Template of 419 brains (69 ± 7.5 years).17 Fourth, the normalized images were segmented into GM, white matter (WM), and CSF based on registered spatial priors from our template. A hidden Markov random field threshold of 0.3 was used in the segmentation step to remove isolated voxels of one tissue type that are unlikely to reside in that particular tissue. Volumes for each tissue type were calculated by multiplying all voxels by the inverse of the Jacobian determinant of their spatial transformation matrix and this process is known as modulation in VBM. The volumes of GM, WM, and CSF obtained from this were summed to compute total intracranial volume (TIV), a measure of head size. Fifth, modulated, normalized, segmented images were smoothed using a 10-mm isotropic Gaussian kernel. Images were visually inspected at every step of VBM for registration errors and none were identified.
Multiple linear regression identified GM voxels with significant volume reduction as a function of age in all 202 subjects controlling for group (AD vs control), gender, race (Caucasian vs African American), education (±12th grade), and TIV. This analysis was repeated without the AD subjects (n = 169) to ensure that results were not confounded by the older average age of this group. We also modeled an age-by-AD group interaction to determine whether the main effect of one variable (e.g., AD) was influenced by the other (i.e., age) and this was done in 2 ways: 1) the mean age for the entire sample was subtracted from each subject’s age and then this “centered” value was multiplied by the group term (i.e., 0 for control or 1 for AD). The interaction term was tested using contrast vector weights of 1 or −1 for this interaction term to test the differences in the regression slopes; 2) similar to 1) except that each subject’s age was centered at its group mean (control or AD). To ensure that our AD results were not influenced by the different mean ages of the groups, we repeated the analysis of AD atrophy using a subset of the control group matched for age with the patients. Finally, we used a conjunction analysis18 to identify voxels that had significantly lower volumes with both normal aging and probable AD. A GM mask was applied in all analyses to confine the statistical search space to GM voxels.
Voxel-level t-values were converted to point biserial correlations (r) as a measure of effect size19 using the cg_spmT2x.m script in the VBM toolbox (http://dbm.neuro.uni-jena.de/vbm/threshold-and-transform-spmt-maps/). Since the r-values were computed from t-values obtained by multiple regressions, they represent partial correlation coefficients (rp). All t-values were evaluated under a False Discovery Rate20 pFDR < 0.05 threshold with a 100-voxel extent threshold.
The anatomic locations of all significant clusters were labeled with the Automated Anatomic Labeling atlas.21 Main effects of normal aging and probable AD were rendered onto the Standard Single Subject MNI template.22 Results of the conjunction analysis were rendered onto 3-dimensional volumetric images of the hippocampal body and the entorhinal cortex. These images are probabilistic maps derived from 10 postmortem human brains23 and warped into MNI space as part of the SPM Anatomy toolbox (http://www.fz-juelich.de/inm//spm_anatomy_toolbox). These images are referred to as the Amunts templates.
RESULTS
GM volume was linked with age in the frontal, temporal, parietal, and occipital cortices adjusting for head size, gender, education, race, and AD group status (figure 1). The results did not change when the analysis was repeated without the AD subjects. The colors observed in figure 1 can be interpreted as an indication of the magnitude of the correlation between age and GM volume. No GM areas had a significant positive correlation with age.
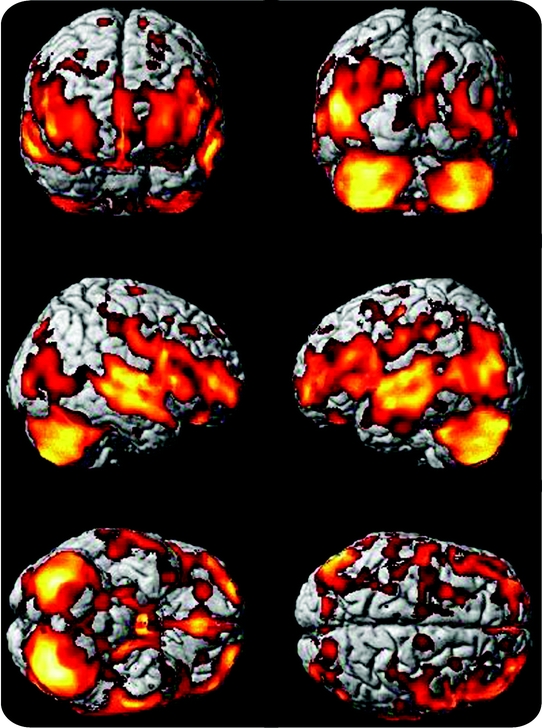
Figure 1 Age-specific brain atrophy
Age-specific brain atrophy projected onto the Standard Single Subject MNI template. Brain atrophy with aging is observed in all major lobes and cortices, with a relative sparing of the parietal lobes. Hotter (i.e., brighter) colors represent larger t values from the multiple regression analysis and can be interpreted as a greater magnitude of age-specific brain atrophy whereas regions in red represent smaller t values and thus a lower magnitude of atrophy.
Table e-1 on the Neurology® Web site at www.neurology.org lists the brain areas in which maximally significant cluster volumes of age-specific atrophy are observed. These regions include the posterior hippocampus, thalamus, and middle cingulate gyrus.
By contrast, GM atrophy was found in the AD group in the medial temporal, frontal, and parietal cortices (figure 2). GM volume was reduced in the anterior hippocampus, posterior parahippocampal gyrus, and the precuneus. There were no regions of GM where the patients with AD had larger volumes than the controls. Table e-2 shows peak maxima associated with AD atrophy, controlling for age, gender, race, education, and TIV.
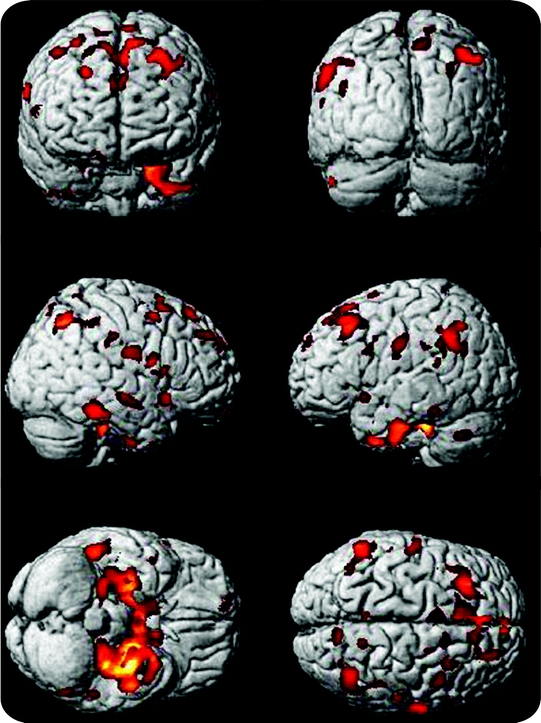
Figure 2 Brain atrophy in Alzheimer disease (AD)
Brain atrophy in the AD group is projected onto the Standard Single Subject MNI template in this figure. AD atrophy is seen most impressively in the medial temporal lobes but is also seen in the dorsolateral prefrontal cortex, and the junction of the temporal and parietal lobes.
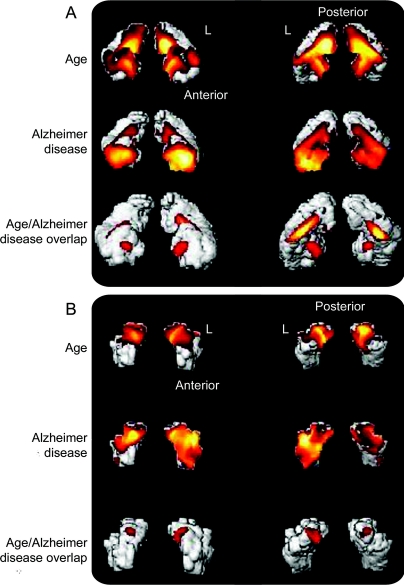
Figure 3 shows the independent and joint main effects of age and AD atrophy in all 202 subjects projected onto the Amunts templates for the hippocampus. Part A shows anterior (left side) and posterior (right side) volume renderings of the hippocampal body with results of the independent main effects of age and AD in the first 2 rows. The main effect of age is most noticeable in the posterior aspects of the hippocampal body whereas AD atrophy is most apparent in the anterior regions. The third row of renderings shows the results of the conjunction analysis of age and AD. These are the voxels in which there is atrophy attributable to age, and separately to AD. Part B shows the same information for the entorhinal cortex. Brain atrophy with aging is not as extensive as AD atrophy, which appears to affect the left entorhinal cortex more than the right.
Figure 3 Confluence of age and Alzheimer disease (AD) atrophy
(A) Anterior and posterior volume renderings of the hippocampal body with result of the independent main effects of age and AD in the first 2 rows. The third row of renderings shows the results of the conjunction analysis of age and AD main effects. These are voxels in which there is both a significant effect of age with lower gray matter volume and AD atrophy. The letter “L” is placed directly adjacent to the left hemispheric rendering of the hippocampal body. Anterior and posterior orientations are also designated. (B) The same information for the entorhinal cortex.
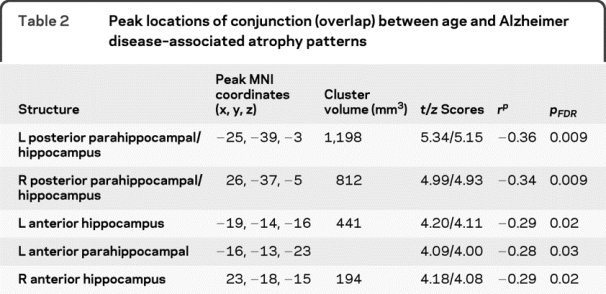
The peak maxima of the conjunction between age and AD atrophy are all located in the hippocampus and parahippocampal gyrus (table 2). No extrahippocampal conjunctions were observed. Additionally, there was no age-by-AD interaction found using any of our 2 approaches, meaning that the effects of each variable did not vary as a function of the other. Figure e-1 shows the age/AD overlap in midsagittal planes. A detailed description of these results can be found in the caption for this figure in the online supplemental section. Thus, age and AD atrophy patterns are independent but have significant overlap in the hippocampus.
Table 2 Peak locations of conjunction (overlap) between age and Alzheimer disease–associated atrophy patterns
DISCUSSION
There are 3 important findings in this study. First, atrophy with older age encompasses infratentorial and supratentorial gray matter, as well as the primary motor, sensory, and heteromodal association areas. Second, AD atrophy targets the anterior hippocampal regions and the precuneus, even relatively early in the clinical expression of the dementia syndrome. Third, atrophy due to AD exists in the milieu of age-specific changes, and significant overlap was found in the hippocampus. Importantly, the fact that the control subjects remained cognitively normal (by neuropsychological testing) for at least 5 years after their scans means that the normal aging GM volume loss observed in this group was not due to presymptomatic neurodegeneration, as would be the case for a cross-sectional study.
The confluence of age and AD atrophy in the medial temporal lobe suggests this region is a common target of both processes. The hippocampus is independently affected by both age and AD24,25 and we are showing that it is a key site of overlap between the 2 phenomena. This suggests that at least one reason that age is such a key risk factor for AD is because it is strongly linked to critical brain areas affected by AD. Consequently, efforts to attenuate brain atrophy due to aging, especially in the medial temporal lobes, may reduce risk for AD.
It is important to clarify concepts of aging and how they pertain to our specific study. Some studies appear to suggest that aging is a distinct process that itself induces changes in brain structure,26 while others imply that it is not age itself that induces brain changes, but rather, conditions that are common with older age (e.g., cardiovascular and cerebrovascular disease) that drive brain aging.27 For example, the CHS-CS has reported that elderly persons without dementia with hypertension have lower resting cerebral blood flow than their nonhypertensive counterparts.28 We did not address this issue in the present study, but believe additional work will be needed to determine how these conditions are linked to GM atrophy in the elderly.
Our data are consistent with previous observations regarding brain atrophy with aging.26,29,30 One study29 examined the brain volumes of 2,200 unselected individuals aged 34 to 97, and found that age-specific volume changes generally occur after age 50, mainly in the frontal lobes, with less change in the temporal, parietal, and occipital lobes. Our study showed that the effects of age in cognitively normal individuals older than 75 years are widespread and involve primary motor, sensory, and heteromodal association areas, as well as the cerebellum. The strong atrophy with aging we observe in these areas, particularly cerebellum, may reflect altered plasticity in efferent and afferent pathways that are involved in visual, sensory,31 and motor/mobility32 functions in the elderly.
With chronological age, there is atrophy in prefrontal, temporal, occipital, and parietal cortices, cerebellum, and caudate nuclei25,26,30,33; the extent of the atrophy is linked with specific cognitive functions.25 Hippocampal and mesial temporal lobe volume loss have been reported in normal aging,25 consistent with neuropathologic studies that found that neurofibrillary tangles and neuronal loss can be present in cognitively normal individuals.34 Interestingly, one of the largest imaging studies of normal aging adults found brain volume decreases with aging in the superior parietal, precentral, and postcentral gyri, insula, anterior cingulate, and cerebellum volumes, with relative preservation of mesial temporal lobe structures in subjects aged 18 to 79.30 It is possible that the paucity of subjects older than age 75 explained the lack of age-specific brain atrophy in the mesial temporal lobe in this cohort. Differences in our study age range compared to other studies likely account for at least some of the discordant results. Additional differences in study results can be possibly attributed to our use of controls that remained cognitively normal over time whereas other investigations may have controls that are cognitively normal but are on the verge of converting to a state of dementia.
Few studies have examined the joint effects of both normal aging and AD on brain structure. A cross-sectional study of 92 cognitively normal persons (age range 31–83) and 26 probable AD cases (age range 59–79) also found independent effects of both age and AD on GM atrophy. Atrophy with aging was seen in the prefrontal cortex, insula, anterior cingulate gyrus, superior temporal gyrus, inferior parietal lobule, and precuneus. In agreement with our data, lower hippocampal volumes were observed to be independently linked with AD and were seen most strongly in the anterior hippocampal areas.24 Another study35 found that hippocampal volumes were 11.5% smaller in subjects with AD compared to normal controls, and shape analysis showed this atrophy occurred in anterior regions (CA1, subiculum, and dentate gyrus), as noted in our study.
While we found AD atrophy in the parietal lobes and precuneus areas, precuneus GM volume loss was not as great as that in the cerebellum, middle cingulate, or supplemental motor area and we did not find atrophy in the posterior cingulate cortex as observed in other work.33,36 This may be due to the older age (mean = 78) of the CHS-CS subjects, as persons with clinical onset of the dementia after 65 exhibit more focal volume loss in the mesial temporal lobe. By contrast, persons diagnosed before 65 exhibit a more diffuse pattern of neocortical atrophy including in the posterior cingulate gyrus.37,38
A key advantage of the CHS-CS is the ability to identify cognitive status at different time points, thus allowing us to select control subjects who remain cognitively normal over time. This minimizes contamination of the healthy aging sample with subjects harboring preclinical neurodegenerative conditions that might not be detected in cross-sectional studies, or in studies that use screening instruments of cognitive status. Consequently, the brain atrophy patterns we observe with age are more likely to be primarily attributable to normal aging and not preclinical neurodegeneration.
Registration errors can occur during VBM spatial normalization due to the increased variability encountered with elderly brains. We addressed this problem by using a custom template of 419 normal elderly brains (69 ± 7.5 years)17 for the normalization step, which can produce more biologically plausible intergroup comparisons than a “standard” template image.39 We did not use separate templates for the controls and subjects with AD because this can result in an overestimation of GM volume loss and a misclassification of the location of volume loss.40
By including subjects with AD in the multiple regression analysis on age, some of the age-specific GM volume loss may be AD atrophy. However, the results did not differ when the subjects with AD were excluded. In addition, an analysis with an age-matched control group showed the same overlap of the 2 atrophy patterns in the hippocampus as was seen in the combined analysis. Thus, we are confident that the analysis using the entire sample of 202 subjects accurately represents the effects of age on brain structure.
Our voxel-based analysis of structural brain MRI revealed extensive GM volume loss with aging that most strongly occurs in the hippocampus and overlaps with AD pathology. Neuroimaging can provide insight into the confluence of these processes. We suggest that delaying or moderating brain atrophy with older age could also delay dementia onset to the extent that such interventions modify the structural integrity of the brain.
ACKNOWLEDGMENT
The authors thank Dr. Geoffrey Murdoch for useful comments and feedback and Victoria Maruca for technical assistance. C.A.R. thanks Dr. William E. Klunk for overall mentorship and guidance.
DISCLOSURE
Dr. Raji receives research support from the American Heart Association [predoctoral grant 0815465D] and was supported in his training by funds from the Radiological Society of North America [RMS0717]. Dr. Lopez serves on scientific advisory boards for Pfizer Inc. and Bristol-Myers Squibb and receives research support from the NIH [NIA P50 AG05133-23 (PI), NIA AG20098-06 (PI), and NCCAM 5 U01 AT00162-08 (PI)]. Dr. Kuller receives research support from the NIH [NIA AG15928 (Co-PI)]. Dr. Carmichael served on an external advisory board for the University of Southern California Alzheimer’s Disease Center as an external advisory board member; served as a consultant to Unilever (Foods For Health Initiative); serves as an Associate Editor of Alzheimer’s Disease and Associated Disorders; and receives research support from the NIH [K01 AG 030514 (PI)], the Dana Foundation, and the Hilblom Foundation. Dr. Becker served as editor of Neuropsychology and receives research support from the NIH [U01AI035041 (Co-I), R03MH081723 (PI), R03MH081721 (PI), R03DA025986 (PI), P01AG05133 (Co-I), R01AG20098 (Co-I), and R01MH072947 (Co-I)].
Supplementary Material
Address correspondence and reprint requests to Dr. Cyrus A. Raji, University of Pittsburgh School of Medicine, 3501 Forbes Avenue, Suite 830, Pittsburgh, PA 15213-2582 cyrusraji@gmail.com
Supplemental data at www.neurology.org
e-Pub ahead of print on October 21, 2009, at www.neurology.org.
Supported by contracts N01-HC-85079 through N01-HC-85086, N01-HC-35129, and N01-HC-15103 from the National Heart, Lung, and Blood Institute. C.A.R. was supported by a predoctoral grant from the American Heart Association (0815465D) and was supported in his training by funds from the Radiological Society of North America (RMS0717).
A full list of participating CHS investigators and institutions is available at www.chs-nhlbi.org.
Disclosure: Author disclosures are provided at the end of the article.
Presented in part at the annual meeting of the American Academy of Neurology, Seattle, WA, April 25–May 2, 2009. C.A.R. was the winner of the 2009 Extended Neuroscience Essay Award for this work.
Received June 11, 2009. Accepted in final form September 10, 2009.
REFERENCES
- 1.Stern Y, Mayeux R, Sano M, Hauser WA, Bush T. Predictors of disease course in patients with probable Alzheimer’s disease. Neurology 1987;37:1649–1653. [DOI] [PubMed] [Google Scholar]
- 2.Sloane PD, Zimmerman S, Suchindran C, et al. The public health impact of Alzheimer’s disease, 2000–2050: potential implication of treatment advances. Annu Rev Public Health 2002;23:213–231. [DOI] [PubMed] [Google Scholar]
- 3.Pearson RCA, Esiri MM, Hiorns RW, Wilcock GK, Powell TPS. Anatomical correlates of the distribution of the pathological changes in the neocortex in Alzheimer’s disease. Proc Natl Acad Sci USA 1985;82:4531–4534. [DOI] [PMC free article] [PubMed] [Google Scholar]
- 4.Moossy J, Zubenko GS, Martinez AJ, Rao GR. Bilateral symmetry of morphologic lesions in Alzheimer’s disease. Arch Neurol 1988;45:251–254. [DOI] [PubMed] [Google Scholar]
- 5.Jack CR, Petersen RC, Xu Y, et al. Rates of hippocampal atrophy correlate with change in clinical status in aging and AD. Neurology 2000;55:484–489. [DOI] [PMC free article] [PubMed] [Google Scholar]
- 6.Skullerand K. Variations in the size of the human brain: influence of age, sex, body length, body mass index, alcoholism, Alzheimer changes, and cerebral atherosclerosis. Acta Neurol Scand 1985;suppl 102:1–94. [PubMed] [Google Scholar]
- 7.Simić G, Kostović I, Winblad B, Bogdanović N. Volume and number of neurons of the human hippocampal formation in normal aging and Alzheimer’s disease. J Comp Neurol 1997;379:482–494. [DOI] [PubMed] [Google Scholar]
- 8.Haugh H. Are Neurons of the Human Cerebral Cortex Really Lost During Aging? A Morphometric Examination. Berlin: Springer; 1985. [Google Scholar]
- 9.Rutten BP, Schmitz C, Gerlach OH, et al. The aging brain: accumulation of DNA damage or neuron loss? Neurobiol Aging 2007;1:91–98. [DOI] [PubMed] [Google Scholar]
- 10.Morrison JH, Hof PR. Life and death of neurons in the aging cerebral cortex. Int Rev Neurobiol 2007;81:41–57. [DOI] [PubMed] [Google Scholar]
- 11.Raz N, Rodrigue KM, Head D, Kennedy KM, Acker JD. Differential aging of the medial temporal lobe: a study of a five-year change Neurology 2004;62:433–438. [DOI] [PubMed] [Google Scholar]
- 12.Ashburner J, Friston KJ. Voxel-based morphometry: the methods. Neurology 2000;11:805–821. [DOI] [PubMed] [Google Scholar]
- 13.Lopez OL, Kuller LH, Fitzpatrick A, Ives D, Becker JT, Beauchamp N. Evaluations of dementia in the cardiovascular health cognition study. Neuroepidemiology 2003;22:1–12. [DOI] [PubMed] [Google Scholar]
- 14.Graham JE, Rockwood K, Beattie EL. Prevalence and severity of cognitive impairment with and without dementia in an elderly population. Lancet 1997;349:1793–1796. [DOI] [PubMed] [Google Scholar]
- 15.Lopez OL, Kuller LH, Becker JT, et al. Incidence of dementia in mild cognitive impairment in the Cardiovascular Health Study. Arch Neurol 2007;64:416–420. [DOI] [PubMed] [Google Scholar]
- 16.Lopez OL, Jagust WJ, DeKosky ST, et al. Prevalence and classification of mild cognitive impairment in the Cardiovascular Health Study Cognition Study Part 1. Arch Neurology 2003;60:1385–1389. [DOI] [PubMed] [Google Scholar]
- 17.Spears JR, Greer PJ, Ziolko SK, et al. Evaluation of an age-specific neurological template. Presented at the annual meeting of the Organization of Human Brain Mapping; Toronto, Ontario, Canada; June 2005.
- 18.Friston KJ, Penny WD, Glaser DE. Conjunction revisited. Neuroimage 2005;25:661–667. [DOI] [PubMed] [Google Scholar]
- 19.Cohen J. Statistical Power Analysis for the Behavioral Sciences, 2nd Ed. Hillsdale, NJ: Lawrence Erlbaum Associates; 1988. [Google Scholar]
- 20.Genovese CR, Lazar NA, Nichols TE. Thresholding of statistical maps in functional neuroimaging using the false discovery rate. Neuroimage 2002;15:870–878. [DOI] [PubMed] [Google Scholar]
- 21.Tzourio-Mazoyer N, Papathanassiou D, Crivello F, et al. Automated anatomical labeling of activations in SPM using a macroscopic anatomical parcellation of the MNI MRI single-subject brain. Neuroimage 2002;15:273–289. [DOI] [PubMed] [Google Scholar]
- 22.Holmes CJ, Hoge R, Collins L, Woods R, Toga AW, Evans AC. Enhancement of MR images using registration for signal averaging. J Comput Assist Tomogr 1998;22:324–333. [DOI] [PubMed] [Google Scholar]
- 23.Amunts K, Kedo O, Kindler M, et al. Cytoarchitectonic mapping of the human amygdala, hippocampal region and entorhinal cortex: intersubject variability and probability maps. Anat Embryol (Berl) 2005;210:343–352. [DOI] [PubMed] [Google Scholar]
- 24.Ohnishi T, Matsuda H, Tabira T, Asada T, Uno M. Changes in brain morphology in Alzheimer disease and normal aging: is Alzheimer disease an exaggerated aging process? AJNR Am J Neuroradiol 2001;22:1680–1685. [PMC free article] [PubMed] [Google Scholar]
- 25.Raz N, Gunning-Dixon FM, Head D, Dupuis JH, Acker JD. Neuroanatomical correlates of cognitive aging: evidence from structural magnetic resonance imaging. Neuropsychology 1998;12:95–114. [DOI] [PubMed] [Google Scholar]
- 26.Smith CD, Chebrolu H, Wekstein DR, Schmitt FA, Markesbery WR. Age and gender effects on human brain anatomy: a voxel-based morphometric study in healthy elderly. Neurobiol Aging 2007;28:1075–1087. [DOI] [PubMed] [Google Scholar]
- 27.Jagust WJ, Zheng L, Harvey DJ, et al. Neuropathological basis of magnetic resonance images in aging and dementia Ann Neurol 2008;63:72–80. [DOI] [PMC free article] [PubMed] [Google Scholar]
- 28.Dai W, Lopez OL, Carmichael OT, Becker JT, Kuller LH, Gach HM. Abnormal regional cerebral blood flow in cognitively normal elderly subjects with hypertension. Stroke 2008;39:349–354. [DOI] [PMC free article] [PubMed] [Google Scholar]
- 29.DeCarli C, Massaro J, Harvey D, et al. Measures of brain morphology and infarction in the Framingham Heart Study: establishing what is normal. Neurobiol Aging 2005;26:491–510. [DOI] [PubMed] [Google Scholar]
- 30.Good CD, Johnsrude IS, Ashburner J, Henson RNA, Friston KJ, Frackowiak RSJ. A voxel-based morphometric study of aging in 465 normal adult human beings. Neuroimage 2001;14:21–36. [DOI] [PubMed] [Google Scholar]
- 31.Mahncke HW, Brownstone A, Merzenich MM. Brain plasticity and functional losses in the aged: scientific bases for a novel intervention. Prog Brain Res 2006;157:81–109. [DOI] [PubMed] [Google Scholar]
- 32.Rosano C, Brach J, Studenski S, Longstreth WT, Jr., Newman AB. Gait variability is associated with subclinical brain vascular abnormalities in high-functioning older adults. Neuroepidemiology 2007;29:193–200. [DOI] [PMC free article] [PubMed] [Google Scholar]
- 33.Buckner RL, Snyder AZ, Shannon BJ, et al. Molecular, structural, and functional characterization of Alzheimer’s disease: Evidence for a relationship between default activity, amyloid, and memory. J Neurosci 2005;25:7709–7717. [DOI] [PMC free article] [PubMed] [Google Scholar]
- 34.Guillozet AL, Weintraub S, Mash DC, Mesulam MM. Neurofibrillary tangles, amyloid, and memory in aging and mild cognitive impairment. Arch Neurol 2003;60:729–736. [DOI] [PubMed] [Google Scholar]
- 35.Scher AI, Xu Y, Korf ES, et al. Hippocampal shape analysis in Alzheimer’s disease: a population-based study. Neuroimage 2007;36:8–18. [DOI] [PubMed] [Google Scholar]
- 36.Whitwell JL, Shiung MM, Przybelski SA, et al. MRI patterns of atrophy associated with progression to AD in amnestic mild cognitive impairment. Neurology 2008;70:512–520. [DOI] [PMC free article] [PubMed] [Google Scholar]
- 37.Karas G, Scheltens P, Rombouts S, et al. Precuneus atrophy in early-onset Alzheimer’s disease: a morphometric structural MRI study. Neuroradiol 2007;49:967–976. [DOI] [PubMed] [Google Scholar]
- 38.Apostolova LG, Dinov ID, Dutton RA, et al. 3D comparison of hippocampal atrophy in amnestic mild cognitive impairment and Alzheimer’s disease. Brain 2006;129:2867–2873. [DOI] [PubMed] [Google Scholar]
- 39.Senjem MJ, Guner JL, Shiung MM, Petersen RC, Jack CR. Comparison of different methodological implementations of voxel-based morphometry in neurodegenerative disease. Neuroimage 2005;26:600–608. [DOI] [PMC free article] [PubMed] [Google Scholar]
- 40.Shen S, Szameitat AJ, Sterr A. VBM lesion detection depends on the normalization template: a study using simulated atrophy. Magn Reson Imaging 2007;25:1385–1396. [DOI] [PubMed] [Google Scholar]
Associated Data
This section collects any data citations, data availability statements, or supplementary materials included in this article.


