Abstract
Objective:
To define changes in cortical function in persons inheriting familial Alzheimer disease (FAD) mutations before the onset of cognitive decline.
Methods:
Twenty-six subjects with a family history of FAD were divided into 2 subgroups according to genotype (FAD mutation carriers, n = 15; FAD noncarriers, n = 11). Subjects were given standardized tests of cognitive function and the Clinical Dementia Rating scale (CDR). Sensory (P50, N100, P200) and cognitive (N200, P300) event-related potentials were recorded during an auditory discrimination task. Amplitudes and latencies of cortical potentials were compared among FAD mutation carriers and noncarriers.
Results:
FAD mutation carriers and noncarriers did not significantly differ in age or on measures of cognitive function, but FAD carriers had a greater incidence of 0.5 CDR scores (1/10 noncarriers, 5/15 carriers). Relative to noncarriers, FAD mutation carriers had significantly longer latencies of the N100, P200, N200, and P300 components, and smaller slow wave amplitudes. Subanalyses of subjects having CDR scores of 0.0 also showed latency increases in FAD mutation carriers.
Conclusions:
Auditory sensory and cognitive cortical potentials in persons with familial Alzheimer disease (FAD) mutations are abnormal approximately 10 years before dementia will be manifest. Longer event-related potential latencies suggest slowing of cortical information processing in FAD mutation carriers.
GLOSSARY
- AD
= Alzheimer disease;
- ANOVA
= analysis of variance;
- CASI
= Cognitive Abilities Screening Instrument;
- CDR
= Clinical Dementia Rating Scale;
- ERP
= event-related potential;
- FAD
= familial Alzheimer disease.
A minority of Alzheimer disease (AD) cases are attributable to genetic mutations, and are categorized as familial AD (FAD). Familial AD provides an opportunity to study preclinical cognitive and neural decline in AD because the mutations are fully penetrant, and age at dementia onset tends to be consistent within a family.1,2 Three genes whose mutations cause autosomal dominantly inherited familial AD have been identified: presenilin-1 (PSEN1) and 23 and amyloid-precursor protein (APP).4 Relative to sporadic AD, familial AD typically has a younger age at onset, a more rapid course of decline, and can include paraparesis, myoclonus, and seizures.5
The neuropathologic profile in FAD is similar to sporadic AD, with neurofibrillary tangles and beta-amyloid plaques present in cortical association areas and subcortical modulatory systems.6,7 The impact of neuropathology on cortical function can be studied by measuring auditory event-related potentials (ERPs) in response to a stimulus. Auditory ERP components reflect activity of sensory (P50, N100, P200) and association (N200, P300, slow wave) cortical systems.
The objective of this study was to define cortical activity associated with preclinical AD using auditory ERPs in several families with FAD. Subjects were grouped as a function of FAD genotype (mutation carrier vs noncarrier), and auditory ERPs were measured during an auditory stimulus discrimination task. Based on results in MCI and sporadic AD8,9 we predicted increased sensory component amplitudes and longer latencies of cognitive components.
METHODS
Subjects.
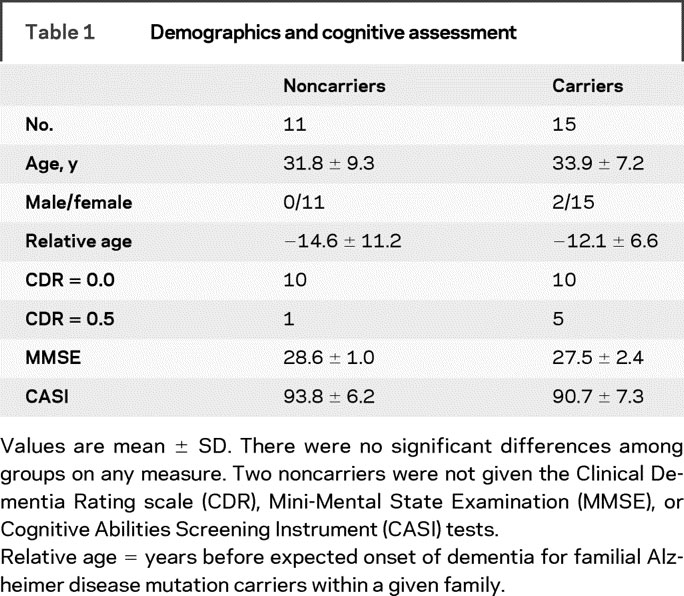
A total of 26 subjects of Mexican descent were tested and divided into 2 subgroups according to genotype (FAD mutation carriers, n = 15; FAD noncarriers, n = 11). Twenty-four subjects had first-degree relatives diagnosed with dementia and known to have pathogenic PSEN1 or APP mutations and were therefore known to be at risk for these same mutations. Nineteen subjects were from families having PSEN1 mutations (A431E substitution = 14, L235V substitution = 5) and 5 were from 2 families with an APP mutation (V717I substitution). Two additional ethnically, age-, and gender-matched healthy controls were studied and included in the noncarrier group to help balance the groups. Subjects were made aware of their risk for AD through genetic testing as part of the clinical assessment of an affected family member. Some participants resided in Mexico and traveled to Southern California for testing (n = 14), while the remaining subjects lived in Southern California. Demographic information is shown in table 1.
Table 1 Demographics and cognitive assessment
For genetic testing, DNA was extracted from blood samples, and the presence of A431E and L235V substitutions in presenilin-1 were assessed using restriction fragment length polymorphism analyses. The presence of the V717I substitution in amyloid precursor protein was assessed with direct sequencing. For all but 1 subject who decided to pursue clinical presymptomatic testing and the 2 additional matched controls, clinical assessments were performed blind to subjects’ genetic status. For all subjects, event-related potential analyses were conducted blind to genetic status and clinical test results. Subjects were informed they would be tested for the FAD mutation for which they were at risk, but in the context of the research protocol would not be told the result.
Standard protocol approvals, registrations, and patient consents.
All subjects gave their written informed consent and all study procedures were approved by Institutional Review Boards at UCLA, UC Irvine, and the National Institute of Neurology and Neurosurgery in Mexico City.
Clinical staging and cognitive assessments.
Subjects primarily spoke English (n = 5) or Spanish (n = 19), or were bilingual (n = 2). All were assessed with the Cognitive Abilities Screening Instrument (CASI) and the Clinical Dementia Rating Scale (CDR). The CASI uses a 100-point scale to quantify general cognitive abilities, and has been translated into Spanish.10 The CDR is a structured interview with input from both the subject and an informant who knows the subject well.11 In the CDR asymptomatic persons are rated 0, and persons with questionable cognitive impairment are rated 0.5. Dementia severity is indicated by scores of 1 (mild), 2 (moderate), and 3 (severe). The CDR was performed by investigators (L.M., J.R.) with both an unrelated informant and the subject. Subjects were also given the Mini-Mental State Examination as a standard screen for dementia.12
Behavioral task.
Subjects performed a target detection, or oddball, task by listening to a sequence of tones having a constant interstimulus interval of 2.5 seconds.13 Tones were presented from 2 speakers placed ∼0.75 m in front of the subject (70 dB SPL, 100 msec duration, 5 msec rise/fall times). Pure tones were either 1,000 Hz nontargets or 2,000 Hz targets. Probability of presentation was 0.80 for targets and 0.20 for nontargets (total of 300 tones; 60 targets, 240 nontargets). Subjects listened to the tones and were instructed to quickly press a button when a target was presented, while maintaining high levels of accuracy. The sequence of tones was randomly determined except that 2 targets were never presented in a row, and a maximum of 9 nontargets could be presented in a row.
Electrophysiologic recordings.
Subjects were seated inside a sound attenuating, electrically shielded booth. Ten Ag/AgCl recording electrodes were placed on the scalp according to the 10/20 system (Fz, Cz, Pz, Oz, F3, C3, P3, F4, C4, and C4 sites; impedance <5 kOhm). Electrodes were placed above and below the left eye to monitor eye movements, and 1 electrode on the forehead was the ground. Reference electrodes were placed on the left and right mastoid in a linked mastoid configuration. The EEG and EOG were amplified (DC-100 Hz, sample rate = 500 Hz) and collected continuously, with additional offline analysis. Eyeblink artifacts were corrected using an algorithm,14 and sweeps were then averaged according to stimulus type (nontarget or target). Sweeps to targets were visually inspected for artifacts before being accepted into the average. Sweeps to nontargets were automatically rejected if the voltage on any electrode site exceeded ±75 μV, and all subjects had clear ERP peaks. ERP recordings were performed and analyzed by personnel blind to subjects’ genetic status, including that of the 2 controls who were not at risk for FAD.
Data analysis.
Reaction time was calculated relative to stimulus onset. Accuracy was the percent of correct responses to target tones (out of 60), and false alarms indicated button presses to nontargets. Median reaction times were calculated for each subject to limit the influence of any outlier reaction times. Outliers were not a problem with the present data, and FAD group comparisons were identical to those using mean reaction times (data not shown).
ERPs were digitally filtered (0.1–16 Hz, 12 dB/octave, P300 and slow wave measures used DC-16 Hz, 12 dB/octave). Peak latencies of components were calculated relative to stimulus onset. Amplitudes of stimulus-evoked potentials were defined relative to a 100-msec baseline period immediately before stimulus presentation. The P50, N100, and P200 components were measured to nontargets and targets. The N200 and P300 components were also measured for targets. The P50 was defined as the maximum positivity between 40 and 80 msec poststimulus, the N100 was the maximum negativity between 80 and 160 msec, and the P200 was the maximum positivity between 150 and 250 msec. The N200 was the maximum negativity between the P200 and P300 (250–350 msec), and the P300 was defined as the maximum positivity between 300 and 700 msec.
Statistical analysis.
ERPs and behavioral data from target detection and clinical tests were analyzed with t tests or analysis of variance (ANOVA). p Values <0.05 were considered significant. Most analyses used t tests to compare carriers vs noncarrier groups. Analysis of variance had the factor of FAD genotype (group: carrier, noncarrier) and electrode site (Fz, Cz, Pz for midline comparisons, C3 and C4 for hemispheric comparisons). The P50, N100, P200, and N200 components were measured from the Cz site; the P300 was measured from the Pz site. Midline sites were chosen because amplitudes of these ERP components are typically largest at midline sites. The slow wave was measured from Fz, Cz, and Pz sites (mean voltage from 400 to 550 msec). Stepwise discriminant function analyses quantified the ability of ERP measures to successfully classify individuals according to FAD genotype. Prediction of a given subject’s classification was based upon a model that did not include that subject.
RESULTS
Demographics and clinical tests.
Demographic and clinical test results from FAD mutation carriers and noncarriers are shown in table 1. Five mutation carriers and one noncarrier had CDR scores of 0.5. All remaining subjects had CDR scores of 0. None of the measures showed significant differences between groups. Two subjects included in the FAD carrier group had MMSE scores of 22 and 24, but the ERP results were the same when these 2 subjects were excluded.
Target detection task: Behavior.
Behavioral measures in the target detection task were compared between groups using t tests. There were no significant group differences in median reaction time for noncarriers (364 ± 29 msec) and carriers (326 ± 17 msec). There were also no significant group differences for accuracy (98% both groups) or false alarms (1% both groups).
Target detection task: ERPs.
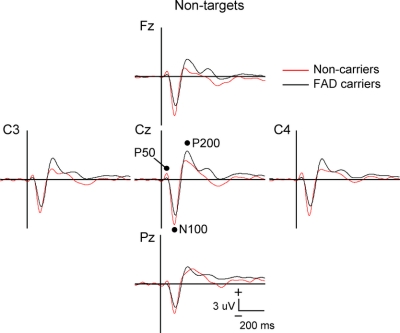
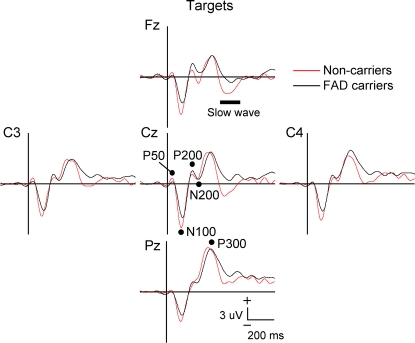
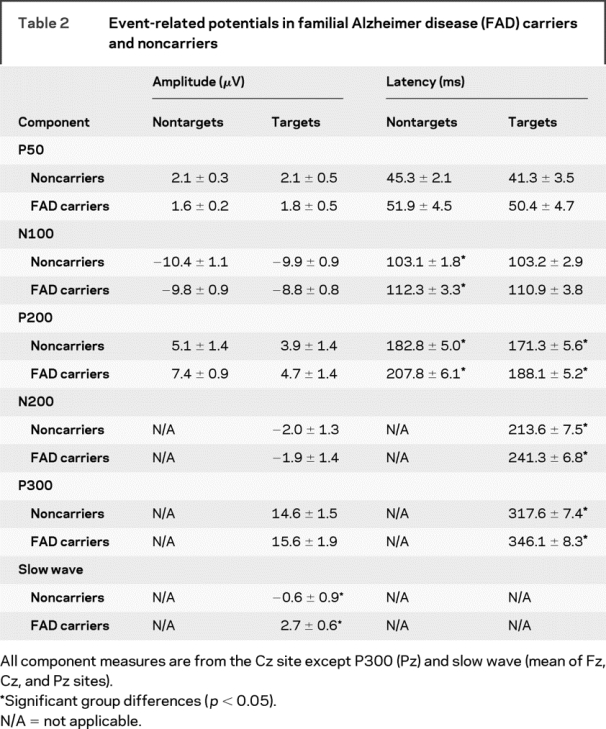
ERPs in FAD mutation and noncarrier groups are shown in figures 1 (nontargets) and 2 (targets), with the corresponding peak amplitude and latency measures shown in table 2. ERP peak latencies and amplitudes at a single electrode site were compared between groups using t tests. ANOVA was used when more than 1 electrode site was analyzed.
Figure 1 Event-related potentials to nontarget stimuli in familial Alzheimer disease carriers vs noncarriers
Mutation carriers had significantly longer N100 and P200 latencies, and larger P200 amplitudes at lateral electrode sites. Vertical bar indicates stimulus onset.
Figure 2 Event-related potentials to target stimuli in familial Alzheimer disease carriers vs noncarriers
Mutation carriers had significantly longer latencies for the P200, N200, and P300 components and smaller slow wave amplitudes. Vertical bar indicates stimulus onset.
Table 2 Event-related potentials in familial Alzheimer disease (FAD) carriers and noncarriers
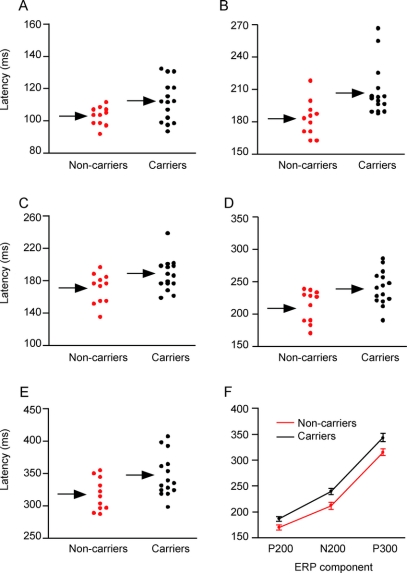
Latency measures from individual subjects are plotted in figure 3 for N100 and P200 latencies to nontargets (A, B), and P200, N200, and P300 latencies to targets (C–E). A plot of latencies for the P200, N200, and P300 components to targets is shown in figure 3F.
Figure 3 Event-related potential results from individual subjects
Components include the N100 (A) and P200 to nontargets (B), and the P200 (C), N200 (D), and P300 (E) to targets. (F) Plot of P200, N200, and P300 latencies to targets. Arrows indicate mean group values. Error bars = SE.
There were group differences in nontarget ERP latencies for the N100 (t(24) = 2.2; p < 0.04) and P200 (t(24) = 3.0; p < 0.01) components, with longer latencies in the FAD mutation group. Latencies of ERPs to targets were also prolonged in FAD mutation relative to noncarriers, with differences for the P200 (t(24) = 2.2; p < 0.04), N200 (t(24) = 2.7; p < 0.02), and P300 (t(24) = 2.5; p < 0.02) components. Comparison of latencies across the ERP components showed that the latencies in the FAD mutation group were ∼10% longer than the noncarrier group. A subanalysis containing only subjects having CDR scores of “0.0” (FAD carrier n = 10, noncarrier n = 9) had the same results except there was a trend for P300 latency differences (p < 0.08).
Analysis of ERP amplitudes to nontargets indicated no significant group differences in P50 or N100 amplitudes. The P200 did not differ among groups at Cz. However, analysis at lateral sites using a 2 (group) × 2 (site: C3, C4) ANOVA had an effect of group (F(1,24) = 5.6; p < 0.03), with larger amplitudes in the FAD mutation subjects. There were no significant differences for N200 or P300 amplitudes. Analysis of slow wave amplitudes to targets used a 2 (group) × 3 (site: Fz, Cz, Pz) ANOVA test. There were effects of group (F(1,23) = 9.6; p < 0.01) and electrode site (F(2,46) = 50.1; p < 0.001), with more positive values in FAD carriers. The electrode site effect indicates negative potentials at the frontal electrode site and progressively more positive values at posterior sites. Post hoc t tests comparing slow wave amplitudes in each group were significant at all electrode sites (Fz: p < 0.01; Cz: p < 0.02; Pz: p < 0.03). Inclusion of only subjects with CDR scores of 0.0 did not change the slow wave results, but P200 amplitudes were no longer significantly different between groups. Note that one outlier FAD carrier was not included in the slow wave analysis (slow wave amplitude >3.3 SD from mean).
A stepwise discriminant analysis was performed using nontarget N100 and P200 latencies and target P200, N200, and P300 latencies and slow wave amplitude. The output model included the P200 latency and slow wave measures, and correctly classified 82% (9/11) of noncarriers and 86% (11/14, 1 slow wave outlier not included) of FAD carriers. Use of nontarget P200 latency alone was able to correctly classify 64% (7/11) of FAD noncarrier subjects and 87% (13/15) of FAD mutation subjects.
DISCUSSION
The main finding of this study was a significant delay in peak latencies of cortical potentials to sounds in FAD mutation carriers relative to noncarriers from the same families. Delays in ERP latencies were observed in subjects having minimal or no cognitive deficits, and thus may indicate changes in cortical function prior to the clinical expression of AD. FAD carriers also had smaller slow wave amplitudes and larger P200 amplitudes.
Auditory ERPs are generated by synchronous activity in populations of cortical neurons that are time-locked to stimulus onset.15 Prolonged ERP latencies, in particular the P300, are observed in many neurologic and psychiatric disorders such as dementia,16 closed head injury,17 multiple sclerosis,18 and major depression.19 The N200 has been studied less intensively than the P300, but also has a longer latency in older MCI and AD patients compared to age-matched controls.20 The N200, P300, and slow wave are considered cognitive potentials that are present when selectively attending to a task,21 while the N100 and P200 are typically considered sensory components that can be influenced by cognitive factors.22,23 The N100 and P200 largely reflect auditory cortical responses,24,25 while the P300 is generated by parietal, temporal, and prefrontal association cortex.26 Taken together, ERP components can be affected by cortical dysfunction in subjects either with or without notable cognitive deficits, but changes may not be specific to a particular neurologic or psychiatric disorder.
There were no significant group differences in behavioral measures, indicating ERP differences among groups are not secondary to different task demands. The 2 groups also did not differ in the clinical and cognitive screening tests used for dementia. Clearly neuropsychological tests would be needed for a comprehensive cognitive assessment. However, the absence of frank cognitive deficits in FAD subjects suggests that ERP measures were sensitive to the effects of specific gene mutations prior to the clinical expression of AD neuropathology. Note that the results were unaffected even when 2 subjects with somewhat low MMSE scores were removed. Discriminant analysis using ERP measures in the small subject pool of this study showed promising sensitivity (86%) and specificity (82%). The sensitivity and specificity results were comparable to studies using ERP8 and EEG measures27 in larger groups of MCI and sporadic AD subjects, although more FAD subjects would be needed for direct comparisons.
The pathology underlying delays in ERP latencies in persons with PSEN1 and APP mutations is uncertain. Decreases in whole brain and medial temporal lobe volume28 and hypometabolism in temporoparietal cortex29 have been reported to occur during the presymptomatic period in FAD. The relationship of these changes to ERP latencies, however, is unclear. Compromise of white matter tracts is another candidate mechanism for slowed cortical processing in FAD mutation carriers. Imaging of white matter integrity in FAD carriers using diffusion tensor MRI found decreased fractional anisotropy in FAD carriers vs noncarriers.30 Decreased fractional anisotropy was seen for total white matter and select regions of interest including the corpus callosum and connections of the medial temporal lobe, and has been related to decreased myelination or diffuse white matter damage. Given that the ERPs in this study originate in neocortex and are assumed to reflect coordinated activity among multiple cortical regions,26 we speculate that latency delays in FAD carriers may reflect, in part, white matter damage.
Previous studies of older subjects with MCI show that P50 amplitude and P300 latency distinguish MCI from controls,31,32 while N100 and P200 latencies did not differ. Increases in P300 latency are present in both amnestic MCI and FAD mutation carriers. Both amnestic MCI and FAD carriers have abnormal early auditory ERPs, but the specific components differed between groups (MCI and P50, FAD and P200). Amplitudes of the P50 and N100 are greater in amnestic MCI vs older controls,31,33 with the largest amplitudes in MCI subjects who later convert to dementia within 1–4 years.8 In the present study there was a small amplitude increase of an auditory ERP component in FAD carriers, but it was the P200 rather than P50 or N100. The group effect was attenuated somewhat by one noncarrier subject who had a very large P200 component (2.1 SD), but group differences were nonetheless significant at lateral sites. Unlike the findings in this smaller sample of FAD subjects, overall amplitudes and latencies of the P200 do not differ in amnestic MCI or AD relative to older controls.9,31
Factors such as the expected time until dementia, subject age, and disease processes may account for differences between ERP results in amnestic MCI and sporadic AD vs findings in FAD carriers in the current study. Auditory ERP differences in amnestic MCI were most apparent in those subjects who converted to AD within 4 years.8 In contrast, FAD mutation carriers in the current study would not be expected to have diagnosable dementia for more than a decade. Age may also be an important factor, as the impact of AD pathology and possible compensatory responses may differ in younger and older subjects. Although postmortem studies show similar results for FAD and sporadic AD, there are some neuropathologic differences.6 Thus differences in disease processes may contribute to ERP differences in amnestic MCI and sporadic AD vs FAD subjects.
Most of the subjects in this study were women. One prior study reported sex differences in P300 latency in older healthy controls that depended on APOE genotype.34 The ε4 allele is a risk factor for AD,35 but all subjects had normal scores on cognitive testing. In women, but not men, APOE ε4 genotype was associated with longer P300 latencies than subjects having only ε2/ ε3 alleles. Consequently, we caution against generalizing the results from this study to men.
AUTHOR CONTRIBUTIONS
Statistical analysis was conducted by Dr. E.J. Golob.
ACKNOWLEDGMENT
The authors thank Dr. Ilana J. Bennett for discussions of this project.
DISCLOSURE
Prof. Golob receives research support from the NIH [AG-019681, coinvestigator], the National Science Foundation [BCS-0844961, PI], and the Tulane Research Enhancement Fund. Dr. Ringman has served on a scientific advisory board for Akeso Health Sciences LLC; has received speaker honoraria from the Alzheimer’s Association, the Canadian Neurological Society, and the Los Angeles Neurological Society; and receives research support from Pfizer Inc., Elan Corporation, and the NIH Alzheimer’s Disease Center [AG16570, core leader]. Dr. Irimajiri received support from NIH [AG-019681, contributor]. S. Bright reports no disclosures. B. Schaffer has filed US Patent Application 20060051790 (Kind Code: A1, Filed 2005) and received research support from the NIH [AG019724, contributor], UCSF/Dean’s Retention Fund, UCSF/Chris and Robin Richards Donohoe Award, and from the Consortium for Frontotemporal Dementia. L.D. Medina received support from NIH [AG019724, contributor]. Dr. Starr has received travel expenses and/or honoraria for lectures or educational activities not funded by industry and receives research support from the NIH [AG-019681, PI].
Address correspondence and reprint requests to Dr. Edward J. Golob, Department of Psychology, 3067 Percival Stern Hall, Tulane University, New Orleans, LA 70118 egolob@tulane.edu
Supported by NIH grants AG019681, AG22228, AG21055, Alzheimer’s Disease Research Center Grant P50 AG16570, and General Clinical Research Centers Program M01-RR00865. Additional support from California DHS 04-35522 and an Alzheimer’s Disease Research Center of California grant, the Sidell Kagan Foundation, the Shirley and Jack Goldberg Trust, and the Easton Consortium for Drug and Biomarker Discovery in Alzheimer’s Disease.
Disclosure: Author disclosures are provided at the end of the article.
Received January 12, 2009. Accepted in final form August 11, 2009.
REFERENCES
- 1.Rossor M, Fox NC, Beck J, Campbell TC, Collinge J. Incomplete penetrance of familial Alzheimer’s disease in a pedigree with a novel presenilin-1 gene mutation. Lancet 1996;347:1560. [DOI] [PubMed] [Google Scholar]
- 2.Fox NC, Kennedy AM, Harvey RJ, et al. Clinicopathological features of familial Alzheimer’s disease associated with the M139V mutation in the presenilin 1 gene: pedigree but not mutation specific age at onset provides evidence for a further genetic factor. Brain 1997;120:491–501. [DOI] [PubMed] [Google Scholar]
- 3.Rogaev EI, Sherrington R, Rogaeva EA, et al. Familial Alzheimer’s disease in kindreds with missense mutations in a gene on chromosome 1 related to the Alzheimer’s disease type 3 gene. Nature 1995;376:775–778. [DOI] [PubMed] [Google Scholar]
- 4.Goate A, Chartier-Harlin MC, Mullan M, et al. Segregation of a missense mutation in the amyloid precursor protein gene with familial Alzheimer’s disease. Nature 1991;349:704–706. [DOI] [PubMed] [Google Scholar]
- 5.Lampe TH, Bird TD, Nochlin D, et al. Phenotype of chromosome 14-linked familial Alzheimer’s disease in a large kindred. Ann Neurol 1994;36:368–378. [DOI] [PubMed] [Google Scholar]
- 6.Lleo A, Berezovska O, Growdon JH, Hyman BT. Clinical, pathological, and biochemical spectrum of Alzheimer disease associated with PS-1 mutations. Am J Geriatr Psychiatry 2004;12:146–156. [DOI] [PubMed] [Google Scholar]
- 7.Arnold SE, Hyman BT, Flory J, Damasio AR, Van Hoesen GW. The topographical and neuroanatomical distribution of neurofibrillary tangles and neuritic plaques in the cerebral cortex of patients with Alzheimer’s disease. Cereb Cortex 1991;1:103–116. [DOI] [PubMed] [Google Scholar]
- 8.Golob EJ, Irimajiri R, Starr A. Auditory cortical activity in amnestic mild cognitive impairment: relationship to subtype and conversion to dementia. Brain 2007;130:740–752. [DOI] [PubMed] [Google Scholar]
- 9.Golob EJ, Starr A. Effects of stimulus sequence on event-related potentials and reaction time during target detection in Alzheimer’s disease. Clin Neurophysiol 2000;111: 1438–1449. [DOI] [PubMed] [Google Scholar]
- 10.Teng EL, Hasegawa K, Homma A, et al. The Cognitive Abilities Screening Instrument (CASI): a practical test for cross-cultural epidemiological studies of dementia. Int Psychogeriatr 1994;6:45–58; discussion 62. [DOI] [PubMed]
- 11.Morris JC. Clinical dementia rating: a reliable and valid diagnostic and staging measure for dementia of the Alzheimer type. Int Psychogeriatr 1997;9:173–176. [DOI] [PubMed] [Google Scholar]
- 12.Folstein MF, Folstein SE, McHugh PR. “Mini-mental state”: a practical method for grading the cognitive state of patients for the clinician. J Psychiatr Res 1975;12:189–198. [DOI] [PubMed] [Google Scholar]
- 13.Polich J. P300 clinical utility and control of variability. J Clin Neurophysiol 1998;15:14–33. [DOI] [PubMed] [Google Scholar]
- 14.Gratton G, Coles MG, Donchin E. A new method for off-line removal of ocular artifact. Electroencephalogr Clin Neurophysiol 1983;55:468–484. [DOI] [PubMed] [Google Scholar]
- 15.Nunez PL, Srinivasan R. Electric Fields of the Brain: The Neurophysics of EEG, 2nd ed. New York, NY: Oxford University Press; 2006. [Google Scholar]
- 16.Goodin DS, Squires KC, Starr A. Long latency event-related components of the auditory evoked potential in dementia. Brain 1978;101:635–648. [DOI] [PubMed] [Google Scholar]
- 17.Duncan CC, Kosmidis MH, Mirsky AF. Closed head injury-related information processing deficits: an event-related potential analysis. Int J Psychophysiol 2005;58:133–157. [DOI] [PubMed] [Google Scholar]
- 18.Newton MR, Barrett G, Callanan MM, Towell AD. Cognitive event-related potentials in multiple sclerosis. Brain 1989;112:1637–1660. [DOI] [PubMed] [Google Scholar]
- 19.Patterson JV, Michalewski HJ, Starr A. Latency variability of the components of auditory event-related potentials to infrequent stimuli in aging, Alzheimer-type dementia, and depression. Electroencephalogr Clin Neurophysiol 1988;71:450–460. [DOI] [PubMed] [Google Scholar]
- 20.Bennys K, Portet F, Touchon J, Rondouin G. Diagnostic value of event-related evoked potentials N200 and P300 subcomponents in early diagnosis of Alzheimer’s disease and mild cognitive impairment. J Clin Neurophysiol 2007;24:405–412. [DOI] [PubMed] [Google Scholar]
- 21.Polich J. Updating P300: an integrative theory of P3a and P3b. Clin Neurophysiol 2007;118:2128–2148. [DOI] [PMC free article] [PubMed] [Google Scholar]
- 22.Starr A, Golob EJ. Cognitive factors modulating auditory cortical potentials. In: Burkard R, Don M, Eggermont JJ, eds. Auditory Evoked Potentials: Basic Principles and Clinical Application. Philadelphia: Lippincott Williams & Wilkins; 2006:508–525. [Google Scholar]
- 23.Crowley KE, Colrain IM. A review of the evidence for P2 being an independent component process: age, sleep and modality. Clin Neurophysiol 2004;115:732–744. [DOI] [PubMed] [Google Scholar]
- 24.Reite M, Teale P, Zimmerman J, Davis K, Whalen J. Source location of a 50 msec latency auditory evoked field component. Electroencephalogr Clin Neurophysiol 1988;70:490–498. [DOI] [PubMed] [Google Scholar]
- 25.Liegeois-Chauvel C, Musolino A, Badier JM, Marquis P, Chauvel P. Evoked potentials recorded from the auditory cortex in man: evaluation and topography of the middle latency components. Electroencephalogr Clin Neurophysiol 1994;92:204–214. [DOI] [PubMed] [Google Scholar]
- 26.Halgren E, Marinkovic K, Chauvel P. Generators of the late cognitive potentials in auditory and visual oddball tasks. Electroencephalogr Clin Neurophysiol 1998;106:156–164. [DOI] [PubMed] [Google Scholar]
- 27.Rossini PM, Buscema M, Capriotti M, et al. Is it possible to automatically distinguish resting EEG data of normal elderly vs. mild cognitive impairment subjects with high degree of accuracy? Clin Neurophysiol 2008;119:1534–1545. [DOI] [PubMed] [Google Scholar]
- 28.Schott JM, Fox NC, Frost C, et al. Assessing the onset of structural change in familial Alzheimer’s disease. Ann Neurol 2003;53:181–188. [DOI] [PubMed] [Google Scholar]
- 29.Kennedy AM, Frackowiak RS, Newman SK, et al. Deficits in cerebral glucose metabolism demonstrated by positron emission tomography in individuals at risk of familial Alzheimer’s disease. Neurosci Lett 1995;186:17–20. [DOI] [PubMed] [Google Scholar]
- 30.Ringman JM, O’Neill J, Geschwind D, et al. Diffusion tensor imaging in preclinical and presymptomatic carriers of familial Alzheimer’s disease mutations. Brain 2007;130:1767–1776. [DOI] [PubMed] [Google Scholar]
- 31.Golob EJ, Johnson JK, Starr A. Auditory event-related potentials during target detection are abnormal in mild cognitive impairment. Clin Neurophysiol 2002;113:151–161. [DOI] [PubMed] [Google Scholar]
- 32.Frodl T, Hampel H, Juckel G, et al. Value of event-related P300 subcomponents in the clinical diagnosis of mild cognitive impairment and Alzheimer’s disease. Psychophysiology 2002;39:175–181. [DOI] [PubMed] [Google Scholar]
- 33.Irimajiri R, Golob EJ, Starr A. Auditory brainstem, middle- and long-latency evoked potentials in mild cognitive impairment. Clin Electroencephalogr 2005;116: 1918–1929. [DOI] [PubMed] [Google Scholar]
- 34.Irimajiri R, Golob EJ, Starr A. ApoE genotype and auditory cortical sensory and cognitive potentials in healthy older females. Neurobiol Aging (in press 2009). [DOI] [PubMed]
- 35.Poirier J, Davignon J, Bouthillier D, Kogan S, Bertrand P, Gauthier S. Apolipoprotein E polymorphism and Alzheimer’s disease. Lancet 1993;342:697–699. [DOI] [PubMed] [Google Scholar]


