Abstract
We investigated the interrelations between C4 ketogenesis (production of β-hydroxybutyrate + acetoacetate), C5 ketogenesis (production of β-hydroxypentanoate + β-ketopentanoate), and anaplerosis in isolated rat livers perfused with 13C-labeled octanoate, heptanoate, or propionate. Mass isotopomer analysis of C4 and C5 ketone bodies and of related acyl-CoA esters reveal that C4 and C5 ketogenesis share the same pool of acetyl-CoA. Although the uptake of octanoate and heptanoate by the liver are similar, the rate of C5 ketogenesis from heptanoate is much lower than the rate of C4 ketogenesis from octanoate. This results from the channeling of the propionyl moiety of heptanoate into anaplerosis of the citric acid cycle. C5 ketogenesis from propionate is virtually nil because acetoacyl-CoA thiolase does not favor the formation of β-ketopentanoyl-CoA from propionyl-CoA and acetyl-CoA. Anaplerosis and gluconeogenesis from heptanoate are inhibited by octanoate. The data have implications for the design of diets for the treatment of long chain fatty acid oxidation disorders, such as the triheptanoin-based diet.
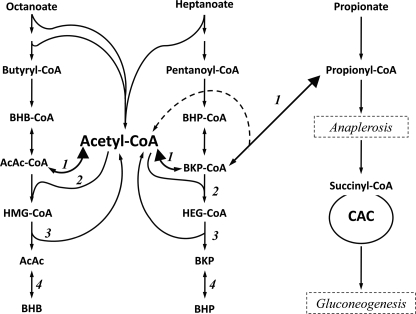
The regulation of the metabolism of C4 ketone bodies, i.e. β-hydroxybutyrate (BHB)2 and acetoacetate (AcAc) has been extensively investigated in vivo in isolated livers, hepatocytes, and subcellular preparations (for reviews, see Refs. 1–4). In contrast, very little information is available on the metabolism of C5 ketone bodies, i.e. β-hydroxypentanoate (BHP) and β-ketopentanoate (BKP), which are known in the clinical literature as 3-hydroxyvalerate and 3-ketovalerate (5, 6). The C5 ketone bodies are formed in liver from the partial oxidation of odd-chain fatty acids (see Fig. 1, center column). C5 ketogenesis uses the same enzymes of the 3-hydroxy-3-methylglutaryl-CoA (HMG-CoA) cycle as C4 ketogenesis. The counterpart of HMG-CoA in C5 ketogenesis is 3-hydroxy-3-ethylglutaryl-CoA (HEG-CoA). We only found one report on the formation of [14C]HEG-CoA in liver extract incubated with propionyl-CoA and [1-14C]acetyl-CoA (7).
FIGURE 1.
Scheme of C4 ketogenesis and C5 ketogenesis in the liver. Numbers refer to the following enzymes: 3-ketoacyl-CoA thiolase (1), HMG-CoA synthase (2), HMG-CoA lyase (3), and β-hydroxybutyrate dehydrogenase (4). The figure also shows the link between propionyl-CoA and the CAC via anaplerosis.
Because odd-chain fatty acids are absent from the diet of non-ruminant mammals, body fluids contain only traces of C5 ketone bodies. However, C5 ketone bodies and hydroxyethylglutarate are found in body fluids of patients with disorders of the anaplerotic pathway, propionyl-CoA → methylmalonyl- CoA → succinyl-CoA, such as deficiency in propionyl-CoA carboxylase and methylmalonyl-CoA mutase as well as biotin or vitamin B12 deficiency (5, 6, 8). The formation of C5 ketone bodies in these pathological states involves either the conversion of propionyl-CoA to BKP-CoA via 3-ketoacyl-CoA thiolase (Fig. 1, reaction 1) or the β-oxidation of odd-chain fatty acids synthesized in these patients (9) using propionyl-CoA as a primer (10).
Like their C4 counterparts, the C5 ketone bodies are interconverted by mitochondrial BHB dehydrogenase (11). In peripheral tissues, C5 ketone bodies are converted to propionyl-CoA (which is anaplerotic) + acetyl-CoA via 3-oxoacid-CoA transferase (12) and 3-ketoacyl-CoA thiolase. Peripheral tissues have a high capacity to utilize exogenous C5 ketone bodies (13), especially heart, kidney, and brain, which have high activities of 3-oxoacid-CoA transferase (14, 15).
Our interest in C5 ketone body metabolism arose from an ongoing clinical trial where patients with long chain fatty acid oxidation disorders are treated with a diet containing triheptanoin (16, 17) instead of the classical treatment with the even-chain triglyceride trioctanoin. These patients suffer from muscle weakness and rhabdomyolysis, manifested by the release of creatine kinase in plasma. It was hypothesized that the accumulation of long chain acyl-CoAs and long chain acylcarnitines results in membrane damage with release of large and small molecules from cells. The leakage of small molecules would deplete intermediates of the citric acid cycle (CAC) which carry acetyl groups as they are oxidized. It was further hypothesized that boosting anaplerosis with a suitable substrate would compensate for the chronic cataplerosis and improve heart and muscle function. The catabolism of heptanoate yields propionyl-CoA, which can be used for anaplerosis in most tissues, and C5 ketone bodies in liver. C5 ketone bodies are converted to propionyl-CoA, which can be used for anaplerosis in peripheral tissues. The marked improvement of the patients' conditions after switching from a trioctanoin- to a triheptanoin-based diet supported the hypothesis.
After ingestion of meals containing triheptanoin as the only lipid component, both C5 ketone bodies and C4 ketone bodies accumulated in the plasma of patients that have been diagnosed with disorders of long chain fatty acid oxidation (16). This suggested that acetyl groups derived from heptanoate can be used for the synthesis of C4 and C5 ketone bodies. Alternatively, the accumulation of C4 ketone bodies after triheptanoin ingestion might result from the inhibition of the utilization of C4 ketone bodies in peripheral tissues by C5 ketone bodies.
The aim of the present study was to investigate the interaction between C4 and C5 ketogenesis in rat livers perfused with octanoate and/or heptanoate. To gain insight on the fates of the acetyl groups of both fatty acids and on the fate of the propionyl-CoA moiety of heptanoate, we conducted the experiments with a series of labeled substrates: [1-13C]octanoate, [8-13C]octanoate, [5,6,7-13C3]heptanoate, [1-13C]heptanoate, and [13C3]propionate. The outcome of the propionyl-CoA moiety of [5,6,7-13C3]heptanoate and [13C3]propionate was traced by measurements of anaplerosis and glucose labeling by mass isotopomer3 analysis (18). In previous studies on the metabolism of odd-chain fatty acids in liver or hepatocytes (19, 20), ketone bodies were assayed with BHB dehydrogenase. This assay does not differentiate C4 from C5 ketone bodies. In the present study we used gas chromatography-mass spectrometry to specifically assay C4 and C5 ketone bodies (13).
EXPERIMENTAL PROCEDURES
Materials
General chemicals were purchased from Sigma-Aldrich: [13C3]propionic, [2H5]propionic, [1-13C]octanoic, [8-13C]octanoic, [2H15]octanoic, [2H13]heptanoic, and [5,6,7-13C3]heptanoic acids. 2H2O (99%), NaO2H, and 13CO2 gas were obtained from Isotec. [1-13C]Heptanoic acid was prepared by reacting hexylmagnesium bromide with 13CO2. The purity of the vacuum-distilled product was assessed by gas chromatography-mass spectrometry and NMR. Internal standards of β-hydroxy-[2,2,3,4,4,4-2H6]butyrate and R,S-β-hydroxy-[2,2,3,4,4-2H5]pentanoate were prepared (13, 21) by (i) incubating ethyl acetoacetate or ethyl β-ketopentanoate in 2H2O + NaO2H overnight, (ii) reacting with NaB2H4, (iii) acidifying to destroy excess NaB2H4, and (iv) neutralization and lyophilization. β-Hydroxypentanoate was prepared by overnight hydrolysis of the ethyl ester with 1.1 eq of NaOH followed by neutralization and lyophilization. Reagents for trimethylsilyl and tert-butyldimethylsilyl derivatization were purchased from Pierce.
Liver Perfusion Experiments
Male Sprague-Dawley rats (130–140g) were fed ad libitum for 8–12 days with standard laboratory chow. Livers from overnight-fasted rats were perfused with non-recirculating bicarbonate buffer (30 ml/min) and 4 mm glucose containing 0 to 1 mm of either a single fatty acid ([1-13C]octanoate, [8-13C]octanoate, [5,6,7-13C3]heptanoate, or [13C3]propionate) or (1 mm octanoate + 0–1 mm heptanoate (or vice versa)) with different labeling patterns. At 14 and 18.5 min, samples of influent and effluent perfusate (collected over 1 min) were treated with NaB2H4 and frozen. This procedure stabilizes the unstable keto acids by converting them to stable monodeuterated hydroxy acids (13, 21). Other samples of perfusate were frozen without treatment. After 20 min the livers were quick-frozen and kept in liquid nitrogen until analysis.
Analytical Procedures
To assay the uptake of fatty acids and the production of C4 and C5 ketone bodies, 0.1-ml samples of NaB2H4-treated perfusate (influent and effluent) were (i) spiked with internal standards (30 nmol of [2H13]heptanoate, 30 nmol of [2H15]octanoate, 50 nmol of [2H5] propionate, 45 nmol of β-hydroxy-[2H6]butyrate, and 34 nmol of β-hydroxy-[2H5]pentanoate), (ii) acidified (to destroy excess NaB2H4), and (iii) deproteinized with 0.7 ml of acetonitrile/methanol (7:3). Supernatants from samples from experiments with octanoate and/or heptanoate were dried with N2, and the residue was treated to form the trimethylsilyl derivatives of the analytes. Supernatants from samples from experiments with propionate were dried with N2, and the residue was treated to form the tert-butyldimethylsilyl derivatives of the analytes. The treatment of the samples with NaB2H4 prevents assaying the individual concentrations of the labeled C4 ketone bodies (BHB and AcAc) and C5 ketone bodies (BHP and BKP) because of overlapping of some mass isotopomers. Therefore, the data of this assay yield total concentrations of C4 or C5 ketone bodies (13, 21).
For the assay of the labeling pattern of individual C4 and C5 ketone bodies, 0.5-ml samples of effluent perfusate (not treated with NaB2H4) were incubated with 50 μmol of methoxylamine-HCl (adjusted to pH 9) and incubated at 60 °C for 40 min. After acidifying with HCl to pH 1, the samples were extracted 3 times with 5 ml of diethyl ether. The combined extracts were dried with N2, and the residue was treated to form the tert-butyldimethylsilyl derivatives of the ketone bodies. Gas chromatography-mass spectrometry assay under electron ionization conditions yielded the mass isotopomer distribution of the total C4 and C5 ketone body molecules and the fragments corresponding to C-3 + 4 of C4 ketone bodies and C-3 + 4 + 5 of C5 ketone bodies (13, 21). Labeling of glucose was assayed on the penta-acetate derivative.
For the assay of the mass isotopomer distribution of acyl-CoA esters, 250 mg of frozen liver powder was extracted with 4 ml of methanol/H2O (1:1) containing 5% acetic acid. After a 1-min extraction at 0 °C with a Polytron and centrifugation at 8000 × g for 30 min at 4 °C, the supernatant was run through a solid phase extraction ion exchange cartridge packed with 300 mg of 2–2(pyridyl)ethyl silica gel (Sigma-Aldrich). The cartridge was preactivated with 3 ml of methanol followed by 3 ml of methanol/H2O (1:1) containing 5% acetic acid. After washing the cartridge with 3 ml of methanol/H2O (1:1) containing 5% acetic acid, the acyl-CoA esters were eluted out by (i) 3 ml of methanol/H2O (1:1) containing 50 mm ammonium formate, (ii) 3 ml methanol/H2O (3:1) containing 50 mm ammonium formate, and (iii) 3 ml of methanol. The combined effluent was dried under N2, and the residue was stored at −80 °C until liquid chromatography-mass spectrometry analysis.
Liquid Chromatography-Mass Spectrometry Assays
After dissolving the acyl-CoAs in 100 μl of high performance liquid chromatography buffer A (5% acetonitrile in 100 mm ammonium formate, pH 5.0), 10 μl of solution was injected on a Thermo Electron Hypersil Gold column (C18, 100 × 2.1 mm, 3-μm particle size) protected by a guard column (Hypersil Gold, C18, 10 × 2.1 mm, 3-μm particle size). Gradient elution at a constant flow rate of 0.2 ml/min was (i) 98% buffer A + 2% buffer B (5 mm ammonium formate in 95% acetonitrile) for 7 min, (ii) 2 to 60% B from 7 to 25 min, (iii) 60 to 90% B from 25 to 26 min, (iv) 90% B from 26 to 30 min, and (v) re-equilibration with initial buffer for 9 min before next injection. The order of acyl-CoA elution was malonyl-CoA (2.2 min), methylmalonyl-CoA (2.7 min), succinyl-CoA (3.5 min), HMG-CoA (3.9 min), acetyl-CoA (6.7 min), AcAc-CoA (6.9 min), BHB-CoA (8.1 min), HEG-CoA (9.1 min), BKP-CoA (14.0 min), propionyl-CoA (14.2 min), BHP-CoA (14.4 min), pentanoyl-CoA (17.7 min), hexanoyl-CoA (19.5 min), heptanoyl-CoA (20.9 min), and octanoyl-CoA (22.2 min).
The liquid chromatograph was coupled to a 4000 QTrap mass spectrometer (Applied Biosystems, Foster City, CA) operated under positive electrospray ionization mode with the following parameters; the source temperature was set at 600 °C with gas 1 and gas 2 at 65 and 55 p.s.i., respectively. The curtain gas was at 30 p.s.i., and the collision-activated dissociation gas pressure was held at high. The turbo ion-spray voltage, declustering potential, entrance potential, and collision cell exit potential were 4500, 70, 10, and 50 V, respectively. Multiple reaction monitoring mode was used for quantitation and isotope enrichment analysis. The analyst software (Version 1.4.2, Applied Biosystems) was used for data collection and analysis.
Calculations
Correction of measured mass isotopomer distributions for natural enrichment was performed using the CORMAT software (22). Relative rates of anaplerosis from [13C3]propionyl-CoA precursors ([13C3]propionate, [5,6,7-13C3]heptanoate) were calculated (18) as the ratio (m3 succinyl-CoA)/(m3 propionyl-CoA). These ratios refer to the contribution of the anaplerotic substrates to the catalytic intermediates of the CAC, which carry acetyl units as they are oxidized. Note that when label enters the CAC only via propionyl-CoA, M3 succinyl-CoA is only formed from the sequence M3 propionyl-CoA → M3 methylmalonyl-CoA → M3 succinyl-CoA (recycling of label in the CAC cannot form M3 succinyl-CoA).
In experiments with [1-13C]octanoate or [8-13C]octanoate, the distribution of label between the two acetyl of C4 ketone bodies was calculated using (i) the m1 and m2 enrichments of the whole BHB molecule, and (ii) the m1 enrichment of the C-3 + 4 fragment of BHB. The m1 enrichment of the C-1 + 2 acetyl of BHB was calculated as: m1 of C-1 + 2 = [(2m2 + m1) of C-1 → 4] − (m1 of C-3 + 4).
Data Presentation and Statistics
Herein, we present data from ∼70 liver perfusion experiments. For each of the conditions chosen, we ran six perfusions in the presence of selected unlabeled or 13C-labeled substrate(s) with the concentration parameters being allowed to vary. The data points shown in the figures represent means of duplicate gas chromatography-mass spectrometry or liquid chromatography-mass spectrometry injections, which differed by <2%. The statistical differences between some profiles were tested using a paired t test (Graph Pad Prism Software, Version 3).
RESULTS AND DISCUSSION
Relationship between the Uptake of C8, C7, and C4 Fatty Acids and the Formation of C4 and C5 Ketone Bodies
Fig. 2A shows the uptake of octanoate and its conversion to C4 ketone bodies. Because 1 molecule of octanoate can yield up to two molecules of C4 ketone bodies, the yield of C4 ketogenesis from exogenous octanoate ranged from 80 to 90%. This calculation assumes that basal C4 ketogenesis at zero octanoate concentration was not inhibited by increasing concentrations of octanoate. Similar data were reported by McGarry and Foster (23). Fig. 2B shows the uptake of heptanoate and its conversion to both C5- and C4 ketone bodies. The uptake of heptanoate (Fig. 2B) was very similar to the uptake of octanoate (Fig. 2A). Because the oxidation of 1 molecule of heptanoate yields 1 molecule of propionyl-CoA and 2 molecules of acetyl-CoA, one calculates that (i) only about 40% of the propionyl moiety of heptanoate was converted to C5 ketone bodies, and (ii) about 75% of the acetyl moiety of heptanoate was converted to C5- and C4 ketone bodies. Thus, as outlined in Fig. 1, acetyl-CoA derived from heptanoate seems to be used to form both C5- and C4 ketone bodies. This will be confirmed by the labeling data presented below. The low yield of conversion of the propionyl moiety of heptanoate to C5 ketone bodies results from its diversion to anaplerosis and gluconeogenesis (Fig. 1) as will be shown below.
FIGURE 2.
Comparison between the uptake of octanoate (A), heptanoate (B), or propionate (C) and the production of C4 ketone bodies (β-hydroxybutyrate + acetoacetate) and C4 ketone bodies (β-hydroxypentanoate + β-ketopentanoate). ●, fatty acid uptake; ■, C4 ketogenesis; ▴, C5 ketogenesis). A, no C5 ketone bodies were detected in the presence of octanoate. A, B, C, n = 6 at zero concentration of influent fatty acid; n = 1 for the other concentrations. All liver perfusions reported in this manuscript were conducted for 20 min. All rates of substrate uptake and production (Figs. 2–5) were assayed on samples of influent and effluent perfusate taken at 14 and 18.5 min (collecting the samples over 1 min). All reported values are the means of the 14- and 18.5-min measurements.
Fig. 2C shows the uptake of propionate and the release of C5- and C4 ketone bodies. The yield of C5 ketogenesis from propionate was extremely low (about 0.1%). The much lower yield of C5 ketogenesis from propionate compared with heptanoate (Fig. 2B) reflects the properties of 3-ketoacyl-CoA thiolase (Fig. 1, reaction 1), which had been described for the interconversion of AcAc-CoA and acetyl-CoA by this enzyme (24–27). Although the thiolase reaction is reversible in vitro, its kinetic properties prevent the formation of AcAc-CoA from acetyl-CoA. This explains why C4 ketogenesis cannot be fueled by acetyl-CoA derived from glucose metabolism. The virtually nil C5 ketogenesis from propionate demonstrates that in the intact liver thiolase does not allow the formation of BKP-CoA from propionyl-CoA + acetyl-CoA. In contrast, thiolase allows the cleavage of BKP-CoA derived from heptanoate to propionyl-CoA + acetyl-CoA. Fig. 2C also shows that propionate inhibits C4 ketogenesis from endogenous fatty acids, as reported by Brass and Beyerinck (20).
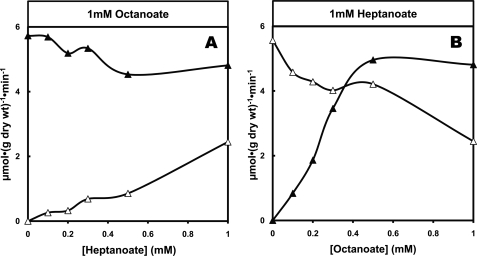
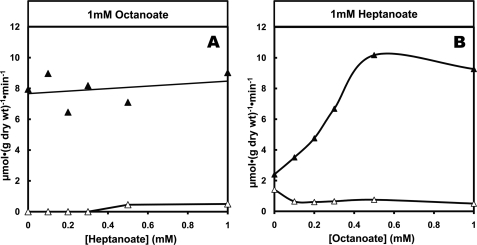
To test the interaction between the uptakes of octanoate and heptanoate as well as the formation of C4 and C5 ketone bodies, we perfused livers with 1 mm concentrations of one fatty acid and increasing concentrations of the second fatty acid and vice versa (Figs. 3 and 4). Figs. 3, A and B, show that, starting with similar uptakes of 1 mm octanoate or heptanoate alone, the effects of octanoate on heptanoate metabolism are different from the effects of heptanoate on octanoate metabolism. The competition favors octanoate uptake over heptanoate uptake (Figs. 3, A and B; p < 0.05 for both comparisons). Fig. 4A shows that when increasing concentrations of heptanoate are added to a constant 1 mm octanoate, the production of C4 ketone bodies was not inhibited (slope was not significantly different from zero). Also, the production of C5 ketone bodies was much lower than in the presence of heptanoate alone (Fig. 2B). Fig. 4B shows that when increasing concentrations of octanoate were added to a constant 1 mm heptanoate, the production of C4 ketone bodies increased markedly, almost as much as in the presence of octanoate alone (Fig. 2A). Furthermore, the production of C5 ketone bodies from heptanoate decreased compared with what occurred in the presence of 1 mm heptanoate alone (Fig. 2B).
FIGURE 3.
Competition between octanoate and heptanoate for uptake by perfused rat livers. A, constant 1 mm octanoate + increasing heptanoate concentration in influent perfusate. B, constant 1 mm heptanoate + increasing octanoate concentration in influent perfusate. The vertical scale shows the uptake of octanoate (▴) and heptanoate (▵).
FIGURE 4.
Competition between C4 ketogenesis from octanoate and C5 ketogenesis from heptanoate in perfused rat livers. A, constant 1 mm octanoate + increasing heptanoate concentration in influent perfusate. B, constant 1 mm heptanoate + increasing octanoate concentration in influent perfusate. The vertical scale shows the production of C4 ketone bodies (▴) and C5 ketone bodies (▵).
Labeling of Ketone Bodies
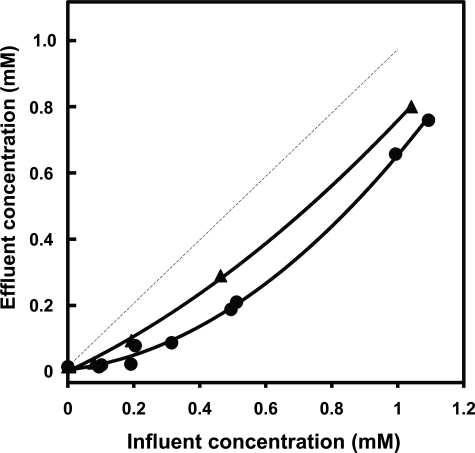
Before presenting the labeling pattern of C4 and C5 ketone bodies labeled from [13C]octanoate or/and [13C]heptanoate, we want to stress that the interpretation of the data must take into account (i) the concept of zonation of liver metabolism (28) and (ii) the factors that influence the distribution of label between the two acetyl moieties of C4 ketone bodies. First, Fig. 5 shows that at low influent concentrations of octanoate (up to 0.2 mm), almost no substrate left the liver in the effluent perfusate. In perfusions with increasing concentrations of heptanoate, the profile of effluent heptanoate concentrations (not shown) was identical to what was measured in perfusions with octanoate. Under these conditions, the pericentral cells of the liver lobule were in contact with much lower octanoate or heptanoate concentrations than the periportal cells. The zonation of propionate concentrations (Fig. 5, upper curve) was less pronounced than in perfusions with octanoate, but the profiles were not significantly different. Second, the distribution of label between the two acetyl moieties of C4 ketone bodies depends on whether label enters the HMG-CoA cycle as acetyl-CoA or as the C-3 + 4 moiety of AcAc-CoA (Fig. 1). The latter is formed in one of the final steps of fatty acid β-oxidation. Hüth et al. (25) has shown that in the reversible reaction catalyzed by 3-ketoacyl-CoA thiolase (AcAc-CoA + CoA ↔ 2 acetyl-CoA (Fig. 1 (left side), reaction 1), the C-3 + 4 moiety of AcAc-CoA exchanges much more slowly with the free acetyl-CoA pool than its C-1 + 2 moiety.
FIGURE 5.
Profile of concentrations of octanoate (●) and propionate (▴) in the effluent perfusate. The data refer to perfusions with increasing concentrations of a single fatty acid and are plotted as a function of the influent concentration of each fatty acid. The dotted line is the theoretical identity of influent and effluent concentrations.
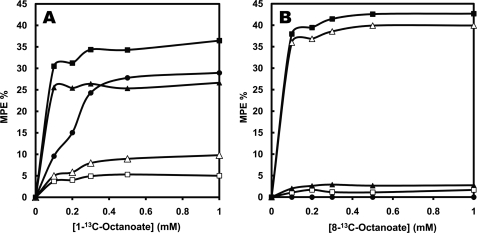
For livers perfused with increasing concentrations of [1-13C]octanoate or [8-13C]octanoate, Figs. 6, A and B, show the labeling of BHB, its acetyl moieties, and liver acetyl-CoA. We calculated the distribution of label between the two acetyl moieties of C4 ketone bodies from the electron ionization mass spectrum of the TBDMS derivative of BHB, which includes ions corresponding to carbons 1–4 and carbons 3 and 4 of BHB (21). The two acetyl moieties of BHB had very different labeling. In the presence of [1-13C]octanoate, most of the label of BHB was on the C-1 + 2 acetyl, with relatively little label on the C-3 + 4 acetyl (Fig. 6A). The opposite labeling pattern of BHB was observed in perfusions with [8-13C]octanoate, where 90% of the BHB labeling was on the C-3 + 4 acetyl, the labeling of which plateaued at 37%. This results from the fact that the C-3 + 4 acetyl of BHB derives from the C-7 + 8 acetyl of octanoate via the C-3 + 4 acetyl of AcAc-CoA. Because the C-3 + 4 acetyl of AcAc-CoA exchanges poorly with the free acetyl-CoA pool, the two acetyl moieties of BHB have very unequal labeling.
FIGURE 6.
Labeling pattern of effluent BHB and tissue acetyl-CoA from livers perfused with increasing concentrations of [1-13C]octanoate (A) or [8-13C]octanoate (B). The figures show the molar percent enrichments (MPE) of the M1 (■) and M2 (□) mass isotopomers of BHB, the MPE of the C-1 + 2 (▴) and C-3 + 4 (▵) acetyls of BHB, and the MPE of liver acetyl-CoA (●). The labeling patterns of ketone bodies (Figs. 6 and 7) were assayed in samples of effluent perfusate taken at 14 and 18.5 min (collecting the samples over 1 min). All reported values are the means of the 14 and 18.5 min measurements.
Katz (29) suggests that the labeling of C-1 + 2 of BHB could be taken as a proxy, i.e. an indicator, of that of liver mitochondrial acetyl-CoA. Fig. 6A shows that in the presence of [1-13C]octanoate, the enrichment of acetyl-CoA plateaued close to 25%, which is the maximal possible enrichment because [1-13C]octanoate was labeled on only one acetyl moiety. At high [1-13C]octanoate concentrations, the labeling of acetyl-CoA and of the C-1 + 2 acetyl of BHB were very close. However, at low [1-13C]octanoate concentrations (0.1–0.2 mm), the C-1 + 2 acetyl of BHB was much more labeled than acetyl-CoA. There are two possible explanations of this discrepancy: metabolic zonation (28) and/or metabolic channeling (30). First, in livers perfused with 0.1–0.2 mm [1-13C]octanoate, the pericentral cells of the liver lobule were in contact with perfusate containing little or no labeled octanoate, as inferred from the very low concentration of octanoate in the effluent perfusate (Fig. 5). In the pericentral cells, acetyl-CoA was unlabeled or minimally labeled. Thus, when acetyl-CoA was assayed in a total liver extract, its enrichment was a composite of labeled periportal and unlabeled pericentral acetyl-CoA. Moreover, because ketogenesis predominates in the periportal cells, there were few unlabeled ketone bodies produced in the pericentral cells, thus little dilution of the ketone bodies in the total liver extract. Second, metabolic channeling transfers labeled acetyl-CoA derived from fatty acid oxidation directly to the HMG-CoA cycle without equilibration with the total pool of mitochondrial acetyl-CoA. We previously showed (31) that in livers perfused with 0.2 mm [1-13C]octanoate, the labeling of the C1 + 2 moiety of BHB is greater than that of the acetyl moiety of citrate (a proxy of mitochondrial acetyl-CoA).
In the perfusions with [8-13C]octanoate (Fig. 6B), the enrichment of the C-1 + 2 acetyl of BHB was greater than the almost nil enrichment of acetyl-CoA (p = 0.0005). This is a consequence of the poor equilibration of label between [4-13C]AcAc-CoA derived from [8-13C]octanoate and free acetyl-CoA via thiolase. Therefore, the labeling of the C1 + 2 acetyl of BHB cannot in most case be used as a proxy of the labeling of mitochondrial acetyl-CoA.
C4 Ketogenesis and C5 Ketogenesis Share a Pool of Acetyl-CoA
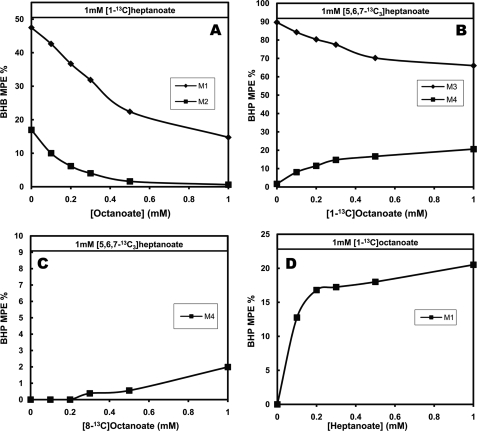
The labeling pattern of ketone bodies, HMG-CoA and HEG-CoA shows that when octanoate and heptanoate are used by the liver, acetyl-CoA derived from each substrate is available to both C4 and C5 ketogenesis. Consider the labeling of ketone bodies. First, in liver perfused with [1-13C]heptanoate alone (Fig. 7A, left side), BHB was M1- and M2-labeled. Therefore, labeled acetyl-CoA derived from [1-13C]heptanoate was incorporated into C4 ketone bodies. As increasing concentrations of unlabeled octanoate were added to 1 mm [1-13C]heptanoate, the M1 and M2 enrichments of BHB decreased, as expected. Second, in livers perfused with 1 mm [5,6,7-13C3]heptanoate alone (left side of Fig. 7B), BHP was only M3-labeled, as expected. When increasing concentrations of [1-13C]octanoate were added to [5,6,7-13C3]heptanoate, BHP became up to 20% M4-labeled, whereas M3 labeling decreased from 90 to 70% (Fig. 7B). Thus, in this experiment, M4 BHP was formed from a M3 propionyl-CoA derived from [5,6,7-13C3]heptanoate and an M1-acetyl-CoA derived from [1-13C]octanoate. However, when increasing concentrations of [8-13C]octanoate were added to 1 mm [5,6,7-13C3]heptanoate (Fig. 7C), the M4 labeling of BHP was very low (up to 2%), whereas the M3 enrichment of BHP barely decreased from 90% (not shown). This is because [8-13C]octanoate does not substantially label acetyl-CoA, as mentioned above (Fig. 6B). Third, in perfusions with constant 1 mm [1-13C]octanoate and increasing concentrations of unlabeled heptanoate, M1 BHP did accumulate (Fig. 7D). This M1 BHP was formed from unlabeled propionyl (derived from heptanoate) and M1 acetyl-CoA (derived from [1-13C]octanoate). These three set of experiments show that C4 and C5 ketogenesis share the same acetyl-CoA pool (Fig. 1).
FIGURE 7.
Sharing of acetyl groups between C4 and C5 ketogenesis reflected by the mass isotopomer distribution of BHB and BHP. A, labeling pattern of BHB in perfusions with constant 1 mm [1-13C]heptanoate + increasing concentrations of unlabeled octanoate. B, labeling pattern of BHP in perfusions with constant [5,6,7-13C3]heptanoate and increasing concentrations of [1-13C]octanoate. C, labeling pattern of BHP in perfusions with constant [5,6,7-13C3]heptanoate and increasing concentrations of [8-13C]octanoate. D, labeling pattern of BHP in perfusions with constant [1-13C]octanoate and increasing concentrations of unlabeled heptanoate.
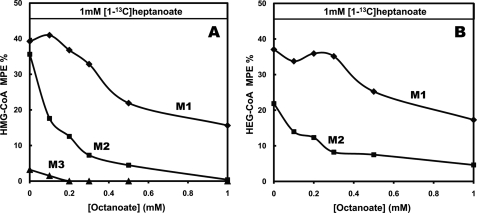
Consider now the labeling patterns of HMG-CoA (Fig. 8A) and HEG-CoA (Fig. 8B). In liver perfused only with [1-13C]heptanoate (Fig. 8, A and B, at zero substrate concentration), HMG-CoA was M1-, M2-, and M3-labeled, whereas HEG-CoA was M1- and M2-labeled. The M1 and M2 enrichments of HMG-CoA were not significantly different from the corresponding enrichments of HEG-CoA. This also indicates that the syntheses of HMG-CoA and HEG-CoA share the same pool of acetyl-CoA, in this case ([1-13C]acetyl-CoA derived from [1-13C]heptanoate). As increasing concentrations of unlabeled octanoate were added to the 1 mm [1-13C]heptanoate, the enrichments of (i) the M1, M2, and M3 isotopomers of HMG-CoA and (ii) M1 and M2 isotopomers of HEG-CoA decreased. This demonstrates that HMG-CoA synthesis can use acetyl-CoA derived from heptanoate oxidation and that HEG-CoA synthesis can use acetyl-CoA derived from octanoate oxidation. This does confirm that acetyl-CoA derived from octanoate oxidation was used for C5 ketogenesis.
FIGURE 8.
Mass isotopomer distribution of HMG-CoA (A) and HEG-CoA (B) in livers perfused with constant 1 mm [1-13C]heptanoate and increasing concentrations of unlabeled octanoate.
Reversibility of the BHB-CoA Dehydrogenase Reaction
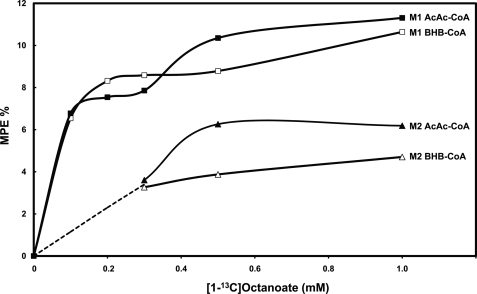
When [1-13C]octanoate undergoes β-oxidation, carbons 5–8 of octanoate (which will go to BHB-CoA and AcAc-CoA) are initially unlabeled. Although as predicted, hexanoyl-CoA and butyryl-CoA were unlabeled (not shown), BHB-CoA and AcAc-CoA were M1- and M2-labeled (Fig. 9). The labeling of AcAc-CoA results from the partial isotopic equilibration of AcAc-CoA and acetyl-CoA via 3-ketoacyl-CoA thiolase (Fig. 1, reaction 1). The M1 and M2 labeling of BHB-CoA (Fig. 9) shows that the BHB-CoA dehydrogenase reaction is reversible in the intact liver despite the high rate of β-oxidation. A similar equilibration occurs in the catabolism of [1-13C]heptanoate. In one perfusion with 1 mm [1-13C]heptanoate, although pentanoyl-CoA was unlabeled, BHP-CoA and acetyl-CoA were 12.7 and 40% M1-labeled, respectively (BKP-CoA was undetectable).
FIGURE 9.
Mass isotopomer distribution of BHB-CoA and AcAc-CoA in livers perfused with increasing concentrations of [1-13C]octanoate.
Anaplerosis from Heptanoate and Propionate
Anaplerosis can be expressed as a relative or an absolute flux. Relative anaplerosis is the fractional contribution of an anaplerotic substrate to the four-carbon component of CAC intermediates which carry acetyl groups as they are oxidized. For example, in Fig 10A [13C3]propionate contributes up to 0.37 of the catalytic intermediates of the CAC. The remaining fraction (1 − 0.37 = 0.63) derives from recycling of catalytic intermediates. Absolute anaplerosis is a flux of an anaplerotic substrate into the CAC, expressed as μmol·(g dry wt)−1·min−1.
FIGURE 10.
Anaplerosis and glucose labeling from increasing concentrations of [13C3]propionate (♦) or [5,6,7-13C3]heptanoate (■, ▴). The perfusions with increasing [5,6,7-13C3]heptanoate concentrations were conducted in the absence (▴) or presence (■) of constant 1 mm [1-13C]octanoate. A, relative anaplerosis expressed as the m3 enrichment ratio (succinyl-CoA)/(propionyl-CoA). B, absolute anaplerosis. C, M2 + M3 labeling of glucose in the effluent perfusate.
In experiments with precursors of M3 propionyl-CoA ([5,6,7-13C3]heptanoate and [13C3]propionate), we calculated relative anaplerosis as the m3 enrichment ratio (succinyl-CoA)/(propionyl-CoA) (Fig. 10A). This ratio represents the contribution of the propionyl-CoA precursor to CAC catalytic intermediates which carry acetyl units as they are oxidized. Assuming that propionate and heptanoate in the liver are channeled only to anaplerosis and C5 ketogenesis, we calculated absolute anaplerosis from each propionyl-CoA precursor as (uptake of substrate minus C5 ketogenesis)/(fractional anaplerosis from this substrate). This rate, which is up to 15 μmol·min−1·(g dry wt)−1 for [5,6,7-13C3]heptanoate (Fig. 10B), does not represent a flux of acetyl-CoA through the CAC. It does represent the rate of the sections of the CAC going from succinyl-CoA to oxaloacetate, the cataplerotic intermediate leading to phosphoenolpyruvate and glucose.
Relative anaplerosis from [13C3]propionate increased faster with substrate concentration than relative anaplerosis from [5,6,7-13C3]heptanoate. The opposite occurred with absolute anaplerosis (compare Figs. 10, A and B). This probably results in a faster CAC flux in the presence of [5,6,7-13C3]heptanoate (which supplies 2 acetyl-CoA) than in the presence of [13C3]propionate (which supplies no acetyl-CoA).
Absolute anaplerosis from [5,6,7-13C3]heptanoate was significantly decreased in the presence of octanoate (p < 0.05), although the latter is not anaplerotic (Fig. 10B, top versus bottom curve). This results from the inhibition of heptanoate uptake by octanoate (Figs. 2B and 3A). Thus, anaplerosis from an odd-chain fatty acid is modulated by the presence of an even-chain fatty acid.
If all absolute anaplerosis from [5,6,7-13C3]heptanoate or [13C3]propionate (Fig. 10B) were used for gluconeogenesis, one calculates that the glucose in the effluent perfusate should be about 1.4–1.7% labeled in M2 + M3 isotopomers. This calculation takes into account the m3 enrichment of succinyl-CoA, the absolute anaplerosis, and the supply of unlabeled glucose in the influent perfusate. In fact, glucose labeling from [5,6,7-13C3]heptanoate and [13C3]propionate plateaued at 0.8–1%. This dilution (by a factor of about two) results from isotopic exchanges between CAC intermediates and related compounds, as shown by Hetenyi (32). Quite striking is the absence of labeling of glucose from [5,6,7-13C3]heptanoate in the presence of unlabeled octanoate (Fig. 10C, lower curve, ■). This, despite the fact that anaplerosis from [5,6,7-13C3]heptanoate was not fully abolished by octanoate (Fig. 10B). This inhibition may result from the increase in the [NADH]/[NAD+] ratios induced by the rapid oxidation of octanoate.
One can wonder whether zonation of liver metabolism influences the calculated rates of relative anaplerosis, especially at low [5,6,7-13C3]heptanoate concentrations, when the pericentral hepatocytes are not in contact with the labeled substrate (Fig. 5). The pericentral cells must have pools of unlabeled propionyl-CoA, methylmalonyl-CoA, and succinyl-CoA derived from amino acid catabolism and recycling of succinyl-CoA in the CAC. Hence, in the extract of a whole liver perfused with a low concentration of [5,6,7-13C3]heptanoate, the m3 enrichments of propionyl-CoA and succinyl-CoA formed in periportal cells are diluted by unlabeled substrates formed in the pericentral cells. Moreover, the relative anaplerosis calculated at low [5,6,7-13C3]heptanoate concentration may either be over- or underestimated, depending on the relative sizes and enrichments of the propionyl-CoA and succinyl-CoA pools in the pericentral cells.
Concluding Remarks
In the above investigations the association of measurements of substrate fluxes and mass isotopomer analysis of intermediates provides a wealth of information on the interrelation between C4 ketogenesis, C5 ketogenesis, and anaplerosis. Our data extend to C5 ketogenesis the concept that the mitochondrial 3-ketoacyl-CoA thiolase reaction (Fig. 1, reaction 1) does not allow a net acyl-CoA condensation flux (33). This is shown by the absence of C5 ketogenesis from propionate (Fig. 2C) and the absence of C4 ketogenesis from acetate (34) or from glucose. The absence of net acyl-CoA condensation does not prevent partial isotopic equilibration between acetyl-CoA and AcAc-CoA, as shown by (i) the incorporation of label from [1-13C]octanoate into C4 ketone bodies (Fig. 6A) and C5 ketone bodies (in the presence of unlabeled heptanoate, Fig. 7D) and (ii) the incorporation of label from [1-14C]acetate into C4 ketone bodies (see Fig. 1 of Ref. 34). Also, the absence of net condensation between propionyl-CoA derived from propionate and acetyl-CoA, resulting in only traces of C5 ketone body production (Fig. 2C), does not prevent incorporation of label from [13C3]propionate into HEG-CoA, which was 90% M3-labeled (not shown). The absence of C5 ketogenesis from propionate or propionyl-CoA strongly suggests that the concentration of C5 ketone bodies found in body fluids of patients with disorders of the propionyl-CoA pathway are formed via β-oxidation of odd-long-chain fatty acids synthesized from propionyl-CoA in these patients. This is similar to C5 ketogenesis from heptanoate (Fig. 1, middle column).
Our data confirm Hüth et al. (25) finding that the rate of equilibration of the C3 + 4 acetyl moiety of AcAc-CoA with acetyl-CoA via AcAc-CoA thiolase is much smaller than the rate of equilibration of the C1 + 2 moiety. This is clearly illustrated by the difference in the enrichments of the C1 + 2 and C3 + 4 moieties of C4 ketone bodies in the presence of [1-13C]octanoate versus [8-13C]octanoate (Fig. 6).
Although the liver takes up octanoate or heptanoate at similar rates (Fig. 2, A and B), the flux of C4 ketogenesis is more rapid than that of C5 ketogenesis. This results from the diversion of the propionyl moiety of heptanoate to anaplerosis of the CAC and gluconeogenesis (Figs. 1 and 10). Also, in the presence of octanoate and heptanoate, the uptake of octanoate and C4 ketogenesis prevails over the uptake of heptanoate and C5 ketogenesis. The inhibition of anaplerosis and gluconeogenesis from heptanoate by octanoate (Fig. 10, B and C) has implications for the design of diets, which are both anaplerotic and gluconeogenic, for the treatment of some metabolic diseases such as disorders of long-chain fatty acid oxidation. Physicians may be tempted to progressively modify the patients' diet to replace medium-even-chain triglycerides (which have been used since the 1980s to treat such patients (35)) by triheptanoin (16, 17). This would not be advisable because octanoate inhibits heptanoate uptake (Fig. 3B), C5 ketogenesis from heptanoate (Fig. 4B), and anaplerosis from heptanoate (Fig. 10, A and B).
This work was supported, in whole or in part, by National Institutes of Health Grant Road Map Grant 5R33DK070291 and Grant 5R01DK069752. This work was also supported by the Cleveland Mt. Sinai Health Care Foundation.
Mass isotopomers are designated as M1, M2…Mn, where n is the number of heavy atoms in the molecule. The mol percent enrichment of each isotopomer is designated as m1, m2…mn.
- BHB
- β-hydroxybutyrate
- AcAc
- acetoacetate
- BKP
- β-ketopentanoate (3-ketovalerate)
- BHP
- β-hydroxypentanoate (3-hydroxyvalerate)
- CAC
- citric acid cycle
- HEG-CoA
- β-hydroxy-β-ethylglutaryl-CoA
- HMG-CoA
- β-hydroxy-β-methylglutaryl-CoA
- MPE
- molar percent enrichments.
REFERENCES
- 1.McGarry J. D., Foster D. W. (1980) Annu. Rev. Biochem. 49, 395–420 [DOI] [PubMed] [Google Scholar]
- 2.Robinson A. M., Williamson D. H. (1980) Physiol. Rev. 60, 143–187 [DOI] [PubMed] [Google Scholar]
- 3.Balasse E. O., Féry F. (1989) Diabetes Metab. Rev. 5, 247–270 [DOI] [PubMed] [Google Scholar]
- 4.Fukao T., Lopaschuk G. D., Mitchell G. A. (2004) Prostaglandins Leukot. Essent. Fatty Acids 70, 243–251 [DOI] [PubMed] [Google Scholar]
- 5.Sweetman L., Weyler W., Nyhan W. L., de Céspedes C., Loria A. R., Estrada Y. (1978) Biomed. Mass Spectrom. 5, 198–207 [DOI] [PubMed] [Google Scholar]
- 6.Kuhara T., Inoue Y., Shinka T., Matsumoto I., Matsuo M. (1983) Biomed. Mass Spectrom. 10, 629–632 [DOI] [PubMed] [Google Scholar]
- 7.Baker F. C., Schooley D. A. (1981) Biochim. Biophys. Acta 664, 356–372 [DOI] [PubMed] [Google Scholar]
- 8.Duran M., Gompertz D., Bruinvis L., Ketting D., Wadman S. K. (1978) Clin. Chim. Acta 82, 93–99 [DOI] [PubMed] [Google Scholar]
- 9.Hommes F. A., Kuipers J. R., Elema J. D., Jansen J. F., Jonxis J. H. (1968) Pediatr. Res. 2, 519–524 [DOI] [PubMed] [Google Scholar]
- 10.Wakil S. J. (1989) Biochemistry 28, 4523–4530 [DOI] [PubMed] [Google Scholar]
- 11.Bergmeyer H. U., Gawehn K., Klotzsch H., Krebs H. A., Williamson D. H. (1967) Biochem. J. 102, 423–431 [DOI] [PMC free article] [PubMed] [Google Scholar]
- 12.Stern J. R., Coon M. J., Del Campillo A. (1956) J. Biol. Chem. 221, 1–14 [PubMed] [Google Scholar]
- 13.Leclerc J., Des Rosiers C., Montgomery J. A., Brunet J., Ste-Marie L., Reider M. W., Fernandez C. A., Powers L., David F., Brunengraber H. (1995) Am. J. Physiol. 268, E446–E452 [DOI] [PubMed] [Google Scholar]
- 14.Williamson D. H., Bates M. W., Page M. A., Krebs H. A. (1971) Biochem. J. 121, 41–47 [DOI] [PMC free article] [PubMed] [Google Scholar]
- 15.Fukao T., Song X. Q., Mitchell G. A., Yamaguchi S., Sukegawa K., Orii T., Kondo N. (1997) Pediatr. Res. 42, 498–502 [DOI] [PubMed] [Google Scholar]
- 16.Roe C. R., Sweetman L., Roe D. S., David F., Brunengraber H. (2002) J. Clin. Invest. 110, 259–269 [DOI] [PMC free article] [PubMed] [Google Scholar]
- 17.Roe C. R., Yang B. Z., Brunengraber H., Roe D. S., Wallace M., Garritson B. K. (2008) Neurology 71, 260–264 [DOI] [PMC free article] [PubMed] [Google Scholar]
- 18.Kasumov T., Cendrowski A. V., David F., Jobbins K. A., Anderson V. E., Brunengraber H. (2007) Arch. Biochem. Biophys. 463, 110–117 [DOI] [PMC free article] [PubMed] [Google Scholar]
- 19.Krebs H. A., Hems R. (1970) Biochem. J. 119, 525–533 [DOI] [PMC free article] [PubMed] [Google Scholar]
- 20.Brass E. P., Beyerinck R. A. (1988) Biochem. J. 250, 819–825 [DOI] [PMC free article] [PubMed] [Google Scholar]
- 21.Des Rosiers C., Montgomery J. A., Desrochers S., Garneau M., David F., Mamer O. A., Brunengraber H. (1988) Anal. Biochem. 173, 96–105 [DOI] [PubMed] [Google Scholar]
- 22.Fernandez C. A., Des Rosiers C., Previs S. F., David F., Brunengraber H. (1996) J. Mass Spectrom. 31, 255–262 [DOI] [PubMed] [Google Scholar]
- 23.McGarry J. D., Foster D. W. (1971) J. Biol. Chem. 246, 1149–1159 [PubMed] [Google Scholar]
- 24.Hüth W., Dierich C., von Oeynhausen V., Seubert W. (1974) Biochem. Biophys. Res. Commun. 56, 1069–1077 [DOI] [PubMed] [Google Scholar]
- 25.Hüth W., Dierich C., von , Oeynhausen V., Seubert W. (1973) Hoppe-Seyler's Z. Physiol. Chem. 354, 635–649 [DOI] [PubMed] [Google Scholar]
- 26.Hüth W., Alves F. (1985) Biochim. Biophys. Acta 830, 274–281 [DOI] [PubMed] [Google Scholar]
- 27.Balzer I., Hüth W. (1986) Biochim. Biophys. Acta 870, 350–356 [DOI] [PubMed] [Google Scholar]
- 28.Jungermann K., Kietzmann T. (1996) Annu. Rev. Nutr. 16, 179–203 [DOI] [PubMed] [Google Scholar]
- 29.Katz J. (1985) Am. J. Physiol. 248, R391–R399 [DOI] [PubMed] [Google Scholar]
- 30.Srere P. A. (1987) Annu. Rev. Biochem. 56, 89–124 [DOI] [PubMed] [Google Scholar]
- 31.Des Rosiers C., David F., Garneau M., Brunengraber H. (1991) J. Biol. Chem. 266, 1574–1578 [PubMed] [Google Scholar]
- 32.Hetenyi G., Jr. (1982) Fed. Proc. 41, 104–109 [PubMed] [Google Scholar]
- 33.Hüth W., Menke R. (1982) Eur. J. Biochem. 128, 413–419 [PubMed] [Google Scholar]
- 34.Endemann G., Goetz P. G., Tomera J. F., Rand W. M., Desrochers S., Brunengraber H. (1987) Biochem. Cell Biol. 65, 989–996 [DOI] [PubMed] [Google Scholar]
- 35.Bougnères P. F., Saudubray J. M., Marsac C., Bernard O., Odièvre M., Girard J. (1981) J. Pediatr. 98, 742–746 [DOI] [PubMed] [Google Scholar]


