Abstract
Obesity and type 2 diabetes present partially overlapping phenotypes with systemic inflammation as a common feature, raising the hypothesis that elevated cytokine levels may contribute to peripheral insulin resistance as well as the decreased beta cell functional mass observed in type 2 diabetes. In healthy humans, TNF-α infusion induces skeletal muscle insulin resistance. We now explore the impact of TNF-α on primary beta cell function and the underlying signaling pathways. Human and rat primary beta cells were sorted by FACS and cultured for 24 h ± 20 ng/ml TNF-α to explore the impact on apoptosis, proliferation, and short-term insulin secretion (1 h, 2.8 mm glucose followed by 1 h, 16.7 mm glucose at the end of the 24-h culture period) as well as key signaling protein phosphorylation and expression. Prior exposure to TNF-α for 24 h inhibits glucose-stimulated insulin secretion from primary beta cells. This is associated with a decrease in glucose-stimulated phosphorylation of key proteins in the insulin signaling pathway including Akt, AS160, and other Akt substrates, ERK as well as the insulin receptor. Strikingly, TNF-α treatment decreased IRS-2 protein level by 46 ± 7% versus control, although mRNA expression was unchanged. While TNF-α treatment increased MAP4K4 mRNA expression by 33 ± 5%, knockdown of MAP4K4 by siRNA-protected beta cells against the detrimental effects of TNF-α on both insulin secretion and signaling. We thus identify MAP4K4 as a key upstream mediator of TNF-α action on the beta cell, making it a potential therapeutic target for preservation of beta cell function in type 2 diabetes.
Obesity and type 2 diabetes mellitus are widespread metabolic disorders characterized by an overlapping phenotype of insulin resistance with a relative deficiency in insulin secretion underlying hyperglycemia in type 2 diabetes. Systemic inflammation is also a feature of obesity and type 2 diabetes, raising the hypothesis that elevated cytokine levels may contribute to peripheral insulin resistance as well as decreased beta cell function and mass. Correlative studies provide evidence that type 2 diabetes is associated with elevated levels of the proinflammatory cytokine tumor necrosis factor-α (TNF-α)2 in adipose tissue (1), skeletal muscle (2), and plasma (3–5). In beta cells, TNF-α has been shown to induce insulin resistance mediated by nitric oxide (6) and a reduction of glucose-stimulated calcium influx (7). The impact of TNF-α on the beta cell insulin signaling pathway has not been studied even though this pathway is known to be implicated in various aspects of beta cell function. Glucose effects on beta cell growth and survival thus require activation of the insulin receptor (IR) and insulin receptor substrate-2 (IRS-2) (8). Previously, we showed that activation of this pathway by glucose was essential for insulin secretion and that the Akt substrate 160 (AS160) was involved in glucose-stimulated insulin secretion (GSIS) (9). IR/IRS-2/Akt signaling is known to enhance beta cell replication and function (8–16) and an IGF-2/IGF-1 receptor autocrine loop underlies the glucose effect on insulin signaling via IRS-2 (17).
TNF-α induces insulin resistance in insulin-sensitive tissues like adipose tissue and skeletal muscle by excessive phosphorylation of extracellular signal-regulated kinase-1/2 (ERK-1/2) and c-Jun N-terminal kinase (JNK), concomitant with increased serine and reduced tyrosine phosphorylation of IRS-1 (18–20). However, this can be prevented by silencing mitogenic-activated protein kinase kinase kinase kinase isoform 4 (MAP4K4) (18, 19). MAP4K4 is a member of the germinal center kinase group related to Saccharomyces cerevisiae MAP4K, Sterile 20 (21, 22). A recent study has shown that its silencing in macrophages suppresses systemic inflammation thereby preventing diabetes (23). We now explore the action of TNF-α on primary beta cell function and its impact on beta cell insulin signaling after glucose stimulation, showing for the first time that MAP4K4 acts as a key upstream mediator of TNF-α action on GSIS.
EXPERIMENTAL PROCEDURES
Antibodies and Reagents
l-NG-monomethyl arginine (LNMMA): Sigma; Bay 11-7082: BioMol Research Laboratories (Hamburg, Germany); hTNF-α: R&D Systems Europe Ltd (Abingdon, UK); Anti-phospho-Akt (Ser-473) and anti-phospho-ERK-1/2 (Thr-202 and Tyr-204): New England Biolabs (Beverly, Massachusetts): anti-phospho-(Ser/Thr)-AS160, anti-AS160, anti-phospho-IR, anti-phospho-p70S6K, anti-phospho-JNK, anti-phospho-p38, anti-Akt, anti-ERK, and anti-IRS-2: Cell Signaling Technology (Beverly, MA); anti-p65 subunit of NF-κB (C-20): Santa Cruz Biotechnology (Santa Cruz, CA); monoclonal anti-actin: Sigma. Anti-IRS-1 was a gift from Dr. M. F. White (Children's Hospital, Harvard University, Boston, MA).
Rat Primary Beta Cell Purification
Animals were treated according to protocols approved by the State Commissioner on Animal Care. Islets of Langerhans were isolated by collagenase digestion of pancreas from male Wistar rats (150–200 g) followed by Ficoll purification, based on published procedures (24). Beta cells were purified by autofluorescence-activated cell sorting (FACS) using a FACStar-Plus (BD Biosciences, NJ) according to Ref. 24. Sorted beta cells were washed in culture medium (Dulbecco's modified Eagle's medium, 10% fetal calf serum, 11.2 mm glucose, 110 mg/liter sodium pyruvate, 66 units/ml penicillin, 66 μg/ml streptomycin, 50 mg/l gentamycin) and allowed to recover overnight in suspension at 37 °C in non-adherent 100-mm Petri dishes. Cells were then collected, resuspended in culture medium at 600,000 cells/ml, and plated in 50-μl droplets on plastic culture dishes coated with extracellular matrix derived from 804G (rat bladder carcinoma) cells to facilitate adhesion and spreading (25).
Human Primary Beta Cell Purification
Human islets were kindly provided by the Islet Cell Resource Centers of Milan (Italy), Geneva (Switzerland), and Lille (France) through the Juvenile Diabetes Research Foundation (JDRF) European Consortium for Islets Transplantation (ECIT) Islets for Research Program. Human beta cells were sorted by FACS following labeling with Newport Green and exclusion of ductal cells and dead cells according to a recently developed method that provides a population comprising >90% beta cells (26). The sorted cells were then placed in culture on 804G matrix as for rat beta cells.
Insulin Secretion Assay
After 24 h TNF-α cells were washed three times with modified Krebs-Ringer bicarbonate HEPES buffer (KRBH: 125 mm NaCl, 4.74 mm KCl, 1 mm CaCl2, 1.2 mm KH2PO4, 1.2 mm MgSO4, 5 mm NaHCO3, 25 mm HEPES, pH 7.4, 0.1% bovine serum albumin) with 2.8 mm glucose, and preincubated with this same buffer for 1 h at 37 °C. Cells were then incubated for 1 h at 37 °C with KRBH containing 2.8 mm glucose (basal), followed by 1 h at 16.7 mm glucose (stimulated). The buffers were recovered and cellular insulin extracted with acid/ethanol (27). Insulin in buffers and extracts was measured by radioimmunoassay using rat or human insulin standard. Secretion is expressed as a percentage of total insulin (content plus total secreted).
Detection of Apoptosis and Proliferation
Cell death was measured by TUNEL assay and proliferation was assessed by BrdU incorporation as previously described (27).
RNA Interference (RNAi)-mediated Knockdown of MAP4K4
MAP4K4 expression was decreased by siRNA transfection as described (28). In brief liposome-siRNA (Lipofectamine 2000 and siRNA (100 nm)) was prepared in 200 μl of opti-MEM as described by the suppliers. Primary rat beta cells were transfected twice (day 0 and 1); TNF-α treatment was from day 2 to 3.
Gene Expression
mRNA levels of IRS-1, IRS-2, and MAP4K4 were measured using quantitative real-time PCR (29).
SDS-PAGE and Western Blotting
Protein samples were prepared and immunoblots analyzed as described (9). Western blots were quantified by densitometry and band density of phosphoproteins normalized to that of the corresponding (total) protein or to actin as indicated in the figures.
Presentation of Data and Statistics
Data are presented as means ± S.E. for 3–5 independent experiments. Statistical significance for differences was evaluated by Student's two-tailed t test for unpaired groups with p < 0.05 considered significant.
RESULTS
TNF-α Effects on Cell Death, Proliferation, and Insulin Secretion in Human and Rat Primary Beta Cells
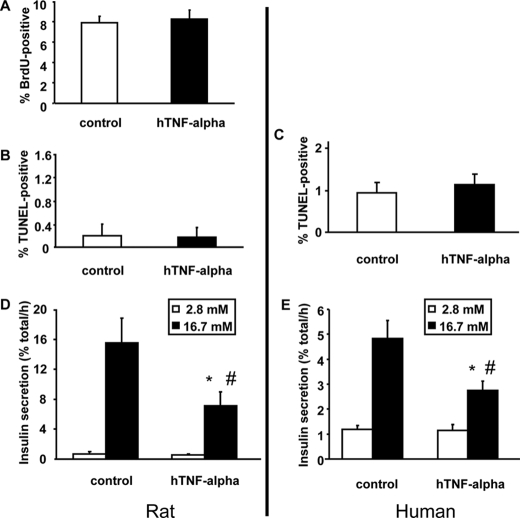
Rat beta cells were treated for 48 h with 20 ng/ml TNF-α and proliferation measured by BrdU incorporation during the last 24 h, without any detectable difference (Fig. 1A). Both rat and human primary (sorted) beta cells were used to evaluate the impact of TNF-α (24 h) on cell death and insulin secretion. There was no effect of TNF-α on cell death (Fig. 1, B and C), but there were always more TUNEL-positive human than rat cells. This could be due to the 804G extracellular matrix used to facilitate adherence and spreading of the cells that may be better suited for survival in culture of rat beta cells; there may also be intrinsic differences between human and rat beta cells.
FIGURE 1.
TNF-α action on primary beta cell proliferation, survival, and glucose-stimulated insulin secretion. A, effect of TNF-α on proliferation of rat primary beta cells. Proliferation was measured by BrdU incorporation. Cells were grown under standard culture conditions (20% fetal calf serum, 11.2 mm glucose) and treated for 48 h with TNF-α (20 ng/ml), and BrdU was added the last 24 h. Beta cells were identified by insulin immunofluorescence. n = 5 independent experiments. B and C, effect of TNF-α on rat and human primary beta cell apoptosis. Cell death was measured in insulin-positive (immunofluorescence) cells by TUNEL after 24 h of treatment with TNF-α. n = 5 independent experiments. D and E, effect of TNF-α treatment on insulin secretion from rat and human primary beta cells. Insulin secretion was measured using rat and human primary beta cells incubated for 1 h at 2.8 mm glucose (white bars, basal secretion) following by 1 h at 16.7 mm glucose (dark bars, stimulated secretion). n = 5 independent experiments. *, p < 0.05 versus basal secretion: #, p < 0.05 versus stimulated secretion under control conditions.
GSIS was significantly decreased following 24-h pre-exposure to TNF-α in both rat and human primary beta cells with no change in basal insulin secretion (Fig. 1, D and E) or cellular insulin content (255 ± 45 versus 305 ± 63 ng/dish for rat and 1594 ± 159 versus 1731 ± 190 ng/dish for human beta cells without or with TNF-α, respectively). Acute addition of TNF-α only during the secretion test was without effect on any of these parameters (not shown).
Glucose Action on Akt and ERK Phosphorylation Is Prevented by TNF-α
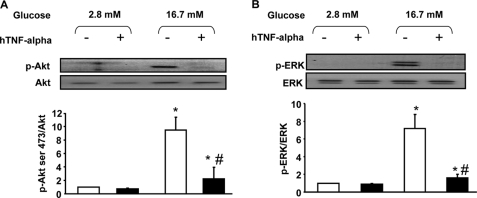
Rat primary beta cells were cultured in the presence or absence (control) of 20 ng/ml TNF-α for 24 h. After this, cells were handled exactly as for measurement of GSIS (i.e. without TNF-α) and Akt and ERK phosphorylation quantified by Western blot after the 1-h incubation periods at 2.8 and 16.7 mm glucose. Phosphorylation of both Akt and ERK was stimulated by glucose, and TNF-α pretreatment abolished this effect (Fig. 2, A and B).
FIGURE 2.
TNF-α action on Akt and ERK phosphorylation after glucose stimulation in rat primary beta cells. A and B, cells were harvested after culture under basal conditions (white bars) or after 1 h of stimulation with glucose (16.7 mm) (dark bars) under normal conditions or after 24 h of treatment with TNF-α (20 ng/ml). *, p < 0.05 versus 2.8 mm glucose control condition; #, p < 0.05 versus 16.7 mm glucose control condition. A, representative Western blot and densitometry highlighting Akt Ser-473 phosphorylation. Western blots were scanned and quantified and data presented for n = 5 independent experiments. B, representative immunoblot and densitometry showing ERK1/2 phosphorylation.
TNF-α Treatment Prevents Phosphorylation of Substrates of Akt Induced by Glucose Stimulation
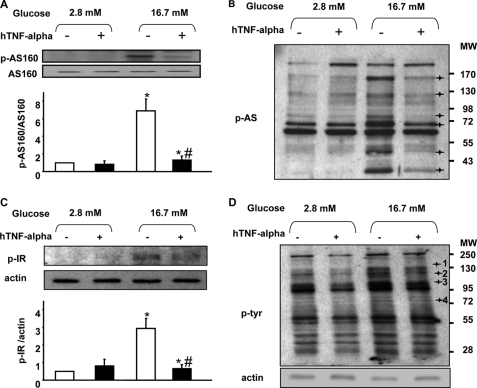
AS160 is phosphorylated in response to glucose in beta cells and is involved in GSIS (9). As observed for Akt, TNF-α pretreatment prevented AS160 phosphorylation in response to glucose (Fig. 3A). TNF-α treatment also prevented the glucose-induced phosphorylation of several other as yet unidentified Akt substrates (black crosses, Fig. 3B).
FIGURE 3.
TNF-α action on AS160, IR, Akt substrates, and tyrosine phosphorylation after glucose stimulation in rat primary beta cells. A–D, cells were harvested after culture under basal conditions (white bars) or after 1-h stimulation with glucose (16.7 mm) (dark bars) under normal conditions or after 24-h treatment with TNF-α (20 ng/ml). *, p < 0.05 versus 2.8 mm glucose control condition; #, p < 0.05 versus 16.7 mm glucose control condition. A, representative Western blot and densitometry highlighting AS160 phosphorylation. Western blots were scanned and quantified and data presented for n = 5 independent experiments. B, representative immunoblot showing Akt substrates phosphorylation on residues (Ser/Thr). n = 5 independent experiments. C, representative immunoblot and densitometry showing IR tyrosine phosphorylation. n = 5 independent experiments. *, p < 0.05 versus 2.8 mm glucose control condition; #, p < 0.05 versus 16.7 mm glucose control condition. D, representative immunoblot showing total tyrosine phosphorylation. n = 4 independent experiments.
TNF-α Treatment Abolishes Glucose Action on IR Phosphorylation as Well as Total Tyrosine Phosphorylation
IR tyrosine phosphorylation is involved in GSIS from pancreatic beta cells. Here, we show that 24-h TNF-α treatment abolished glucose-induced IR tyrosine phosphorylation without effect on IR protein level (Fig. 3C). TNF-α treatment also altered the general pattern of glucose-induced tyrosine phosphorylation, preventing such phosphorylation of a number of as yet unidentified proteins. Tyrosine phosphorylation on each Western blot was quantified by densitometry and normalized to actin. Only proteins with a statistically significant difference in normalized band density between control versus TNF-α were retained as candidates (black crosses 1–4, Fig. 3D).
TNF-α Treatment Reduces IRS-2 Protein Expression
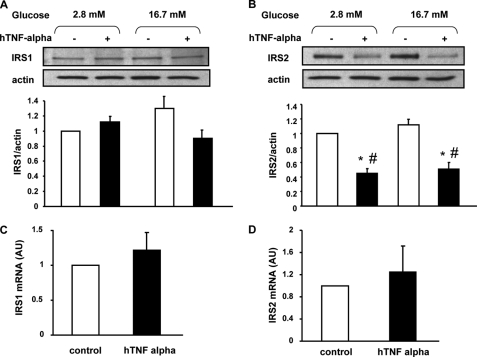
IRS-2 has been shown to be involved in both insulin production and secretion (30, 31). TNF-α treatment induced decreased protein expression for IRS-2 while that of IRS-1 was unchanged (Fig. 4, A and B). This was attributed to increased degradation of IRS-2 protein, because there was no change in IRS-2 mRNA expression (Fig. 4D).
FIGURE 4.
TNF-α action on IRS-1 and IRS-2 protein and mRNA expression. A and B, representative Western blot and densitometry showing IRS-1 (A) and IRS-2 (B) protein expression under basal conditions (white bars) or after 1 h of stimulation with glucose (16.7 mm) (dark bars) in normal conditions or after 24 treatment with TNF-α (20 ng/ml). Western blots were scanned and quantified and data presented for n = 5 independent experiments. *, p < 0.05 versus 2.8 mm glucose control condition; #, p < 0.05 versus 16.7 mm glucose control condition. C and D, IRS-1 and IRS-2 mRNA expression were measured by quantitative real-time RT-PCR in rat primary beta cells; n = 5 independent experiments.
TNF-α Activation of Candidate Kinases
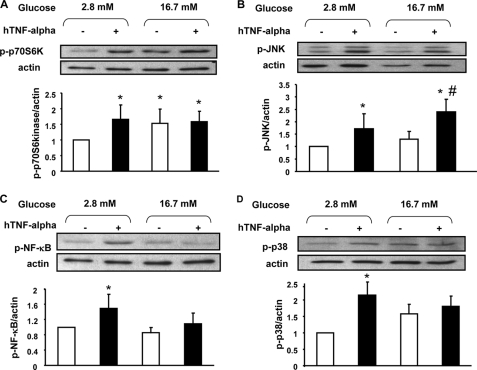
TNF-α has been shown to activate several kinases in different tissues, and we next explored the phosphorylation state of four such kinases in beta cells after TNF-α treatment. TNF-α treatment for 24-h increased phosphorylation of p70S6Kinase (Fig. 5A), JNK (Fig. 5B), NF-κB (Fig. 5C), and p38 (Fig. 5D). Glucose (1 h, 16.7 mm) induced p70S6Kinase phosphorylation (Fig. 5A) whereas it had no significant effect on the other kinases (Fig. 5, B–D). With the exception of JNK, increased phosphorylation was only observed after the 24 h of treatment with TNF-α followed by a 1-h preincubation and 1-h incubation at 2.8 mm glucose in its absence, but not after the subsequent 1-h incubation period at 16.7 mm glucose in the continued absence of the cytokine.
FIGURE 5.
TNF-α action on p70S6K, JNK, NF-κB, and p38 phosphorylation after glucose stimulation in rat primary beta cells. A–D, representative Western blot and densitometry highlighting p70S6K (A), JNK (B), NF-κB (C), and p38 (D) phosphorylation under basal conditions (white bars) or after 1 h of stimulation with glucose (16.7 mm) (dark bars) under normal conditions or after 24 h of treatment with TNF-α (20 ng/ml). Western blots were scanned and quantified and data presented for n = 5 independent experiments. *, p < 0.05 versus 2.8 mm glucose control condition; #, p < 0.05 versus 16.7 mm glucose control condition.
Impact of NOS and NF-κB Inhibition on GSIS
TNF-α has been shown to activate NOS and therefore induce NO production. To study if NOS activation could explain the impact of TNF-α on GSIS, we measured insulin secretion in rat primary beta cells after 24-h pretreatment with LNMMA, an inhibitor of NOS. LNMMA treatment in the absence of TNF-α induced an increase of GSIS (13.7 ± 1.0% versus 18.8 ± 3.1% of total insulin content secreted per h at 16.7 mm glucose without and with LNMMA treatment, respectively) without any change in basal secretion, but failed to protect against the decrease in GSIS following 24 h of culture with TNF-α (18.8 ± 3.1% versus 11.2 ± 2.5% of total insulin content secreted per h at 16.7 mm glucose in presence of LNMMA, without or with TNF-α, respectively).
NF-κB has been shown to impact GSIS and as shown in Fig. 5C, TNF-α treatment activated NF-κB. For this reason, rat primary beta cells were treated for 48 h with Bay 11-7082, an inhibitor of NF-κB, with TNF-α added during the last 24 h. There was no effect of Bay 11-7082 on insulin secretion either with or without TNF-α for 24 h (data not show).
MAP4K4 Mediates TNF-α Effect on GSIS in Rat Primary Beta Cells
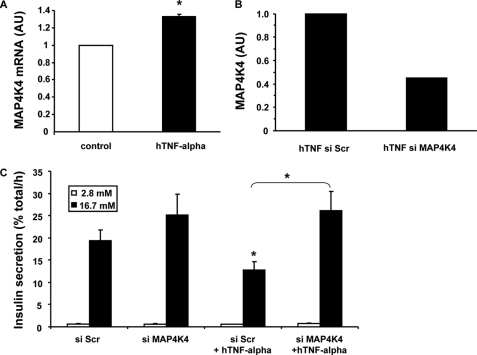
MAP4K4 has been shown to mediate TNF-α action in adipose tissue and in skeletal muscle. The amount of MAP4K4 mRNA was increased ∼33% in rat primary beta cells treated 24 h with TNF-α (Fig. 6A). Unfortunately, there is no available antibody to monitor MAP4K4 protein levels in rat cells by Western blot. Transfection with siRNA decreased MAP4K4 mRNA expression by 55% in primary beta cells treated with TNF-α (Fig. 6B). Furthermore, transfection with MAP4K4 siRNA completely prevented TNF-α inhibition of GSIS (Fig. 6C).
FIGURE 6.
MAP4K4 expression after TNF-α treatment in rat primary beta cells and its silencing effect. A, MAP4K4 mRNA expression was measured by quantitative real-time RT-PCR in rat primary beta cells cultured either in control condition or treated with TNF-α for 24 h (20 ng/ml); n = 5 independent experiments. *, p < 0.05. B, silencing efficiency on MAP4K4 mRNA expression was measured by quantitative real-time RT-PCR in rat primary beta cells transfected with scrambled (Scr) or with MAP4K4 siRNA. C, insulin secretion was measured using rat primary beta cells transfected with scrambled (Scr) or with MAP4K4 siRNA and incubated for 1 h at 2.8 mm glucose (white bars, basal secretion) following by 1 h at 16.7 mm glucose (dark bars, stimulated secretion). Data are presented for n = 3 independent experiments. *, p < 0.05.
Cells with Decreased MAP4K4 Are Protected from TNF-α Action on Kinases
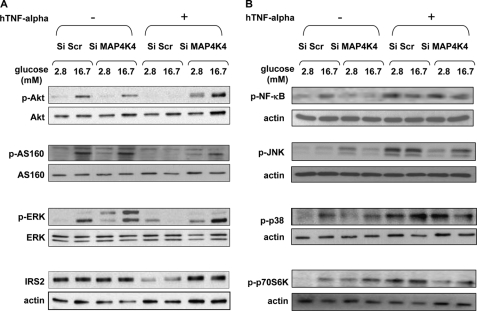
We show in Figs. 3 and 4 that glucose action on the insulin signaling pathway was greatly reduced by TNF-α treatment. Moreover, decreasing MAP4K4 protected cells from the TNF-α inhibition of GSIS (Fig. 6C). This led us to investigate the impact of MAP4K4 on insulin signaling. In cells with MAP4K4 decreased by siRNA and treated with TNF-α, glucose was able to induce Akt, AS160, and ERK phosphorylation as in cells not exposed to TNF-α (Fig. 7A). Moreover, IRS-2 protein expression was unchanged when cells with decreased MAP4K4 were treated with TNF-α, whereas TNF-α markedly decreased IRS-2 in control cells (Fig. 7A). TNF-α was shown to activate p70S6Kinase, JNK, p38, and NF-κB (Fig. 5). In cells with decreased MAP4K4, TNF-α was still able to activate NF-κB and p38 whereas its action on p70S6kinase, and JNK was abolished (Fig. 7B).
FIGURE 7.
Silencing of MAP4K4 prevents TNF-α action on Akt, AS160, ERK, IRS-2, JNK, and p70S6K, whereas NF-κB and p38 are not affected in rat primary beta cells. Representative Western blot showing Akt, AS160, ERK, NF-κB, JNK, p38, and p70S6K phosphorylation and IRS-2 protein expression in cells transfected either with a scrambled (Scr) construct or with MAP4K4 siRNA. Cells were incubated for 1 h under basal conditions (2.8 mm) or after a 1-h stimulation with glucose (16.7 mm) under normal conditions or after 24 h of treatment with TNF-α (20 ng/ml). Data are presented for n = 3 independent experiments.
DISCUSSION
Type 2 diabetes is characterized by an overlapping phenotype of insulin resistance and beta cell dysfunction, with a relative deficiency in insulin secretion underlying hyperglycemia (32, 33). Systemic inflammation is a feature of both obesity and type 2 diabetes (34–36), suggesting that elevated cytokine levels may contribute to peripheral insulin resistance as well as decreased beta cell function and mass (37, 38). Several studies have demonstrated that TNF-α contributes to the development of insulin resistance in human skeletal muscle and in adipose tissue (2, 18–20). In beta cells, TNF-α combined with IL-1β and IFN-γ decreases survival and function (37–41). TNF-α by itself decreases GSIS without affecting survival or proliferation of an insulin secreting beta cell line (6, 7). We now show that 24 h of TNF-α treatment decreases GSIS in human and rat primary beta cells while acute exposure to TNF-α only during the secretion test remains without effect (data not shown).
To understand the mechanism by which TNF-α treatment decreases GSIS, we have explored its impact on the insulin signaling pathway, since its activation is involved in glucose stimulus-secretion coupling (8, 42). We have shown that the IRS-2/Akt/AS160 pathway is involved in GSIS in primary beta cells (9), and a recent report indicates that an IGF-2/IGF-1 receptor autocrine loop underlies the glucose effect on insulin signaling mediated by IRS-2 (17). Moreover, IRS-2 is indispensable for normal beta cell function (12, 43), while ERK activation is involved in GSIS (44, 45). Our present data indicate that TNF-α treatment blocks glucose action on IR, Akt, ERK, and AS160 as well as other Akt substrates. Intriguingly, the pattern of phosphorylation of Akt substrates obtained after glucose stimulation in primary beta cells is similar to that observed in muscle or adipose tissue after insulin stimulation or exercise (46, 47). Only few of the substrates have been identified in muscle and adipose tissue while nothing is known in pancreatic beta cells aside from our previous work on AS160 (9). Glucose also mediated tyrosine phosphorylation of several proteins, and this pattern of phosphorylation was altered in TNF-α-treated cells. This too may contribute toward the reduction of GSIS (8). Last but not least, protein levels of IRS-2 (the dominant IR substrate for beta cell function (9, 12, 43)) were profoundly decreased by TNF-α treatment. It is thus likely that this effect of TNF-α on IRS-2 protein levels contributes toward the decreased GSIS. Protein levels of IRS-2 were decreased without any change in mRNA levels, suggesting that protein degradation accounts for the observed decrease. This may be secondary to TNF-α-induced serine phosphorylation of IRS-2 analagous to the increased serine phosphorylation and degradation of IRS-1 in response to TNF-α in skeletal muscle and adipose tissue (48–50).
TNF-α action can be mediated by activation of JNK, ERK, p38, p70S6kinase, and NF-κB (6, 7, 19, 20, 40, 51) and indeed these kinases were activated by TNF-α in beta cells. The ability of TNF-α to activate various kinases as well as the IR/IRS-2/Akt/AS/AS160 pathway could reflect either direct action on multiple targets and/or activation of an upstream signal common to some or all of them. However, neither inhibition of NOS nor NF-κB was sufficient to modify TNF-α action on GSIS. We therefore turned our attention to a leading candidate as a common upstream signal, MAP4K4, a putative effector of Rap2, a Ras family small GTP-binding protein that mediates the activation of JNK (52, 53). Silencing MAP4K4 rescues human skeletal muscle cells and adipocytes from TNF-α-induced insulin resistance and improves glucose uptake (18, 19). We now show that TNF-α treatment increases MAP4K4 gene expression in rat primary beta cells. Moreover, decreasing MAP4K4 expression by siRNA prevented TNF-α action on the insulin signaling pathway, preserved protein levels of IRS-2, maintained MAP4K4 mRNA levels below control levels even after TNF-α treatment and most interestingly prevented any decrease in GSIS. In keeping with a role for MAP4K4 as a key upstream signaling kinase in rat primary beta cells, decreasing its expression also prevented TNF-α action on JNK and p70S6K. It will be interesting in future studies to measure levels of MAP4K4 and ideally its activity in pancreatic beta cells from individuals with type 2 diabetes or in rodent models of the disease.
In summary, we identify MAP4K4 as a potential key player in GSIS in primary beta cells. Just as silencing MAP4K4 protects against peripheral insulin resistance induced by TNF-α in adipose tissue and skeletal muscle, decreasing its expression protects against the TNF-α-mediated decrease in GSIS while preserving IRS-2 levels. Collectively, these results place MAP4K4 as a novel target in the effort to treat or prevent diabetes by addressing both insulin resistance and impaired GSIS.
Acknowledgments
We thank Melanie Cornut and Katharina Rickenbach for expert technical assistance. The opinions expressed in this report are those of the authors and do not necessarily represent those of Merck.
This work was supported in part by a research grant from the Investigator-initiated Studies Program of MSD.
- TNF-α
- tumor necrosis factor-α
- JNK
- c-Jun N-terminal kinase
- ERK
- extracellular signal-regulated kinase
- TUNEL
- terminal deoxynucleotidyltransferase-mediated dUTP nick end-labeling
- NOS
- nitric-oxide synthase
- MAP4K4
- mitogen-activated protein 4 kinase 4
- FACS
- fluorescent-activated cell sorting
- IRS
- insulin receptor substrate
- GSIS
- glucose-stimulated insulin secretion
- siRNA
- RNA interference
- IR
- insulin receptor.
REFERENCES
- 1.Hotamisligil G. S., Arner P., Caro J. F., Atkinson R. L., Spiegelman B. M. (1995) J. Clin. Invest. 95, 2409–2415 [DOI] [PMC free article] [PubMed] [Google Scholar]
- 2.Saghizadeh M., Ong J. M., Garvey W. T., Henry R. R., Kern P. A. (1996) J. Clin. Invest. 97, 1111–1116 [DOI] [PMC free article] [PubMed] [Google Scholar]
- 3.Feingold K. R., Grunfeld C. (1992) Diabetes 41, Suppl. 2, 97–101 [DOI] [PubMed] [Google Scholar]
- 4.Mishima Y., Kuyama A., Tada A., Takahashi K., Ishioka T., Kibata M. (2001) Diabetes Res. Clin. Pract. 52, 119–123 [DOI] [PubMed] [Google Scholar]
- 5.Winkler G., Salamon F., Harmos G., Salamon D., Speer G., Szekeres O., Hajós P., Kovács M., Simon K., Cseh K. (1998) Diabetes Res. Clin. Pract 42, 169–174 [DOI] [PubMed] [Google Scholar]
- 6.Kwon G., Xu G., Marshall C. A., McDaniel M. L. (1999) J. Biol. Chem. 274, 18702–18708 [DOI] [PubMed] [Google Scholar]
- 7.Kim H. E., Choi S. E., Lee S. J., Lee J. H., Lee Y. J., Kang S. S., Chun J., Kang Y. (2008) J. Endocrinol. 198, 549–560 [DOI] [PubMed] [Google Scholar]
- 8.Assmann A., Ueki K., Winnay J. N., Kadowaki T., Kulkarni R. N. (2009) Mol. Cell. Biol. 29, 3219–3228 [DOI] [PMC free article] [PubMed] [Google Scholar]
- 9.Bouzakri K., Ribaux P., Tomas A., Parnaud G., Rickenbach K., Halban P. A. (2008) Diabetes 57, 1195–1204 [DOI] [PubMed] [Google Scholar]
- 10.Cantley J., Choudhury A. I., Asare-Anane H., Selman C., Lingard S., Heffron H., Herrera P., Persaud S. J., Withers D. J. (2007) Diabetologia 50, 1248–1256 [DOI] [PubMed] [Google Scholar]
- 11.Muller D., Huang G. C., Amiel S., Jones P. M., Persaud S. J. (2006) Diabetes 55, 2835–2842 [DOI] [PubMed] [Google Scholar]
- 12.Terauchi Y., Takamoto I., Kubota N., Matsui J., Suzuki R., Komeda K., Hara A., Toyoda Y., Miwa I., Aizawa S., Tsutsumi S., Tsubamoto Y., Hashimoto S., Eto K., Nakamura A., Noda M., Tobe K., Aburatani H., Nagai R., Kadowaki T. (2007) J. Clin. Invest. 117, 246–257 [DOI] [PMC free article] [PubMed] [Google Scholar]
- 13.Li D., Yin X., Zmuda E. J., Wolford C. C., Dong X., White M. F., Hai T. (2008) Diabetes 57, 635–644 [DOI] [PubMed] [Google Scholar]
- 14.Briaud I., Dickson L. M., Lingohr M. K., McCuaig J. F., Lawrence J. C., Rhodes C. J. (2005) J. Biol. Chem. 280, 2282–2293 [DOI] [PubMed] [Google Scholar]
- 15.Lingohr M. K., Briaud I., Dickson L. M., McCuaig J. F., Alárcon C., Wicksteed B. L., Rhodes C. J. (2006) J. Biol. Chem. 281, 15884–15892 [DOI] [PubMed] [Google Scholar]
- 16.Wrede C. E., Dickson L. M., Lingohr M. K., Briaud I., Rhodes C. J. (2002) J. Biol. Chem. 277, 49676–49684 [DOI] [PubMed] [Google Scholar]
- 17.Cornu M., Yang J. Y., Jaccard E., Poussin C., Widmann C., Thorens B. (2009) Diabetes 58, 1816–1825 [DOI] [PMC free article] [PubMed] [Google Scholar]
- 18.Tesz G. J., Guilherme A., Guntur K. V., Hubbard A. C., Tang X., Chawla A., Czech M. P. (2007) J. Biol. Chem. 282, 19302–19312 [DOI] [PubMed] [Google Scholar]
- 19.Bouzakri K., Zierath J. R. (2007) J. Biol. Chem. 282, 7783–7789 [DOI] [PubMed] [Google Scholar]
- 20.Plomgaard P., Bouzakri K., Krogh-Madsen R., Mittendorfer B., Zierath J. R., Pedersen B. K. (2005) Diabetes 54, 2939–2945 [DOI] [PubMed] [Google Scholar]
- 21.Zohn I. E., Li Y., Skolnik E. Y., Anderson K. V., Han J., Niswander L. (2006) Cell 125, 957–969 [DOI] [PubMed] [Google Scholar]
- 22.Elion E. A. (2000) Curr. Opin. Microbiol. 3, 573–581 [DOI] [PubMed] [Google Scholar]
- 23.Aouadi M., Tesz G. J., Nicoloro S. M., Wang M., Chouinard M., Soto E., Ostroff G. R., Czech M. P. (2009) Nature 458, 1180–1184 [DOI] [PMC free article] [PubMed] [Google Scholar]
- 24.Rouiller D. G., Cirulli V., Halban P. A. (1991) Dev. Biol. 148, 233–242 [DOI] [PubMed] [Google Scholar]
- 25.Bosco D., Meda P., Halban P. A., Rouiller D. G. (2000) Diabetes 49, 233–243 [DOI] [PubMed] [Google Scholar]
- 26.Parnaud G., Bosco D., Berney T., Pattou F., Kerr-Conte J., Donath M. Y., Bruun C., Mandrup-Poulsen T., Billestrup N., Halban P. A. (2008) Diabetologia 51, 91–100 [DOI] [PubMed] [Google Scholar]
- 27.Yermen B., Tomas A., Halban P. A. (2007) Diabetes 56, 80–87 [DOI] [PubMed] [Google Scholar]
- 28.Hägerkvist R., Mokhtari D., Myers J. W., Tengholm A., Welsh N. (2005) Ann. N.Y. Acad. Sci. 1040, 114–122 [DOI] [PubMed] [Google Scholar]
- 29.Ribaux P., Ehses J. A., Lin-Marq N., Carrozzino F., Böni-Schnetzler M., Hammar E., Irminger J. C., Donath M. Y., Halban P. A. (2007) Endocrinology 148, 5582–5590 [DOI] [PubMed] [Google Scholar]
- 30.Kulkarni R. N., Roper M. G., Dahlgren G., Shih D. Q., Kauri L. M., Peters J. L., Stoffel M., Kennedy R. T. (2004) Diabetes 53, 1517–1525 [DOI] [PubMed] [Google Scholar]
- 31.Withers D. J., Gutierrez J. S., Towery H., Burks D. J., Ren J. M., Previs S., Zhang Y., Bernal D., Pons S., Shulman G. I., Bonner-Weir S., White M. F. (1998) Nature 391, 900–904 [DOI] [PubMed] [Google Scholar]
- 32.Kahn S. E., Hull R. L., Utzschneider K. M. (2006) Nature 444, 840–846 [DOI] [PubMed] [Google Scholar]
- 33.Ferrannini E. (2007) J. Clin. Endocrinol. Metab. 92, 396–398 [DOI] [PubMed] [Google Scholar]
- 34.Pradhan A. D., Manson J. E., Rifai N., Buring J. E., Ridker P. M. (2001) JAMA 286, 327–334 [DOI] [PubMed] [Google Scholar]
- 35.Freeman D. J., Norrie J., Caslake M. J., Gaw A., Ford I., Lowe G. D., O'Reilly D. S., Packard C. J., Sattar N. (2002) Diabetes 51, 1596–1600 [DOI] [PubMed] [Google Scholar]
- 36.Duncan B. B., Schmidt M. I., Pankow J. S., Ballantyne C. M., Couper D., Vigo A., Hoogeveen R., Folsom A. R., Heiss G. (2003) Diabetes 52, 1799–1805 [DOI] [PubMed] [Google Scholar]
- 37.Donath M. Y., Størling J., Berchtold L. A., Billestrup N., Mandrup-Poulsen T. (2008) Endocr. Rev. 29, 334–350 [DOI] [PubMed] [Google Scholar]
- 38.Donath M. Y., Schumann D. M., Faulenbach M., Ellingsgaard H., Perren A., Ehses J. A. (2008) Diabetes Care 31, Suppl. 2, S161–S164 [DOI] [PubMed] [Google Scholar]
- 39.McKenzie M. D., Carrington E. M., Kaufmann T., Strasser A., Huang D. C., Kay T. W., Allison J., Thomas H. E. (2008) Diabetes 57, 1284–1292 [DOI] [PubMed] [Google Scholar]
- 40.Ortis F., Pirot P., Naamane N., Kreins A. Y., Rasschaert J., Moore F., Théâtre E., Verhaeghe C., Magnusson N. E., Chariot A., Orntoft T. F., Eizirik D. L. (2008) Diabetologia 51, 1213–1225 [DOI] [PubMed] [Google Scholar]
- 41.Eizirik D. L., Colli M. L., Ortis F. (2009) Nat. Rev. Endocrinol. 5, 219–226 [DOI] [PubMed] [Google Scholar]
- 42.Ohsugi M., Cras-Méneur C., Zhou Y., Bernal-Mizrachi E., Johnson J. D., Luciani D. S., Polonsky K. S., Permutt M. A. (2005) J. Biol. Chem. 280, 4992–5003 [DOI] [PubMed] [Google Scholar]
- 43.Kubota N., Terauchi Y., Tobe K., Yano W., Suzuki R., Ueki K., Takamoto I., Satoh H., Maki T., Kubota T., Moroi M., Okada-Iwabu M., Ezaki O., Nagai R., Ueta Y., Kadowaki T., Noda T. (2004) J. Clin. Invest. 114, 917–927 [DOI] [PMC free article] [PubMed] [Google Scholar]
- 44.Lawrence M., Shao C., Duan L., McGlynn K., Cobb M. H. (2008) Acta Physiol (Oxf). 192, 11–17 [DOI] [PubMed] [Google Scholar]
- 45.Tomas A., Yermen B., Min L., Pessin J. E., Halban P. A. (2006) J. Cell Sci. 119, 2156–2167 [DOI] [PubMed] [Google Scholar]
- 46.Deshmukh A., Coffey V. G., Zhong Z., Chibalin A. V., Hawley J. A., Zierath J. R. (2006) Diabetes 55, 1776–1782 [DOI] [PubMed] [Google Scholar]
- 47.Jiang Z. Y., Zhou Q. L., Holik J., Patel S., Leszyk J., Coleman K., Chouinard M., Czech M. P. (2005) J. Biol. Chem. 280, 21622–21628 [DOI] [PubMed] [Google Scholar]
- 48.Gual P., Le Marchand-Brustel Y., Tanti J. (2003) Diabetes Metab. 29, 566–575 [DOI] [PubMed] [Google Scholar]
- 49.Morino K., Neschen S., Bilz S., Sono S., Tsirigotis D., Reznick R. M., Moore I., Nagai Y., Samuel V., Sebastian D., White M., Philbrick W., Shulman G. I. (2008) Diabetes 57, 2644–2651 [DOI] [PMC free article] [PubMed] [Google Scholar]
- 50.Zhang J., Gao Z., Yin J., Quon M. J., Ye J. (2008) J. Biol. Chem. 283, 35375–35382 [DOI] [PMC free article] [PubMed] [Google Scholar]
- 51.Bertazza L., Mocellin S. (2008) Front Biosci. 13, 2736–2743 [DOI] [PubMed] [Google Scholar]
- 52.Favata M. F., Horiuchi K. Y., Manos E. J., Daulerio A. J., Stradley D. A., Feeser W. S., Van Dyk D. E., Pitts W. J., Earl R. A., Hobbs F., Copeland R. A., Magolda R. L., Scherle P. A., Trzaskos J. M. (1998) J. Biol. Chem. 273, 18623–18632 [DOI] [PubMed] [Google Scholar]
- 53.Machida N., Umikawa M., Takei K., Sakima N., Myagmar B. E., Taira K., Uezato H., Ogawa Y., Kariya K. (2004) J. Biol. Chem. 279, 15711–15714 [DOI] [PubMed] [Google Scholar]


