Abstract
The calcium regulatory protein calmodulin (CaM) binds in a calcium-dependent manner to numerous target proteins. The calmodulin-binding domain (CaMBD) region of Nicotiana tabacum MAPK phosphatase has an amino acid sequence that does not resemble the CaMBD of any other known Ca2+-CaM-binding proteins. Using a unique fusion protein strategy, we have been able to obtain a high resolution solution structure of the complex of soybean Ca2+-CaM4 (SCaM4) and this CaMBD. Complete isotope labeling of both parts of the complex in the fusion protein greatly facilitated the structure determination by NMR. The 12-residue CaMBD region was found to bind exclusively to the C-lobe of SCaM4. A specific Trp and Leu side chain are utilized to facilitate strong binding through a novel “double anchor” motif. Moreover, the orientation of the helical peptide on the surface of Ca2+-SCaM4 is distinct from other known complexes. The N-lobe of Ca2+-SCaM4 in the complex remains free for additional interactions and could possibly act as a calcium-dependent adapter protein. Signaling through the MAPK pathway and increases in intracellular Ca2+ are both hallmarks of the plant stress response, and our data support the notion that coordination of these responses may occur through the formation of a unique CaM-MAPK phosphatase multiprotein complex.
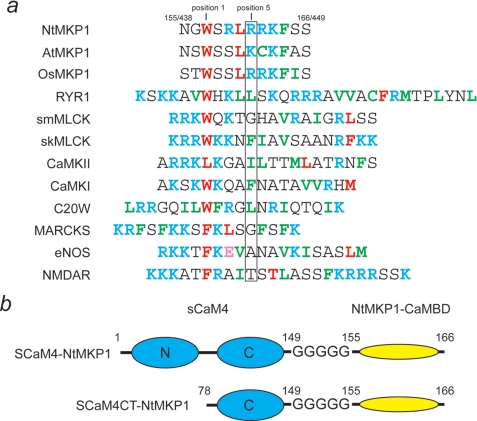
Calmodulin (CaM)2 is a ubiquitous intracellular Ca2+ sensor protein that plays an essential role in various Ca2+ signaling pathways. Contiguous and unique CaM-binding domain (CaMBD) regions are found widely distributed in many different types of CaM target proteins including protein phosphatases and kinases, cytoskeletal proteins, ion channels, and pumps (1, 2). Even though the CaMBD from various proteins share relatively poor amino acid sequence similarity, the majority of CaMBD become α-helical upon binding to CaM, and they can be grouped into either the 1-5-10 or the 1-8-14 motif, where the first and the last number indicate the position of two hydrophobic anchor residues that attach the CaMBD to the two binding pockets of the bilobal Ca2+-CaM. However, several noncanonical classes of CaMBD have also been identified. For example, in the CaMBD of the MARCKS protein, the two anchor residues are separated by a single amino acid residue (3). On the other hand, in the recently determined crystal structure of Ca2+-CaM complexed with the CaMBD of the skeletal muscle ryanodine receptor RYR1, they are separated by 15 residues (1–17 motif) (4). Bulky hydrophobic side chains of residues such as Trp, Leu, Phe, and Ile are most commonly utilized as anchor residues (see Fig. 1a), and these are usually deeply inserted into the hydrophobic target-binding pocket of either the N- or C-lobe of Ca2+-CaM. However, in several cases, including the N-methyl-d-aspartate receptors (NMDAR) (5) and the voltage-gated Ca2+ channels (Cav1–2) (6, 7), a polar side chain from Thr or Tyr has also been found to act as an anchor residue. In almost all Ca2+-CaM complexes studied to date, the two lobes of Ca2+-CaM become collapsed on the helical CaMBD, and they form a globular complex structure. An exception was found in the case of the Ca2+-CaM complex with an incomplete CaMBD from the plasma membrane Ca2+ pump (C20W), where only the C-lobe of Ca2+-CaM binds to the CaMBD, and the N-lobe was free in solution (8). The versatility of CaM target protein binding has been discussed in many recent reviews (for example, Refs. 2, 9–11).
FIGURE 1.
a, amino acid sequences of CaMBD from tobacco NtMKP1 (residues 438–449), Arabidopsis AtMKP1 (residues 451–462), and rice OsMKP1 (residues 456–467) are compared with various CaMBDs. The sequences are aligned at the position of the first hydrophobic anchor residue. The hydrophobic anchor residues are colored in red, while the other hydrophobic residues are shown in green. The basic residues and acidic residues are colored in cyan and pink, respectively. The residue numbers of the NtMKP1 sequence in SCaM4-NtMKP1/NtMKP1 protein are also indicated. b, schematic drawing of the two fusion proteins, SCaM4-NtMKP1 and SCaM4CT-NtMKP1.
In plant cells, Ca2+ signals, arising from various extracellular stimuli such as abiotic stresses, hormones, or phytopathogens are mediated by multiple CaM isoforms to create specific cellular responses. In contrast, only a single CaM protein exists in animal cells. For example, the model plant Arabidopsis thaliana has nine CaM genes (CaM1–9) encoding seven different CaM isoforms (12, 13). Five distinct CaM genes (SCaM1–5) encoding four different CaM proteins have been identified so far in the soybean genome (14). Despite the relatively high amino acid sequence identity among these CaM isoforms (50–90%), each isoform is utilized to regulate different target enzymes related to specific cellular responses (15, 16). For example, the expression of two soybean CaM isoforms, SCaM4 and 5 is markedly up-regulated after pathogen infection, and these two proteins can activate the enzyme nitric-oxide synthase (NOS) (17). Production of nitric oxide is thought to be one of the early events in the plant defense reactions (18, 19). On the other hand, SCaM1 is incapable of activation of the NOS enzyme, and it does in fact act as a competitive inhibitor. Likewise, in Nicotiana tabacum (tobacco), the CaM isoforms NtCaM1 and NtCaM13 are overexpressed in tobacco leaf tissue in response to wounding and the TMV-triggered hypersensitive reaction, respectively (20). Recently, we have addressed the question as to how distinct CaM isoforms can give rise to selectivity in their target regulation by determining the solution structures of the two soybean CaM isoforms, SCaM1 and SCaM4 (21). However, there are currently no structures available for plant CaM isoforms in a complex with a target CaMBD peptide, although many such complex structures have been determined for animal CaM. Therefore, determining the structure of plant CaM-target complexes and uncovering their unique features relative to those of animal CaM or other plant CaM isoforms will undoubtedly enhance our understanding of the CaM-target regulation mechanisms in plants and mammals.
The mitogen-activated protein kinase cascade (MAPK cascade) is an important signal transduction pathway in animals, yeast as well as in plants (22). The activity of MAPK is regulated via phosphorylation by its immediate upstream regulator, MAPK kinase (MAPKK). Following activation, MAPKs are dephosphorylated and inactivated by MAPK phosphatases. Recently, the MAPK phosphatase from tobacco (NtMKP1) was shown to be a novel plant-specific CaM-binding protein (23). This finding indicated a possible link between the MAPK cascade and Ca2+ signaling pathways in plant cells. The MAPK cascade is thought to play an important role in plant defense signaling, and the accumulation of Ca2+ in plant cells is also a well-known response to pathogens and other stresses (for recent reviews, see Refs. 24, 25). The putative CaMBD reported for NtMKP1 (residues 396–447) is located directly upstream of the conserved Ser-rich domain in the middle of the protein. Mutagenesis studies have revealed that Trp440 and Leu443 are indispensable for Ca2+-CaM binding. More recently, we have tested various truncated versions of the CaMBD of NtMKP1 and narrowed it down to 12 residues (residues 438–449) (Fig. 1a) that are sufficient for Ca2+-CaM binding (26). Interestingly, the NtMKP1 CaMBD does not belong to any of the typical CaM-binding motif classes. Binding assays using isothermal titration calorimetry (ITC) as well as NMR titration studies for various SCaM isoforms, and their half-lobe fragments have revealed a novel sequential target binding mechanism for the Ca2+-CaM isoforms. The first strong binding event involves the C-lobe of Ca2+-CaM and the reported binding constant for NtMKP1 peptide was 107–108 m−1. On the other hand, the binding of a second CaMBD of NtMKP1 occurs only through the N-lobe of Ca2+-CaM, and the binding constant was around 105 m−1 (26). To date, structural information about the manner in which Ca2+-CaM binds sequentially to the unusual amino acid sequence of the CaMBD of NtMKP1 is unavailable. Here, we have determined the solution NMR structure of the C-lobe fragment of SCaM4 (SCaM4CT) fused with the CaMBD of NtMKP1 (Fig. 1b). We have chosen SCaM4 over other SCaM isoforms, as the stress-induced SCaM4 would provide a more important connection between stress MAPK response and Ca2+ signaling. The interaction of the α-helical CaMBD of NtMKP1 with SCaM4CT domain is stabilized by hydrophobic interactions mainly through Trp440 and Leu443 in the NtMKP1 sequence. Moreover, the basic residue, Arg444 that is unusual at position 5 (Fig. 1a) stays outside of the hydrophobic patch, and it seems to form a unique hydrogen bond to Glu84 of the SCaM4CT domain. The resulting orientation of the α-helical CaMBD relative to the SCaM4CT domain is therefore very different from those seen in the other previously reported Ca2+-CaM-target complexes. We have also studied binding of a synthetic CaMBD peptide to intact Ca2+-SCaM4 fused at the C-terminal end with the CaMBD of NtMKP1 (Fig. 1b) providing additional information about the role of the N-lobe of Ca2+-SCaM4 in NtMKP1 binding. Furthermore, we have studied the interactions between the N-lobe of Ca2+-SCaM4 and a second potential CaMBD in the C-terminal region of NtMKP1.
EXPERIMENTAL PROCEDURES
Sample Preparation
SCaM4 and the C-lobe fragment of SCaM4 (SCaM4CT) (residues 78–149) were fused with the CaMBD of NtMKP1 (residues 438–449) using a poly-Gly linker (see Fig. 1b). These constructs were generated by standard PCR techniques. A primer that anneals to the 3′-end of the SCaM4 gene also contained codons for five extra Gly residues followed by the gene for the CaMBD of NtMKP1 was used to generate both constructs. The PCR products were subcloned into the pE-SUMO vector (LifeSensors, Inc., Malvern, PA) using NdeI/XhoI sites to generate pE-SUMO-SCaM4-NtMKP1 and pE-SUMO-SCaM4CT-NtMKP1 expression vectors. The SUMO-SCaM4-NtMKP1 and SUMO-SCaM4CT-NtMKP1 proteins were overexpressed in Echerichia coli, strain BL21 (DE3). To produce uniformly 15N- and 15N,13C-labeled fusion proteins, the bacteria were grown in M9 medium containing 0.5 g/liter 15NH4Cl and 3 g/liter 13C6-glucose (or unlabeled glucose). The fusion proteins were purified using a chelating Sepharose fast flow resin (GE Healthcare) charged with Ni2+ for immobilized metal affinity chromatography and cleaved by SUMO proteinase I (LifesSensors, Inc., Malvern, PA). The purified fusion proteins, SCaM4-NtMKP1 and SCaM4CT-NtMKP1 contained the cloning artifact “GHM” at their N terminus. 15N,13C-labeled SCaM4 was prepared as previously described (21). Hereafter, the residue numbers for the NtMKP1 sequence (residues 438–449) are indicated as the residue numbers found in SCaM4-NtMKP1 and SCaM4CT-NtMKP1 (residues 155–166) (Fig. 1). Two synthetic NtMKP1 peptides corresponding to the first CaMBD (residues 438–449) (NtMKP1pA: Ac-NGWSRLRRKFSS-NH2) and a second potential predicted CaMBD (residues: 814–835) (NtMKP1pB: Ac-GHVHWEKVGRRFLIQKGLATSS-NH2) were obtained commercially from Anaspec, Inc. (San Jose, CA) and GenScript, respectively.
All NMR samples contained ∼0.5 mm 15N- or 15N,13C-labeled SCaM4, SCaM4-NtMKP1 or SCaM4CT-NtMKP1, 5 mm CaCl2, 100 mm KCl, 0.03% NaN3, 0.5 mm 2,2-dimethyl-2-silapentane-5-sulfonate, and 20 mm Bis-Tris (pH 6.8) in 90% H2O,10% D2O or 99.9% D2O. In addition, 10 mm 2H-labeled dithiothreitol was also added into all samples except for the SCaM4CT-NtMKP1 sample to avoid dimerization caused by intermolecular disulfide bonding through the Cys26 residue. The sample used for residual dipolar coupling (RDC) measurements also contained extra 200 mm KCl and 16 mg/ml filamentous phage Pf1 (Asla Biotech Ltd.).
Protein concentrations were determined from the theoretical extinction coefficients (cm−1 m−1): ϵ280(sCaM4CT-NtMKP1) = ϵ280(sCaM4-NtMKP1) = 8480, ϵ280(NtMKP1pA) = ϵ280(NtMKP1pB) = 5500.
Isothermal Titration Calorimetry (ITC) Experiments
All ITC experiments were carried out on a Microcal VP-ITC microcalorimeter. All samples were dissolved in a buffer containing 20 mm HEPES (pH ∼7.5), 100 mm KCl, and 2 mm CaCl2. The syringe was filled with ∼0.5 mm NtMKP1pA or NtMKP1pB, which was injected into the ITC cell containing 20 μm sCaM4-NtMKP1 solutions at 30 °C. To avoid protein dimerization through disulfide bonding, sCaM4-NtMKP1 was incubated for 24 h in the buffer containing 10 mm dithiothreitol and desalted into ITC buffer using an Econo-Pac 10DG column immediately before the ITC experiments (27). The heat of dilution was measured separately by injecting the peptide into the ITC buffer. After subtraction of the heat of dilution, the data were fit to a one-site binding model (MicroCal Origin software) to obtain the binding constants.
NMR Measurements
All NMR experiments for the backbone assignments and the structure determination were performed at 30 °C on Bruker Avance 500 or 700 MHz NMR spectrometers equipped with triple resonance inverse Cryoprobes with a single axis z-gradient. Sequential assignments of HN, N, CO, Cα, and Cβ resonances of SCaM4-NtMKP1, SCaM4CT-NtMKP1, and SCaM4-NtMKP1-NtMKP1p were achieved using two dimensional 1H, 15N-HSQC and three-dimensional experiments including CBCANH, CBCA(CO)NH, HNCO, and HN(CO)CA. The side chain resonance assignments for SCaM4CT-NtMKP1 were achieved as follows. Aliphatic side chain assignments were obtained through various three-dimensional experiments including C(CCO)NH-TOCSY, H(CCO)NH-TOCSY, and HBHA(CBCACO)NH. The aromatic side chains were assigned using two-dimensional (HB)CB(CGCD)HD and two-dimensional (HB)CB(CGCDCE)HE experiments (28). In addition, unambiguous assignments of the methyl groups of the Met side chains were derived from three-dimensional HMBC and three-dimensional LRCH experiments by recording the long-range correlations between the Hϵ/Cϵ and Hγ/Cγ atoms (29). All NOESY experiments for the structure determination of SCaM4CT-NtMKP1 including the three-dimensional 15N-NOESY-HSQC, three-dimensional 13C-NOESY-HSQC, and three-dimensional 13C-NOESY-HSQC (aromatic) were measured with a mixing time of 100 ms. Met-edited spectra were obtained for the uniformly 15N,13C-labeled proteins using the 1H,13C-constant-time (ct)-HSQC with a J evolution time of 15 ms. Backbone H-N RDC measurements were performed using the in-phase/anti-phase 1H,15N-HSQC experiment (30). All NMR experiments for the backbone dynamics studies for 15N-labeled SCaM4-NtMKP1 and SCaM4CT-NtMKP1 were collected at 30 °C at a 15N frequency of 50.68 MHz. The 15N T1 data were acquired using 15N relaxation delays of 14, 98, 350, 490, 700, 896, and 1190 ms. The 15N T2 relaxation data were obtained using a Carr-Purcell-Meiboom-Gill (CPMG)-type T2 experiments, where the field strength of the 1800 pulse was 5.6 kHz, and the 1800 pulses were applied every 1 ms. For the 15N T2 measurement, relaxation delays of 6.54, 13.08, 32.70, 52.32, 71.94, 91.56, 111.18, and 137.34 ms were used. Both T1 and T2 experiments were collected twice to estimate the uncertainty in the peak intensity (see below). {1H}-15N heteronuclear NOE data were obtained using a 5-s train of 1200 proton pulses. The chemical shift difference in HSQC spectrum was calculated as the weighted average chemical shift difference of the 1H and 15N resonances (31). All spectra were processed using the program NMRPipe (32) and analyzed using the NMRView software (33).
Structure Calculation
The structures of SCaM4CT-NtMKP1 were initially calculated with CYANA (34) version 2.0 using distance restraints obtained from the automatic NOE assignment protocol implemented in CYANA, hydrogen bond restraints based on the secondary structure from the chemical shift index (CSI), and dihedral angle restraints predicted by TALOS (35). A total of 12 Ca2+-ligand restraints were also introduced according to the well-known Ca2+ coordination motifs for EF-hand proteins (36). Further structural refinement with the addition of backbone H-N RDC restraints were undertaken by XPLOR-NIH (37) version 2.19. Initial estimation for the axial component of the molecular alignment tensor (Da) and the rhombicity (R) were obtained based on the lowest energy structure calculated by CYANA using PALES (38). Finally, the 30 lowest energy structures from a total of 200 were selected and used for the analysis. The structures were validated by the program PROCHECK (39). All molecular graphics used in this report are created using MOLMOL (40).
Rotational Diffusion Analysis
The 15N T1 and T2 data were fitted with the program CurveFit (A. G. Palmer, Columbia University). The standard deviation of the peak intensity between two duplicated spectra was calculated for each signal at each time point. Those values are averaged over all the signals and used as the uncertainty of the peak intensity. The {1H}-15N heteronuclear NOE values were determined by measuring the ratio of the peak heights in spectra acquired with and without 1H saturation. The uncertainty for NOE values was evaluated using the standard deviation of the noise in empty spectral regions of the spectra (41). Residues that show low NOE values (below 0.65) were excluded from further analysis, because these residues have a slow internal motion which contributes to their T1 relaxation. For the remaining residues, those which are involved in a chemical exchange process that affects their T2 relaxation time were detected by the following criterion (42) in Equation 1,
where S.D. is the standard deviation of the values for the left side for all residues. The residues that did not satisfy the inequality were eliminated. For the remainder, the rotational correlation time for the global tumbling (τm) for each residue was estimated from the R2/R1 ratio using program R2R1_tm (A. G. Palmer, Columbia University). The τm values for the N-lobe (residues 1–77) and the C-lobe (78–149/166) were globally fit using the structures of the N-lobe of SCaM4 (PDB code: 2ROA; Ref. 21) and SCaM4CT-NtMKP1 (determined in this report), respectively, to the three different diffusion models including isotropic, axially symmetric, and anisotropic diffusion model with the program quadric_diffusion (A. G. Palmer, Columbia University).
RESULTS
Structure Determination of SCaM4CT-NtMKP1
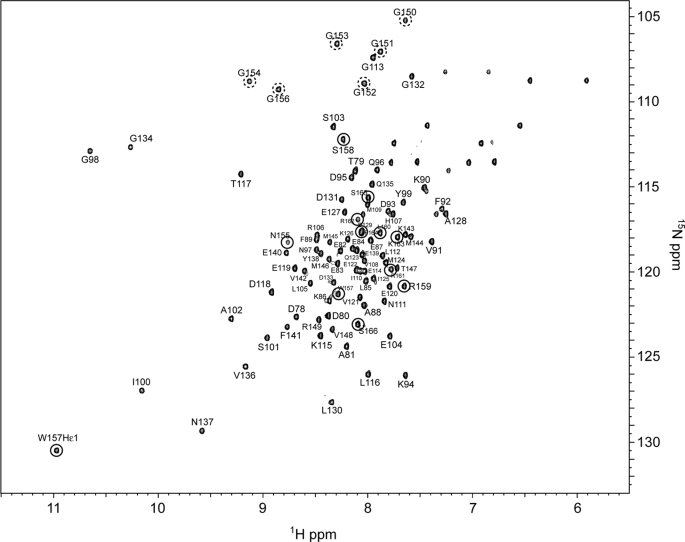
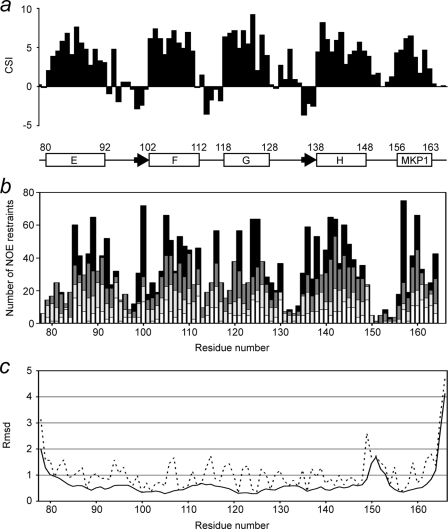
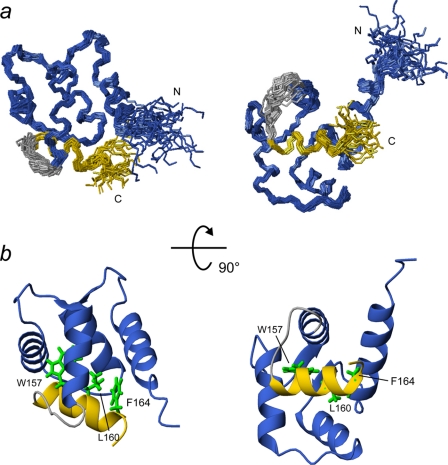
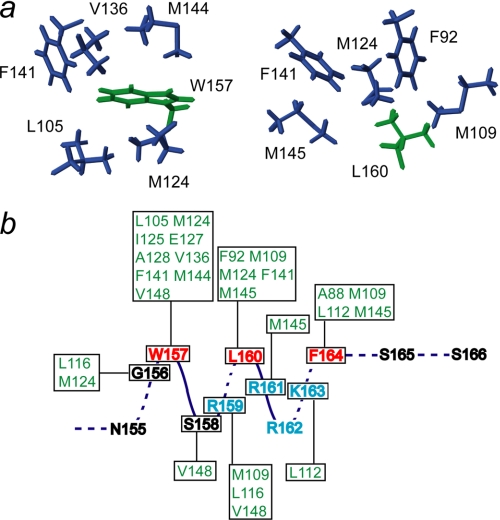
All backbone amide resonances of Ca2+-bound SCaM4CT-NtMKP1 except for the three N-terminal residues (75–77) corresponding to the cloning artifact were unambiguously assigned in the HSQC spectrum (Fig. 2). The amide signals from the NtMKP1 domain are fairly well separated and show similar intensities to those from the SCaM4CT domain, suggesting that the NtMKP1 domain is well-folded and bound to the SCaM4CT domain. The CSI analysis using Cα and C′ atoms reveal that the bound NtMKP1 domain adopts a helical conformation (Fig. 3a). On the other hand, the SCaM4CT domain maintains the same secondary elements with those of SCaM4 (21). The side chain assignments could be obtained for 97.7% of the total 1H resonances. The initial structures were calculated using torsion angle dynamics and the automated NOE assignment protocol of CYANA. Initially, 2249 NOE cross-peaks were manually identified in the three-dimensional 15N- and 13C-NOESY-HSQC spectra. 2198 NOE cross-peaks were automatically assigned by CYANA, and this generated 1383 upper distance restraints. The distribution of the distance restraints over the residues is displayed in Fig. 3b. The backbone r.m.s.d. for the well-folded region (residues 80–163) of the calculated 25 structures with the lowest CYANA target function value was 0.45 ± 0.06 Å. The average r.m.s.d. from all distance restraints and the dihedral angle restraints violations were 0.0049 ± 0.0008 Å and 0.11 ± 0.040, respectively. To determine accurate helix orientations, backbone H-N RDC restraints were employed in further refinements of the structure with the program XPLOR-NIH. The RDC values were successfully measured for all the residues which include 12 residues from the fused NtMKP1 domain and ranged between −26.1 and 27.8 Hz with a digital resolution of 1.65 Hz. The backbone r.m.s.d for the well-folded region (residues 80–163) of the calculated 30 structures with the lowest energy was 0.51 ± 0.08 Å, whereas the average backbone r.m.s.d value of the poly-Gly linker region (residues 150–154) connecting the SCaM4CT and NtMKP1 domains was 1.20 ± 0.42 Å (Fig. 3c). A total of 94.1% of the residues were found in the favored region of the PROCHECK Ramachandran plot and the remaining residues were all found in the additionally allowed regions. All the structural parameters from the final stage of the structure calculation are summarized in supplemental Table S1. SCaM4CT-NtMKP1 consists of four α-helices and one small β-sheet in the SCaM4CT domain that form a pair of EF-hand motifs and a single short α-helix in NtMKP1 domain (Figs. 3a and 4). As expected, the α-helical NtMKP1 domain interacts with the hydrophobic target-binding patch of the SCaM4CT domain, where the main hydrophobic interactions occur through the side chains of Trp157 and Leu160; the side chains of these two residues are deeply inserted into the hydrophobic pocket of SCaM4CT (Figs. 4b and 5a). A number of interdomain NOE were observed between these side chains and the hydrophobic side chains of the SCaM4CT domain (Fig. 5b). Another hydrophobic residue in the NtMKP1 domain, Phe164 is located at the border of the hydrophobic target-binding patch of SCaM4CT and also contributes to the interaction (Figs. 4b and 5b).
FIGURE 2.
1H,15N-HSQC spectrum of Ca2+-SCaM4CT-NtMKP1 with assignments indicated. The signals originating from the NtMKP1 domain and the poly-Gly linker region are circled by a solid and a dashed line, respectively.
FIGURE 3.
Structural data for SCaM4CT-NtMKP1. a, CSI data. The chemical shift deviations from random coil for the backbone Cα and C' atoms are added and plotted as a function of the residue number. The secondary structures obtained from the calculated structure are also shown. The boxes and arrows indicate the positions of the five α-helices and two β-strands. b, number of upper distance restraints used for the structure calculation are shown as a function of the residue number. White, gray, dark gray, and black bars indicated the number of intraresidue, sequential, medium range (2–4), and long range (5+) restraints, respectively. The top of each column represents the total number of the upper distance restraints, where the length of each color segment indicates the number of upper distance restraints for each range. c, r.m.s.d. values for the backbone and all the heavy atoms are shown with a solid and dashed line, respectively.
FIGURE 4.
a, backbones of 30 structures of SCaM4CT-NtMKP1 are superimposed for the well-folded region (residue 80–163). The SCaM4CT and NtMKP1 domain are shown in navy and yellow, respectively, while the poly-Gly linker region is shown in gray. b, ribbon representations of the structure with the lowest energy. The hydrophobic side chains of Trp157, Leu160, and Phe164 are displayed.
FIGURE 5.
a, local interactions between SCaM4CT residues and the anchor residues of the NtMKP1 domain, Trp157 and Leu160. The side chains of the SCaM4CT and NtMKP1 domains are colored in purple and green, respectively. b, schematic showing observed NOEs between SCaM4CT and NtMKP1 domain.
Spectral Comparisons of SCaM4CT-NtMKP1 with SCaM4-NtMKP1 and SCaM4-NtMKP1-NtMKP1p
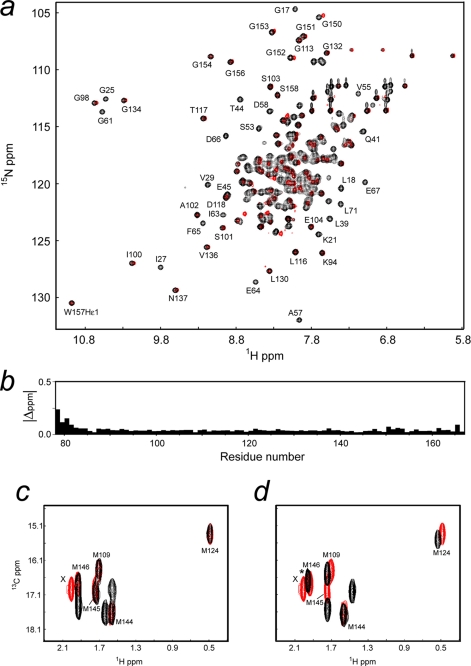
The backbone assignments of Ca2+-bound SCaM4-NtMKP1 was achieved using the same procedure as used for SCaM4CT-NtMKP1. 98% of the backbone amide signals except for Pro43 in the HSQC spectrum were assigned, while several residues on the N-terminal part of the first helix (residues 9–11) were not identified in the spectrum probably due to significant resonance broadening. The HSQC spectra of SCaM4CT-NtMKP1 and SCaM4-NtMKP1 are overlaid in Fig. 6a. The chemical shift differences are then plotted as a function of the residue number in Fig. 6b. Except for several residues in the N-terminal region of SCaM4CT-NtMKP1, there are no significant chemical shift changes, which indicate that SCaM4CT-NtMKP1 maintains the same structure as that found in the intact fusion protein SCaM4-NtMKP1. Further evidence in support of this conclusion is that all five methyl signals of the Met residues in SCaM4CT-NtMKP1 can be perfectly overlaid with those from SCaM4-NtMKP1 (Fig. 6c). We have also confirmed that the covalent SCaM4CT-NtMKP1 construct forms the same complex structure as the noncovalent SCaM4/NtMKP1p complex. Fig. 6d shows a superposition of the ct-HSQC spectra of the SCaM4CT-NtMKP1 fusion and the noncovalent SCaM4/NtMKP1p complex. All the methyl signals from the five Met residues, with the exception of Met145, are in the same positions in both spectra.
FIGURE 6.
a, superposed 1H,15N-HSQC spectra of SCaM4CT-NtMKP1 (red) and SCaM4-NtMKP1 (black). The assignments for the well separated signals are indicated. Chemical shift differences for 1H and 15N atoms are then plotted as the function of residue number (b). c, superposed ct-HSQC spectra of SCaM4CT-NtMKP1 (red) and SCaM4-NtMKP1 (black). d, superposed ct-HSQC spectra of SCaM4CT-NtMKP1 (red) and SCaM4 complexed with a NtMKP1p (black). In panels c and d, the signal assigned as X originates from the Met residue in the cloning artifact. In panel d, the peak volume of the black signal marked with an asterisk is almost double that of the other signals, suggesting that two signals are overlapping.
Structural Comparison of SCaM4CT-NtMKP1 with Other Ca2+-CaM-Target Complexes
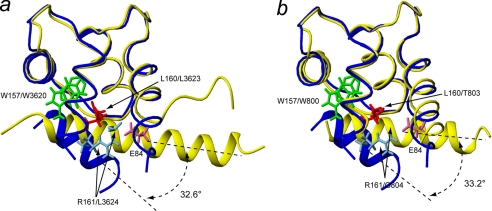
Fig. 7 shows a superimposition of the ribbon representations of structures of SCaM4CT-NtMKP1 and the crystal structures of Ca2+-bound CaM complexed with the CaMBD from RYR1 (PDB code: 2BCX, Ref. 4) and smooth muscle myosin light chain kinase (smMKCK) (PDB code: 1CDL, Ref. 43). Only the C-lobes of CaM (residues 78–148) and their respective CaMBD are displayed. The structures of the C-lobe of CaM and SCaM4CT domain are very similar, where the backbone r.m.s.d. values for the RYR1 and smMLCK complexes for the well-folded regions (residues 85–145) are 0.91 and 0.96 Å, respectively. The conserved Trp residues in the N-terminal regions of these CaMBD form very similar hydrophobic contacts in the hydrophobic pocket of CaM and the SCaM4CT domain. The orientation of the α-helical-NtMKP1 domain relative to the SCaM4CT domain is, however, distinct from those seen in the CaM complexes. The calculated differences in angles are 32.5° and 30.0° compared with the RYR1 and the smMLCK complex, respectively. The results of this analysis using several other available crystal structures for Ca2+-CaM-CaMBD complexes are summarized in supplemental Table S2.
FIGURE 7.
Structural comparison of SCaM4CT-NtMKP1 with the CaM complexes with the CaMBD from RYR1 (a) and smMLCK (b). Only the C-lobes of CaM (residues 78–149) and the bound CaMBDs are displayed. In both panels, SCaM4CT-NtMKP1 is shown in navy and the other complexes are shown in yellow. The side chains of the two anchor residues of SCaM4CT-NtMKP1, Trp157 and Leu160, and Arg161 that forms a hydrogen bond to Glu84 are shown. The residues at positions 1, 4, and 5 (see Fig. 1) are shown in green, red, and cyan, respectively, in all the complexes, while Glu84 is colored magenta.
Rotational Diffusion Analysis of SCaM4CT-NtMKP1 and SCaM4-NtMKP1
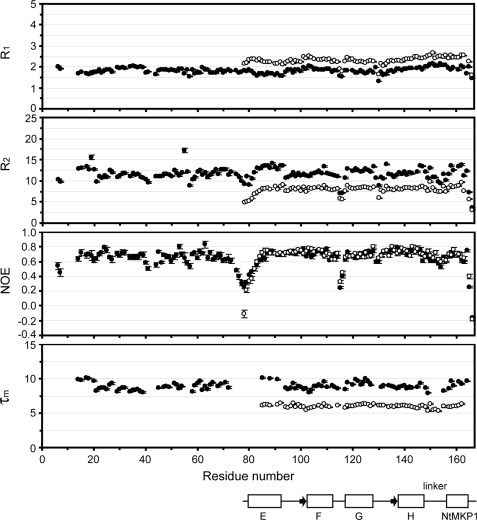
15N relaxation data were available for 95.5% of all the residues in SCaM4CT-NtMKP1, whereas only 87.9% of total residues could be analyzed for SCaM4-NtMKP1 due to overlapping resonances (Fig. 8). After filtration of the relaxation data (see “Experimental Procedures”), 74.2 and 55.8% of the total residues remained for analyzing the rotational diffusion properties of SCaM4CT-NtMKP1 and SCaM4-NtMKP1, respectively. The τm values that were estimated from the R2/R1 ratio ranged between 5.3 and 6.5 ns for SCaM4CT-NtMKP1, while they varied between 7.8 and 10.1 ns for SCaM4-NtMKP1 (Fig. 8). The resulting averaged errors for the τm values used for the diffusion analysis were 0.9 and 0.7% for SCaM4CT-NtMKP1 and SCaM4-NtMKP1, respectively. After fitting the τm data to three different diffusion models, it was found that the axially symmetric model, which describes the rotation of an ellipsoid-shaped molecule, provided a significant improvement over the isotropic model, which describes the rotation of a globular spherical molecule. This was observed for both the N- and C-lobes of SCaM4-NtMKP1, and SCaM4CT-NtMKP1. On the other hand, the anisotropic diffusion model, which describes an asymmetrically shaped molecule showed only a small improvement over the axially symmetric model. For example, the F-test value was 8.63 (p = 1.3 × 10⁻⁵) and 0.31 (p = 0.93) for the axially symmetric and the anisotropic model for SCaM4CT-NtMKP1 (residues 78–166), respectively. These results indicate that the axially symmetric model best describes the rotational dynamics in solution of all three structures analyzed. The parameters obtained from this analysis are summarized in supplemental Table S3.
FIGURE 8.
15N relaxation data for SCaM4CT-NtMKP1 (open circle) and SCaM4-NtMKP1 (filled circle). The correlation time of global tumbling (τm) is calculated from the R2/R1 ratio. The positions of the secondary elements of SCaM4CT-NtMKP1 structure are shown in the same definition with Fig. 3.
Titration of SCaM4-NtMKP1 with NtMKP1pA and NtMKP1pB Synthetic Peptides
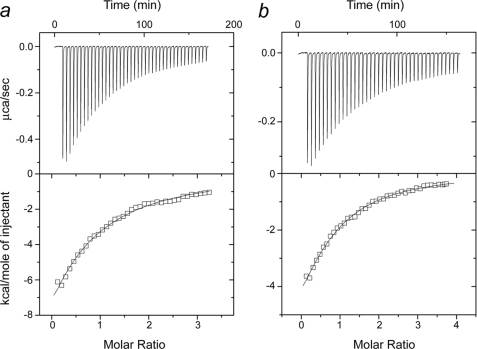
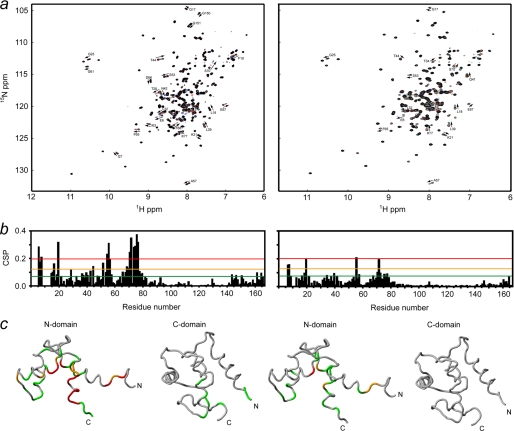
The binding of synthetic NtMKP1 peptides to the N-lobe of SCaM4-NtMKP1 was monitored by ITC experiments (Fig. 9). Both peptides exhibited a similar exothermic interaction with SCaM4-NtMKP1. The binding constants are (2.9 ± 0.3) ×104 m−1 and (4.6 ± 0.3) ×104 m−1 for NtMKP1pA and NtMKP1pB, respectively. To obtain more detailed information, chemical shift changes in the HSQC spectra of SCaM4-NtMKP1 that are caused by the addition of NtMKP1pA or NtMKP1pB were monitored (Fig. 10a). In both titrations, the signals shift in a typical fast exchange manner (on the NMR time scale), which represents relatively weak binding of the two NtMKP1 peptides to SCaM4-NtMKP1, which is consistent with the binding constants derived from ITC experiments. The chemical shift changes were essentially completed when 1.2 mol of NtMKP1 peptides per mol of SCaM4-NtMKP1 was added, suggesting a 1:1 binding stoichiometry in both cases. The CSP values are plotted as a function of the residue number in Fig. 10b. The results for the two NtMKP1 peptides are very similar except that the magnitude of CSP observed in NtMKP1pB binding is much smaller than that for NtMKP1pA binding. It is clear that all the residues with a larger CSP value are found in the N-lobe of SCaM4-NtMKP1. On the other hand, small but obvious CSP are also seen in the C-lobe of full-length SCaM4-NtMKP1 (Fig. 10b). The residues with a relatively large CSP value were highlighted on the structures of the N-lobe of SCaM4 (PDB code: 2ROA, Ref. 21) and SCaM4CT-NtMKP1 (Fig. 10c). It seems that both NtMKP1pA and NtMKP1pB mainly interact with the hydrophobic target-binding patch of the N-lobe of SCaM4, whereas smaller CSPs were also detected for the regions around the NtMKP1p domain in the C-lobe. The atomic coordinates for SCaM4CTMKP1 structure have been deposited in the Protein Data Bank as 2KN2.
FIGURE 9.
ITC experiments with SCaM4-NtMKP1 and NtMKP1 peptides. The top panels show the base line-corrected raw calorimetric traces of SCaM4-NtMKP1 with NtMKP1pA (a) and NtMKP1pB (b). The bottom panels are the derived binding isotherms for the SCaM4-NtMKP1 binding to NtMKP1pA (a) and NtMKP1pB (b). All experiments were performed at 30 °C, 100 mm KCl, 2 mm CaCl2, 20 mm HEPES (pH 7.5).
FIGURE 10.
CSPs caused by the addition of NtMKP1pA (left) or NtMKP1pB (right) monitored by 1H,15N-HSQC spectrum of SCaM4-NtMKP1. a, spectra of SCaM4-NtMKP1 acquired with 0.0 (black), 0.4 (red), 0.8 (green), and 1.2 (purple) molar equivalents of NtMKP1 peptides are overlaid. The separated signals with clear CSP are labeled. b, The CSP values are plotted as the function of residue number. c, the residues with CSP larger than 0.2 (red), 0.12 (orange), and 0.07 (green) are highlighted on the structure. The N- and C-lobe structures used are 2ROA and SCaM4CT-NtMKP1, respectively.
DISCUSSION
The vast majority of the NMR studies reported to date for Ca2+-CaM complexes with peptides encompassing CaMBD regions of various target proteins have relied on isotope-labeled biosynthetically expressed proteins and chemically synthesized non-labeled peptides. However, in our initial attempts to determine a high-resolution solution structure for Ca2+-SCaM4 in complex with the synthetic NtMKP1p peptide, we encountered significant difficulties following the same strategy because of the presence of several broad signals, as well as the absence of signals for some protein residues; moreover, the presence of NMR signals arising from a minor bound peptide conformation complicated matters further.3 To overcome these problems, in this work, we have adopted a novel fusion approach to determine the solution structure of the Ca2+-SCaM4-NtMKP1pA complex. Because our previous results had clearly shown that the first equivalent of the NtMKP1pA binds only to the C-lobe of SCaM4 (26), we decided to fuse the NtMKP1pA sequence to the C-terminal end of the C-lobe fragment of SCaM4 using a 5-residue poly-Gly linker (Fig. 1b). From spectral comparisons between SCaM4CT-NtMKP1 and SCaM4-NtMKP1, it seems that the shorter SCaM4CT-NtMKP1 fusion retains the same structure as that seen in the full-length SCaM4-NtMKP1 construct (Fig. 6, a–c). Also the assignments obtained for the N-lobe of the full-length SCaM4-NtMKP1 protein are identical to those for the unliganded protein (see Ref. 21) except for the N-terminal part (see below), suggesting that the N-lobe is not influenced by the binding of the NtMKP1 region.
To test whether the N-lobe of SCaM4 is completely independent from the C-lobe of SCaM4 bound to the NtMKP1 domain as was suggested previously for Ca2+-CaM bound to the C20W peptide (8), we have undertaken a rotational diffusion analysis for the two lobes of SCaM4-NtMKP1. The τm values obtained were 8.73 ± 0.01 and 8.98 ± 0.01 ns for the N-lobe and the C-lobe bound to the NtMKP1 domain, respectively (supplemental Table S3). The difference in the τm values between the two lobes is small but decidedly larger than the errors, which indicates that the two lobes are indeed moving independently in solution. However, the τm value for the N-lobe is much larger than the previously reported τm value for the N-lobe of Ca2+-CaM (7.12 ns) (44). In addition, the signals for several residues from the N-terminal part of the N-lobe (residues 9–11) were not identified in the HSQC spectrum of SCaM4-NtMKP1, probably because of significant broadening due to chemical exchange. Therefore, we conclude that there is a weak interaction between the two lobes that affects neither the global structure of the C-lobe bound to the NtMKP1 domain nor the secondary interaction with the NtMKP1pA peptide. This interaction is likely caused by the negatively charged N-terminal portion of the N-lobe and the exposed basic surface area of the NtMKP1 domain. On the other hand, the τm value obtained for the shorter SCaM4CT-NtMKP1 construct is 6.02 ns and the D‖/D⊥ ratio is 1.13, suggesting a more isotropic rotation than observed for the full-length SCaM4-NtMKP1 fusion in solution (supplemental Table S3).
Whereas the CaMBD synthetic peptides or protein fragments in previous NMR studies were not isotope-labeled, the NtMKP1 domain of the SCaM4CT-NtMKP1 fusion construct becomes biosynthetically labeled during protein expression which allowed us to perform unambiguous chemical shift assignments for the NtMKP1 region (Fig. 2). These were then used for subsequent CSI analysis (Fig. 3) as well as the TALOS dihedral angle predictions and backbone RDC and dynamics studies (Fig. 8), all of which cannot be done for non-labeled peptides. In the SCaM4CT-NtMKP1 fusion protein, no signals were observed for minor complex conformations probably because the interaction of the NtMKP1 domain was restricted to that of the major conformer by the insertion of the poly-Gly linker. In addition, there were no broad signals and all the amide signals from the SCaM4CT domain were clearly seen in the HSQC spectrum of SCaM4CT-NtMKP1 (Fig. 3). In the course of our work we also noted that these fusion proteins seem to prevent aggregation, and that they provided more stable NMR samples than the regular noncovalent Ca2+-CaM CaMBD-peptide complexes. Previously, Jia and coworkers (45) have determined a crystal structure for Ca2+-CaM fused with the CaMBD of calcineurin via a poly-Gly linker and they uncovered a unique complex, in which CaM forms a “head to tail” dimer through the two bound CaMBDs. More recently, the same group has demonstrated that the crystal structures of their CaM fusion protein and that of the complex with a noncovalently bound CaMBD peptide were essentially identical (Cα r.m.s.d.: 0.96 Å) (46). Indeed, many CaM-CaMBD peptide complexes can be relatively easily designed as a fusion protein because the orientation of the CaMBD peptide relative to CaM is antiparallel in the majority of the complexes (11), where the C-terminal end of CaM and the N-terminal region of the CaMBD peptide are in close proximity. To confirm that our covalent SCaM4CT-NtMKP1 fusion adopted the same structure to that found in the noncovalent SCaM4/NtMKP1pA complex, we compared the positions of the methyl signals of the Met residues from SCaM4CT-NtMKP1 with those from the SCaM4/NtMKP1pA complex (Fig. 6d). Because all the side chains of the Met residues in CaM (except for Met76 in the central linker) form direct hydrophobic contacts with the CaMBDs in most Ca2+-CaM-target complexes, the methyl signals of the Met residue have been utilized extensively as a sensitive probe to monitor Ca2+-CaM-target interactions (26, 27, 47, 48). For essentially all the methyl signals of SCaM4CT-NtMKP1, the corresponding signals are found in almost the same positions in the spectrum of the noncovalent SCaM4/NtMKP1pA complex (Fig. 6d). The slight differences observed for the Met145 resonance are probably due to small changes that are induced in its magnetic environment by the attachment of the proximal poly-Gly linker. Indeed, the methyl signal of Met124 shows unique high-field shifts in both 13C and 1H resonances due to the ring current shift induced by Trp157 (Fig. 5a), and a very similar signal is observed in the spectrum of the noncovalent SCaM4/NtMKP1pA complex. Consequently, we can conclude that the solution structure of the covalent SCaM4CT-NtMKP1 construct is essentially the same as that of the noncovalent SCaM4-NtMKP1pA complex.
In the solution structure of SCaM4CT-NtMKP1, the NtMKP1 domain forms an amphipathic α-helical structure and it interacts with the hydrophobic patch of SCaM4CT (Fig. 4). The NtMKP1 domain is “doubly anchored” to the SCaM4CT domain by the hydrophobic side-chains of Trp157 and Leu160. This observation is in good agreement with the previous mutagenesis results, which revealed that these two residues are an absolute requirement for binding (23). From the relatively large r.m.s.d. values (Fig. 3c) and the lower NOE value (average: 0.65 ± 0.05) (Fig. 8), the poly-Gly linker seems to act as a flexible joint between the SCaM4CT and the NtMKP1 domain as we had predicted when designing the fusion construct. When we compare the SCaM4CT-NtMKP1 structure to the crystal structures of the Ca2+-CaM complexed with the CaMBD of RYR1 and smMLCK, the backbone structure of the SCaM4CT domain is very similar to the C-lobes of CaM in the other complexes (r.m.s.d.: less than 1 Å (supplemental Table S2 and Fig. 7)). Particularly, the RYR1 CaMBD also possesses a Leu residue at the same position as the Leu160 in SCaM4CT-NtMKP1 and it contributes similar hydrophobic interactions with Ca2+-CaM. However, a significant difference is found in the orientation of the α-helical CaMBD relative to the CaM protein (Fig. 7). The differences in the helix angles were 32.60 and 33.20 for the Ca2+-CaM complexes compared with CaMBD of RYR1 and smMLCK, respectively. Similar differences were also found when making comparisons to other crystal structures where the differences in the angles ranged from 250 to 330 (supplemental Table S2). The unique orientation of the bound peptide seen in SCaM4CT-NtMKP1 is likely caused by the Arg161 residue of the NtMKP1 domain. Frequently, this position of CaMBD (5th position) is occupied by an apolar residue so that this part of the CaMBD can come in close contact with the hydrophobic patch of CaM (Fig. 1a). In particular, they are Leu3624 and Gly804 in the CaMBD of RYR1 and smMLCK, respectively (Fig. 7). In the case of SCaM4CT-NtMKP1, the basic side-chain of Arg161 is located outside of the hydrophobic patch of the SCaM4CT domain. Although no direct evidence for ion pair formation can be obtained through NMR analysis, the positions of the Arg161 and Glu84 residues of the SCaM4CT domain are such that their side chains likely form a hydrogen bond to stabilize the interaction. As a result, the hydrophobic interaction between Phe164 that is positioned at the C-terminal part of the NtMKP1 domain and the SCaM4CT domain remains somewhat superficial, as its sidechain does not penetrate deeply into the protein. Consistent with this notion, only a few intense NOE cross-peaks were detected between the aromatic side-chain of Phe164 and the hydrophobic side chains of the SCaM4CT lobe (Figs. 3b and 5b).
In this work, we also investigated the binding of a second NtMKP1pA peptide to Ca2+-SCaM4 by taking advantage of the intact fusion protein, SCaM4-NtMKP1. This fusion protein is beneficial for such a study because the first NtMKP1pA binding site in SCaM4 is always occupied by the fused NtMKP1 domain so that we can detect the chemical shift changes that are exclusively caused by the binding of the second NtMKP1pA peptide. By mapping the residues with a large CSP value on to the Ca2+-SCaM4 structure, it becomes apparent that the main interactions occur only through the hydrophobic target-binding patch of the N-lobe of SCaM4 (Fig. 10, b and c). This result agrees with the binding constant derived by ITC that is very similar to the previously reported binding constant of NtMKP1pA with the N-lobe fragment of SCaM isoforms (26). On the other hand, a few relatively small CSPs were observed for the C-lobe of SCaM4. This provides further evidence that there is a weak interaction between the N-lobe of Ca2+-SCaM4 and its NtMKP1-bound C-lobe in solution as we have discussed above.
Recently, Chun and co-workers (49) have reported that MKP1 from A. thaliana (AtMKP1) contained two distinct CaMBDs. The first CaMBD was found in the identical region as NtMKP1pA, while the second CaMBD was located rather close to the C terminus of AtMKP1. Upon inspection of the amino acid sequence of NtMKP1, this particular region is absent in the tobacco protein. However, CaMBD predictions (50), have shown that another potential CaMBD may exist at the C-terminal region of NtMKP1 (residues: 814–835), which is absent in AtMKP1. We reasoned that the N-lobe of SCaM4-NtMKP1 might bind to this second CaMBD, and therefore we studied binding of the peptide, NtMKP1pB. Although, the binding constant to SCaM4 derived from ITC was slightly higher than that of NtMKP1pA, the CSP data clearly show that the binding occurs only to the hydrophobic patch of the N-lobe of SCaM4 which is very similar to the NtMKP1pA binding (Fig. 10). Be that as it may, our data clearly show that binding of the NtMKP1pA and NtMKP1pB peptides is rather weak and could easily be displaced by another more strongly binding CaMBD peptide.
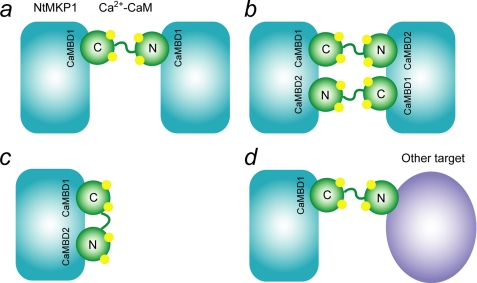
Taken together, we have been able to characterize the Ca2+-SCaM4-NtMKP1 complex structure and the backbone 15N dynamics. To the best of our knowledge, this is the first report of an NMR structure for a CaM isoform fused with a CaMBD. This approach allowed us to circumvent the difficulties in the expression and the purification of the isotopically labeled small CaMBD peptide. Because of proximity effects a well-defined complex was formed, which allowed us to successfully collect precise structural data for the CaMBD of NtMKP1 in the complex. The structure of SCaM4CT-NtMKP1 appears to create a distinct complex, which is different from any known Ca2+-CaM-target complexes because of the novelty of the amino acid sequence of this CaMBD. Under physiological conditions, it seems that only the C-lobe of SCaM4 binds to the NtMKP1pA region of NtMKP1 using both Trp157 and Leu160 as hydrophobic anchor residues. This “double anchoring” is probably the main reason that only the C-lobe of CaM is sufficient to provide high affinity binding for the NtMKP1pA. It has recently been demonstrated that NtMKP1 can be activated by its substrate SIPK but not by Ca2+-CaM; as such, the role of the Ca2+-CaM binding to NtMKP1 is less obvious (51). It is possible that it might involve a substrate-specific regulation by Ca2+-CaM similar to another plant phosphatase, DsPTP1 (52). On the other hand, the role of Ca2+-CaM binding is not always limited to enzyme activation. For example, it is known that Ca2+-CaM can induce dimerization of the plant enzyme glutamate decarboxylase (53, 54). This dimerization process seems to be essential in plant development (55). Ca2+-CaM can also induce a dimer of NtMKP1 by binding to the NtMKP1pA region of another NtMKP1 through the N-lobe as has been discussed previously (Fig. 11a and Ref. 26). In addition, our data suggest that dimerization could also occur through the NtMKP1pB region as shown in Fig. 11b, if the region is exposed on the surface of the protein and accessible for the N-lobe of Ca2+-CaM. Recently, it has been shown that the two lobes of Ca2+-CaM bind separately to discreet regions of the enzyme EKBP38 (56). By extension, it is also possible that the N- and C-lobe of Ca2+-CaM interact with the NtMKP1pB and NtMKP1pA region of a single NtMKP1 protein, respectively (Fig. 11c).
FIGURE 11.
Models for possible complex formation induced by the Ca2+-CaM-NtMKP1 interactions. The data obtained in this work revealed that the interactions of the N-lobe of the SCaM4-NtMKP1 fusion protein with CaMBD1 and CaMBD2 are relatively weak suggesting that the model depicted in panel d, where Ca2+-CaM act as a Ca2+-dependent adaptor protein, appears likely.
Unlike NtMKP1 and rice MKP1, AtMKP1 has been shown to be activated by Ca2+-CaM and the second CaMDB seems to play a pivotal role in this regulation (49). Hence, the lack of NtMKP1 activation by Ca2+-CaM might be caused by a distinct region for the N-lobe binding. Because both of the CaMBD in NtMKP1 give rise to a rather weak interaction with the N-lobe of Ca2+-SCaM4, they would be easily replaced by another target protein with a higher affinity. In this fashion, Ca2+-CaM might act as an “adaptor protein” to assemble a multiprotein complex in a Ca2+-dependent manner as we discussed previously (Fig. 11d and Ref. 57). Finally, Ca2+-CaM might modulate the translocation and the localization of NtMKP1 to a specific region in the cell during Ca2+ signaling. For example, Ca2+-CaM has been shown to stimulate the nuclear localization of many proteins (58). In a recent report concerning the Ca2+-CaM-dependent nuclear entrance of the transcription factor Nhp6Ap it has been found that an unknown third protein is recruited through Ca2+-CaM binding and that a ternary complex is formed to facilitate transport across the nuclear pore (59). Consequently, the identification of proteins that can strongly and selectively interact with the N-lobe of Ca2+-CaM will be key to understanding the links between the MAPK cascade and the Ca2+ signaling pathways in plants.
Supplementary Material
This work was supported by a discovery grant from the Natural Sciences and Engineering Research Council of Canada. The Bio-NMR Centre in Calgary was supported by the Canadian Institutes for Health Research and the University of Calgary.

The on-line version of this article (available at http://www.jbc.org) contains supplemental Tables S1–S3.
The atomic coordinates and structure factors (code 2kn2) have been deposited in the Protein Data Bank, Research Collaboratory for Structural Bioinformatics, Rutgers University, New Brunswick, NJ (http://www.rcsb.org/).
M. Rainaldi and H. J. Vogel, unpublished results.
- CaM
- calmodulin
- CaMBD
- calmodulin-binding domain
- SCaM1
- soybean calmodulin isoform 1
- SCaM4
- soybean calmodulin isoform 4
- SCaM4CT
- the C-lobe of soybean calmodulin isoform 4
- CSP
- chemical shift perturbation
- CSI
- chemical index
- MAPK
- mitogen-activated protein kinase
- NtMKP1
- N. tabacum MAPK phosphatase
- r.m.s.d.
- root mean-square deviation
- ITC
- isothermal titration calorimetry
- RDC
- residual dipolar coupling.
REFERENCES
- 1.Chin D., Means A. R. (2000) Trends Cell Biol. 10, 322–328 [DOI] [PubMed] [Google Scholar]
- 2.Hoeflich K. P., Ikura M. (2002) Cell 108, 739–742 [DOI] [PubMed] [Google Scholar]
- 3.Yamauchi E., Nakatsu T., Matsubara M., Kato H., Taniguchi H. (2003) Nat. Struct. Biol. 10, 226–231 [DOI] [PubMed] [Google Scholar]
- 4.Maximciuc A. A., Putkey J. A., Shamoo Y., Mackenzie K. R. (2006) Structure 14, 1547–1556 [DOI] [PubMed] [Google Scholar]
- 5.Ataman Z. A., Gakhar L., Sorensen B. R., Hell J. W., Shea M. A. (2007) Structure 15, 1603–1617 [DOI] [PMC free article] [PubMed] [Google Scholar]
- 6.Fallon J. L., Halling D. B., Hamilton S. L., Quiocho F. A. (2005) Structure 13, 1881–1886 [DOI] [PubMed] [Google Scholar]
- 7.Mori M. X., Vander Kooi C. W., Leahy D. J., Yue D. T. (2008) Structure 16, 607–620 [DOI] [PMC free article] [PubMed] [Google Scholar]
- 8.Elshorst B., Hennig M., Försterling H., Diener A., Maurer M., Schulte P., Schwalbe H., Griesinger C., Krebs J., Schmid H., Vorherr T., Carafoli E. (1999) Biochemistry 38, 12320–12332 [DOI] [PubMed] [Google Scholar]
- 9.Vetter S. W., Leclerc E. (2003) Eur. J. Biochem. 270, 404–414 [DOI] [PubMed] [Google Scholar]
- 10.Yamniuk A. P., Vogel H. J. (2004) Mol. Biotechnol. 27, 33–57 [DOI] [PubMed] [Google Scholar]
- 11.Ishida H., Vogel H. J. (2006) Protein Pept. Lett. 13, 455–465 [DOI] [PubMed] [Google Scholar]
- 12.Zielinski R. E. (1998) Annu. Rev. Plant Physiol. Plant Mol. Biol. 49, 697–725 [DOI] [PubMed] [Google Scholar]
- 13.Zielinski R. E. (2002) Planta. 214, 446–455 [DOI] [PubMed] [Google Scholar]
- 14.Lee S. H., Kim J. C., Lee M. S., Heo W. D., Seo H. Y., Yoon H. W., Hong J. C., Lee S. Y., Bahk J. D., Hwang I., Cho M. J. (1995) J. Biol. Chem. 270, 21806–21812 [DOI] [PubMed] [Google Scholar]
- 15.Lee S. H., Kim M. C., Heo W. D., Kim J. C., Chung W. S., Park C. Y., Park H. C., Cheong Y. H., Kim C. Y., Lee K. J., Bahk J. D., Lee S. Y., Cho M. J. (1999) Biochim. Biophys. Acta 1433, 56–67 [DOI] [PubMed] [Google Scholar]
- 16.Lee S. H., Johnson J. D., Walsh M. P., Van Lierop J. E., Sutherland C., Xu A., Snedden W. A., Kosk-Kosicka D., Fromm H., Narayanan N., Cho M. J. (2000) Biochem. J. 350, 299–306 [PMC free article] [PubMed] [Google Scholar]
- 17.Heo W. D., Lee S. H., Kim M. C., Kim J. C., Chung W. S., Chun H. J., Lee K. J., Park C. Y., Park H. C., Choi J. Y., Cho M. J. (1999) Proc. Natl. Acad. Sci. U.S.A. 96, 766–771 [DOI] [PMC free article] [PubMed] [Google Scholar]
- 18.Klessig D. F., Durner J., Noad R., Navarre D. A., Wendehenne D., Kumar D., Zhou J. M., Shah J., Zhang S., Kachroo P., Trifa Y., Pontier D., Lam E., Silva H. (2000) Proc. Natl. Acad. Sci. U.S.A. 97, 8849–8855 [DOI] [PMC free article] [PubMed] [Google Scholar]
- 19.Wendehenne D., Durner J., Klessig D. F. (2004) Curr. Opin. Plant Biol. 7, 449–455 [DOI] [PubMed] [Google Scholar]
- 20.Yamakawa H., Mitsuhara I., Ito N., Seo S., Kamada H., Ohashi Y. (2001) Eur. J. Biochem. 268, 3916–3929 [DOI] [PubMed] [Google Scholar]
- 21.Ishida H., Huang H., Yamniuk A. P., Takaya Y., Vogel H. J. (2008) J. Biol. Chem. 283, 14619–14628 [DOI] [PubMed] [Google Scholar]
- 22.MAPK Group ( 2002) Trends Plant Sci. 7, 301–308 [DOI] [PubMed] [Google Scholar]
- 23.Yamakawa H., Katou S., Seo S., Mitsuhara I., Kamada H., Ohashi Y. (2004) J. Biol. Chem. 279, 928–936 [DOI] [PubMed] [Google Scholar]
- 24.Pedley K. F., Martin G. B. (2005) Curr. Opin. Plant Biol. 8, 541–547 [DOI] [PubMed] [Google Scholar]
- 25.Lecourieux D., Ranjeva R., Pugin A. (2006) New Phytol. 171, 249–269 [DOI] [PubMed] [Google Scholar]
- 26.Rainaldi M., Yamniuk A. P., Murase T., Vogel H. J. (2007) J. Biol. Chem. 282, 6031–6042 [DOI] [PubMed] [Google Scholar]
- 27.Yamniuk A. P., Vogel H. J. (2004) J. Biol. Chem. 279, 7698–7707 [DOI] [PubMed] [Google Scholar]
- 28.Yamazaki T., Forman-Kay J. D., Kay L. E. (1993) J. Am. Chem. Soc. 115, 11054–11055 [Google Scholar]
- 29.Bax A., Delaglio F., Grzesiek S., Vuister G. W. (1994) J. Biomol. NMR 4, 787–797 [DOI] [PubMed] [Google Scholar]
- 30.Ottiger M., Delaglio F., Bax A. (1998) J. Magn. Reson. 131, 373–378 [DOI] [PubMed] [Google Scholar]
- 31.Grzesiek S., Bax A., Clore G. M., Gronenborn A. M., Hu J. S., Kaufman J., Palmer I., Stahl S. J., Wingfield P. T. (1996) Nat. Struct. Biol. 3, 340–345 [DOI] [PubMed] [Google Scholar]
- 32.Delaglio F., Grzesiek S., Vuister G. W., Zhu G., Pfeifer J., Bax A. (1995) J. Biomol. NMR 6, 277–293 [DOI] [PubMed] [Google Scholar]
- 33.Johnson B. A., Blevins R. A. (1994) J. Biomol. NMR 4, 603–614 [DOI] [PubMed] [Google Scholar]
- 34.Jee J., Güntert P. (2003) J. Struct. Funct. Genomics. 4, 179–189 [DOI] [PubMed] [Google Scholar]
- 35.Cornilescu G., Delaglio F., Bax A. (1999) J. Biomol. NMR. 13, 289–302 [DOI] [PubMed] [Google Scholar]
- 36.Gifford J. L., Walsh M. P., Vogel H. J. (2007) Biochem. J. 405, 199–221 [DOI] [PubMed] [Google Scholar]
- 37.Schwieters C. D., Kuszewski J. J., Tjandra N., Clore G. M. (2003) J. Magn. Reson. 160, 65–73 [DOI] [PubMed] [Google Scholar]
- 38.Zweckstetter M., Bax A. (2000) J. Am. Chem. Soc. 122, 3791–3792 [Google Scholar]
- 39.Morris A. L., MacArthur M. W., Hutchinson E. G., Thornton J. M. (1992) Proteins 12, 345–364 [DOI] [PubMed] [Google Scholar]
- 40.Koradi R., Billeter M., Wüthrich K. (1996) J. Mol. Graph. 14, 51–55, 29–32 [DOI] [PubMed] [Google Scholar]
- 41.Bhattacharya N., Yi M., Zhou H. X., Logan T. M. (2007) J. Mol. Biol. 374, 977–992 [DOI] [PMC free article] [PubMed] [Google Scholar]
- 42.Tjandra N., Wingfield P., Stahl S., Bax A. (1996) J. Biomol. NMR. 8, 273–284 [DOI] [PubMed] [Google Scholar]
- 43.Meador W. E., Means A. R., Quiocho F. A. (1992) Science 257, 1251–1255 [DOI] [PubMed] [Google Scholar]
- 44.Barbato G., Ikura M., Kay L. E., Pastor R. W., Bax A. (1992) Biochemistry 31, 5269–5278 [DOI] [PubMed] [Google Scholar]
- 45.Ye Q., Li X., Wong A., Wei Q., Jia Z. (2006) Biochemistry. 45, 738–745 [DOI] [PubMed] [Google Scholar]
- 46.Ye Q., Wang H., Zheng J., Wei Q., Jia Z. (2008) Proteins. 73, 19–27 [DOI] [PubMed] [Google Scholar]
- 47.Zhang M., Li M., Wang J. H., Vogel H. J. (1994) J. Biol. Chem. 269, 15546–15552 [PubMed] [Google Scholar]
- 48.Yamniuk A. P., Vogel H. J. (2005) Biochemistry 44, 3101–3111 [DOI] [PubMed] [Google Scholar]
- 49.Lee K., Song E. H., Kim H. S., Yoo J. H., Han H. J., Jung M. S., Lee S. M., Kim K. E., Kim M. C., Cho M. J., Chung W. S. (2008) J. Biol. Chem. 283, 23581–23588 [DOI] [PMC free article] [PubMed] [Google Scholar]
- 50.Yap K. L., Kim J., Truong K., Sherman M., Yuan T., Ikura M. (2000) J. Struct. Funct. Genomics 1, 8–14 [DOI] [PubMed] [Google Scholar]
- 51.Katou S., Karita E., Yamakawa H., Seo S., Mitsuhara I., Kuchitsu K., Ohashi Y. (2005) J. Biol. Chem. 280, 39569–39581 [DOI] [PubMed] [Google Scholar]
- 52.Yoo J. H., Cheong M. S., Park C. Y., Moon B. C., Kim M. C., Kang Y. H., Park H. C., Choi M. S., Lee J. H., Jung W. Y., Yoon H. W., Chung W. S., Lim C. O., Lee S. Y., Cho M. J. (2004) J. Biol. Chem. 279, 848–858 [DOI] [PubMed] [Google Scholar]
- 53.Yuan T., Vogel H. J. (1998) J. Biol. Chem. 273, 30328–30335 [DOI] [PubMed] [Google Scholar]
- 54.Yap K. L., Yuan T., Mal T. K., Vogel H. J., Ikura M. (2003) J. Mol. Biol. 328, 193–204 [DOI] [PubMed] [Google Scholar]
- 55.Baum G., Lev-Yadun S., Fridmann Y., Arazi T., Katsnelson H., Zik M., Fromm H. (1996) EMBO J. 15, 2988–2996 [PMC free article] [PubMed] [Google Scholar]
- 56.Edlich F., Maestre-Martínez M., Jarczowski F., Weiwad M., Moutty M. C., Malesević M., Jahreis G., Fischer G., Lücke C. (2007) J. Biol. Chem. 282, 36496–36504 [DOI] [PubMed] [Google Scholar]
- 57.Yamniuk A. P., Rainaldi M., Vogel H. J. (2007) Plant Signal. Behav. 2, e1–4 [DOI] [PMC free article] [PubMed] [Google Scholar]
- 58.Sweitzer T. D., Hanover J. A. (1996) Proc. Natl. Acad. Sci. U.S.A. 93, 14574–14579 [DOI] [PMC free article] [PubMed] [Google Scholar]
- 59.Hanover J. A., Love D. C., DeAngelis N., O'Kane M. E., Lima-Miranda R., Schulz T., Yen Y. M., Johnson R. C., Prinz W. A. (2007) J. Biol. Chem. 282, 33743–33751 [DOI] [PubMed] [Google Scholar]
Associated Data
This section collects any data citations, data availability statements, or supplementary materials included in this article.


