Abstract
SLC26 proteins function as anion exchangers, channels, and sensors. Previous cellular studies have shown that Slc26a3 and Slc26a6 interact with the R-region of the cystic fibrosis transmembrane conductance regulator (CFTR), (R)CFTR, via the Slc26-STAS (sulfate transporter anti-sigma) domain, resulting in mutual transport activation. We recently showed that Slc26a9 has both nCl−-HCO3− exchanger and Cl− channel function. In this study, we show that the purified STAS domain of Slc26a9 (a9STAS) binds purified (R)CFTR. When Slc26a9 and (R)CFTR fragments are co-expressed in Xenopus oocytes, both Slc26a9-mediated nCl−-HCO3− exchange and Cl− currents are almost fully inhibited. Deletion of the Slc26a9 STAS domain (a9-ΔSTAS) virtually eliminated the Cl− currents with only a modest affect on nCl−-HCO3− exchange activity. Co-expression of a9-ΔSTAS and the (R)CFTR fragment did not alter the residual a9-ΔSTAS function. Replacing the Slc26a9 STAS domain with the Slc26a6 STAS domain (a6-a9-a6) does not change Slc26a9 function and is no longer inhibited by (R)CFTR. These data indicate that the Slc26a9-STAS domain, like other Slc26-STAS domains, binds CFTR in the R-region. However, unlike previously reported data, this binding interaction inhibits Slc26a9 ion transport activity. These results imply that Slc26-STAS domains may all interact with (R)CFTR but that the physiological outcome is specific to differing Slc26 proteins, allowing for dynamic and acute fine tuning of ion transport for various epithelia.
Slc26 genes and proteins have attracted the attention of physiologists and geneticists. Why? Slc26a1 (Sat-1) was characterized as a Na+-independent SO42− transporter (1). Given the transport characteristics of the founding member of the gene family, Slc26 proteins were assumed to be sulfate transporters. Disease phenotypes, clone characterization, and family additions demonstrate that the Slc26 proteins are anion transporters or channels (2–4). These proteins have varied tissue expression patterns. At one extreme, Slc26a5 in mammals is found in the hair cells of the inner ear (5), whereas Slc26a2 (DTDST) is virtually ubiquitous in epithelial tissues (2).
Several Slc26 proteins are found in the epithelia of the lung, intestine, stomach, pancreas, and kidney, usually in apical membranes. Interestingly these are also tissues and membranes in which the cystic fibrosis transmembrane conductance regulator (CFTR)5 has been found functionally or by immunohistochemistry. Ko and co-workers (6–8) examined the distribution of Slc26a3 and Slc26a6 in HCO3− secretory epithelia, and asked if an interaction might occur between these Slc26 proteins and CFTR. In particular, these studies indicate that in expression systems, there is a reciprocal-stimulatory interaction of the STAS (sulfate transporter anti-sigma) domains of Slc26a3 and Slc26a6 with the regulatory region (R-region) of CFTR. These investigators hypothesized that this stimulatory interaction could account for the differences in pancreatic insufficiency and sufficiency observed in cystic fibrosis patients. Nevertheless, knock-out Slc26a6 mouse studies reveal more complicated cell and tissue physiology (see “Discussion”).
Slc26a9 has been reported to be a Cl−-HCO3− exchanger (9, 10) or a large Cl− conductance (3, 11, 12). Loriol and co-workers (12) indicated that SLC26A9 has a Cl− conductance that may be stimulated by HCO3−. Two other groups have indicated that the Cl− conductance is not affected by the presence of HCO3− (10, 11). We have recently demonstrated that Slc26a9 functions as both an electrogenic nCl−-HCO3− exchanger and a Cl− channel (10). Dorwart and colleagues (11) found that WNK kinases inhibited the SLC26A9 Cl− conductance but that this effect was independent of kinase activity. One group has a preliminary report indicating that WNK3 decreased Cl− uptake, whereas WNK4 increased Cl− uptake via Slc26a9 expressed in Xenopus oocytes (13).
Slc26a9 and CFTR are also co-expressed in several tissues. Slc26a9 protein has been localized to epithelia of the stomach and lung (9, 10, 14), although mRNA is also detectable in brain, heart, kidney, small intestine, thymus, and ovary (10). The R-region of CFTR was previously shown to increase the activity of Slc26a3 and Slc26a6 by interaction with STAS domains (6, 15, 16). Because Slc26a9 displays several different modes of ion transport, we asked if the R-region of CFTR would also increase the activity of Slc26a9. Our results indicate that the R-region of CFTR does interact with the STAS domain of Slc26a9. However, in the case of Slc26a9 this apparently similar interaction results in inhibition of Slc26a9 ion transport.
EXPERIMENTAL PROCEDURES
Animal Health and Welfare
Xenopus laevis were housed and cared for in accordance and approval of the Institutional Care and Use Committees of Case Western Reserve University (Xenopus) and the Mayo Clinic (Xenopus).
Slc26a9 Constructs
Cloning and characterization of Slc26a9 was recently reported by our group (10). All of the Slc26a9 constructs used for functional expression were subcloned into the X. laevis expression vector pGEMHE.
Slc26a9-ΔSTAS
We engineered BssHII sites flanking the “STAS domain” of Slc26a9 (BssHII 5′ site: bp 1516–1521; BssHII 3′ site, bp 2221–2226), which also maintained the correct reading frame. The intermediate Slc26a9 point mutation construct (R524Q-Slc26a9) when expressed in Xenopus oocytes had wild-type Slc26a9 function (not shown). The STAS region (bp 1528–2199, “…YNRAQEI…FPSIHDA…”) was removed by restriction digest with BssHII and agarose gel purification of the major product. The resulting fragment was religated resulting in Slc26a9-ΔSTAS. The resulting clone was verified by sequencing prior to experiments.
a6-a9-a6 Chimera
We made cassette constructions of Slc26a6 and Slc26a9, of which silent mutations encoding NurI (5′ of transmembrane span) and MunI sites (3′ of transmembrane span) at conserved residues were engineered. From cassette Slc26a6, the transmembrane domain (NurI-Slc26a6-MunI) was excised and discarded. From cassette Slc26a9, the transmembrane domain (NurI-Slc26a9-MunI) was excised and ligated between the Slc26a6 N and C termini to result in “a6-a9-a6.”
CFTR Constructs
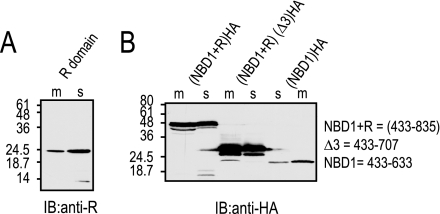
CFTR construct boundaries were according to the previous definitions of Chan and co-workers (17): nucleotide-binding domain (NBD1)CFTR (433–633 aa); R-region (R)CFTR (634–835 aa); (NBD1+R)CFTR (433–835 aa); and (NBD1+RΔ3)CFTR (433–707 aa). These regions were subcloned into a Xenopus oocyte expression plasmid, cRNA were made and injected into oocytes. The C terminus of each construct was tagged with an HA epitope. After 3–5 days, membrane and supernatants were isolated and resolved on 12% SDS-PAGE. Proteins transferred to nitrocellulose membrane for Western blots was performed using an anti-HA antibody. The predicted sizes for the R-region, NBD1+R, NBD1+RΔ3, and NBD1 are ∼23, 45, 31, and 22 kDa, respectively (see Fig. 2).
FIGURE 2.
CFTR fragment constructs expressed in Xenopus oocytes. A, lanes 1 and 2, the R-region of CFTR-(634–835) was expressed in Xenopus oocytes, and the oocyte crude membrane fraction (m) was separated from the supernatant (s). Both fractions were resolved on 12% SDS-PAGE and proteins were transferred to nitrocellulose membrane and Western blot was performed using an anti-R antibody. The predicted size for the R-region is ∼23 kDa. B, crude membrane and supernatant fractions extracted from oocytes expressing (NBD1+R)CFTR-(433–835), (NBD1+RΔ3)CFTR-(433–707), and (NBD1)CFTR-(433–633) were resolved on 12% SDS-PAGE. Proteins were transferred to nitrocellulose membrane and Western blot was performed using an anti-HA antibody (the C terminus of each construct was tagged with an HA epitope). The predicted sizes for NBD1+R, NBD1-RΔ3, and NBD1 are ∼45, 31, and 22 kDa, respectively. IB, immunoblot.
Slc26a9-STAS Fusion Protein
Construction of the vector (pGEVII) encodes the immunoglobin-binding domain of streptococcal protein G (GB1 domain) and was linked to the N terminus of the mouse Slc26a9-STAS domain (18). The mouse GB1-Slc26a9-STAS fusion was generated by using a similar PCR strategy for generating the mouse Slc26a9-STAS fragment with in-frame restriction sites, i.e. forward STAS GEVII BamHI (StasGB1BamF; 5′-CGGGATCCCAGGTCATGGACACGGACATCTAT-3′) and reverse STAS GEVII Xho (StasGB1XhoR; 5′-CCGCTCGAGAGCATTTGCTTGGGCAAAGAGGAC-3′). After restriction digest with BamHI and XhoI, this fragment was ligated into pGEVII (18) also cut with BamHI and XhoI using a QuickLigation reaction (New England BioLabs). The resulting construct (GB1-a9STAS) was sequenced in its entirety (W. M. Keck Sequencing, Yale University, New Haven, CT) to verify that the resulting fusion was in-frame.
Expression and Purification of GB1-a9STAS
BL21(DE3) Escherichia coli, codon plus, were transformed with the GB1-Slc26a9-STAS construct and small-scale expressions were examined for induction and solubility. GB1-a9STAS protein was best expressed in BL21(DE3) cells (Stratagene) in YT(2X) media at 37 °C after induction at OD (600 nm) = 0.5 with 0.4 mm isopropyl β-d-thiogalctopyranoside. The culture was left overnight with temperatures reduced to 25 °C after isopropyl β-d-thiogalctopyranoside induction. Cultures of 6 liter of YT(2X) media generate a cell pellet of ∼50 g, which was immediately used for purification of GB1-a9STAS. The cell pellet was suspended in buffer A (20 mm Tris, pH 8.0, 200 mm KCl, and 10% glycerol) with a protease inhibitor mixture (Sigma) according to the manufacturer's protocol. B-Per reagent (Fisher) was added to lyse the cells, and cell suspension was maintained at room temperature for 5–20 min to allow complete lysis. The cell lysate was cleared by centrifugation at 19,000 × g for 30 min. Cleared lysate was loaded onto a pre-equilibrated nickel-affinity resin (Qiagen) in buffer A. The lysate was gently equilibrated with resin for 1 h at 4 °C using a rotational orbiter. The resin was washed 3–4 times with buffer A, and again by buffer A containing 20 mm imidazole to elute nonspecific proteins bound to the resin. GB1-a9STAS was eluted from the nickel resin after pouring the resin into a column and then adding 250 mm imidazole in buffer A. The protein fractions were collected and concentrated to 500 μl using Amicon filters (Amicon). The salt concentration of the protein solution was reduced to 25 mm. The protein solution was then loaded onto an anion exchange column (Mono-Q, GE Healthcare), and the protein bound to the Mono-Q column at a flow rate of 0.25 ml/min. The Mono-Q column was washed with 250 mm, 500 mm, and 1 m NaCl containing buffer B (20 mm Tris, pH 8.0, 25 mm KCl, and 10% glycerol), and elution fractions were collected. GB1-a9STAS eluted at 500 mm NaCl (buffer B) as analyzed by Coomassie-stained SDS-PAGE. The GB1-a9STAS protein fractions were pooled and concentrated. Concentrated GB1-a9STAS protein was loaded onto a Sephadex 75 size exclusion column (GE Healthcare), and fractions were analyzed using SDS-PAGE.
Expression and Purification of a9STAS (without the GB1 Fusion)
The a9STAS protein without the GB1 sequence was cloned into pMCSG19c plasmid, along with a maltose-binding protein (MBP) fusion for enhanced solubility during expression in E. coli (19). The MBP was removed by co-expression of tobacco vein mottling virus protease from pRK1037 plasmid (both plasmids were gifts from Dr. Mark Donnelly). The plasmids were cotransformed into BL21(DE3) codon plus cells (Novagen). The MBP-a9STAS fusion protein was expressed and autocleavage of MBP was initiated by induction with 0.5 mm isopropyl β-d-thiogalctopyranoside. The purification procedure for a9STAS is similar to the GB1-a9STAS purification (above).
Preparation of (R)CFTR for Binding Experiments
(R)CFTR was isolated and purified (by the Forman-Kay laboratory) as previously reported (20). Briefly, (R)CFTR was purified using denaturing conditions and suspended in buffer (50 mm Tris, pH 8.0, 400 mm NaCl, 6 m guanidine HCl, 2 mm dithiothreitol) (20). For these experiments, this (R)CFTR solution was dialyzed in 20 mm Tris, pH 8.0, 200 mm KCl, 10% glycerol to fold into the native protein form (20), although the polypeptide likely remains largely unstructured. “Native (R)CFTR” was used for binding experiments as described below.
CFTR and a9STAS Binding
An equimolar amount of dialyzed (R)CFTR and a9STAS were mixed, and the mixture was incubated at 4 °C overnight. The incubated protein mixture was then loaded onto a pre-equilibrated nickel-affinity resin in buffer A (see above). The resin/protein mixture was incubated at 4 °C for 1 h using an orbitor, loaded onto a small column, and the column was washed 3–4 times with buffer A. Proteins were eluted using 250 mm imidazole in buffer A. For the control experiments, (R)CFTR and a9STAS (not shown) were separately bound to the resin and eluted as above. Complexes isolated by nickel affinity pull-down, with and without the GB1 fusion domain, were then loaded onto a Sephadex 75 size exclusion column at a flow rate of 0.25 ml/min. After separation, protein fractions were analyzed by Coomassie-stained SDS-PAGE.
Oocyte Experiments
Female X. laevis were purchased from Xenopus Express (Beverly Hills, FL). Slc26 clones were subcloned into the pGEMHE Xenopus expression vector (21). Oocytes were collagenase dissociated (22). Capped cRNA was synthesized using the T7 mMessage mMachine kit (Ambion, Austin, TX). Oocytes were injected with 50 nl of cRNA as previously for Slc26a9 (for Cl−-HCO3− exchange mode, 0.5 μg/μl, 25 ng/oocyte; for Cl− channel mode, 1 ng/oocyte) (10) or water, and incubated at 16 °C in OR3 media. Oocytes were studied 3–10 days after injection.
Electrophysiology
Electrophysiology protocols were performed as previously reported for Slc26a9 (10). All solutions were either ND96 (96 mm NaCl, 2 mm KCl, 1.8 mm CaCl2, 1 mm MgCl2, 5 mm HEPES, pH 7.5) or iso-osmotic ion replacements (23). The Na+ replacement was choline; and the Cl− replacement was gluconate. For HCO3− solutions, we used 5% CO2, 33 mm HCO3−, pH 7.5.
Two-electrode Voltage Clamp
For these experiments, oocytes were injected with 0.5 ng of cRNA and membrane currents were recorded with an OC-725C voltage clamp (Warner Instruments, Hamden, CT), filtered at 2–5 kHz, digitized at 10 kHz. I-V protocols consisted of 40-ms steps from Vh (−60 mV) to −160 and +60 mV in 20-mV steps (23, 24).
Ion Selective Microelectrodes
Ion selective microelectrodes were used to monitor pHi and intracellular Cl− ([Cl−]i) of oocytes (22, 23, 25). Intracellular pH, Cl−, and Na+ microelectrodes had slopes of at least −54 mV/pH unit or decade, respectively.
RESULTS
Slc26a9-STAS (a9STAS) Binds the R-region of CFTR ((R)CFTR)
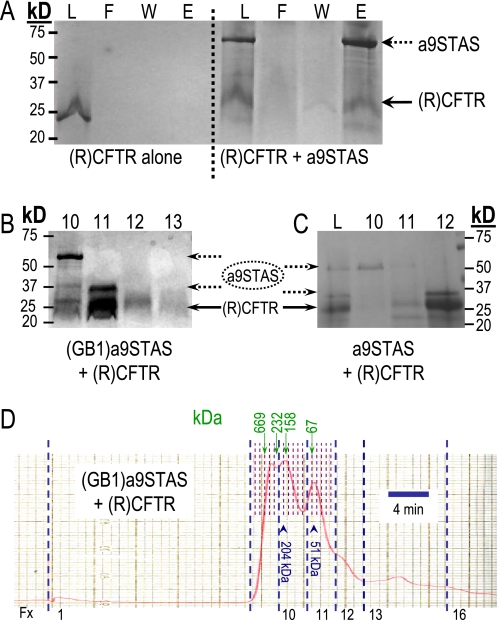
The a9STAS protein was expressed and purified to near homogeneity using nickel-affinity chromatography, anion exchange chromatography, and gel filtration chromatography (see “Experimental Procedures”). Purified a9STAS exists as two forms: 67 and 33 kDa, presumed dimer and monomer, respectively (seen in Fig. 1, B and C). Both protein forms were found to be a9STAS as confirmed by MS-MS analysis (Mayo Clinic Proteomic Core), and the 67 kDa appears to be a homodimer resistant to the SDS and reductants used. We used the larger 67-kDa protein fraction for binding/interaction experiments. The (R)CFTR protein region (21 kDa) was purified using denaturing conditions then renatured as instructed by the Forman-Kay procedures (20). This procedure ensures proper folding of the (R)CFTR protein (20).
FIGURE 1.
Protein interaction between the purified Slc26a9-STAS domain and the R-region of CFTR. A, Coomassie Blue-stained SDS-PAGE of pull-down experiments of (R)CFTR alone (left) or equimolar amounts of Slc26a9-STAS (a9STAS) plus (R)CFTR (right) (L, loaded input; F, flow through; W, wash; E, eluant). B and C, after incubation (overnight), eluant from the nickel affinity column was passed over a gel filtration column to size the complexes formed. Panel B shows an experiment with the above protocol using GB1-a9STAS and (R)CFTR. To make sure that GB1 was not effecting the interaction, we also purified a9STAS without GB1 from a pMCSG19c plasmid. The a9STAS was then incubated with (R)CFTR as above, and “E” from the nickel column was separated on a gel filtration column (fractions eluted from column are labeled as 10, 11, etc. in B and C). The specific fractions (fx) containing a9STAS, a9STAS+(R)CFTR, or (R)CFTR are shown (C). Panel D shows the complete elution chromatogram of B. Vertical blue-dashed lines indicate the beginning of column fractions (numbers at bottom), whereas the thin-dashed lines (half-height) indicate volumes within each fraction. Green vertical arrows and numbers are the calibration values. Blue arrowheads indicate the peaks in fx 10 and fx 11 (B).
To examine the possibility that the Slc26a9-STAS (a9STAS) protein and (R)CFTR might interact, we used a pulldown assay utilizing nickel-affinity resin binding (Fig. 1A). The a9STAS with a COOH-terminal (His)6 tag was incubated with (R)CFTR (no tag) in equimolar amounts then bound to nickel affinity resin. The nickel resin was washed extensively (buffer A) to remove unbound (R)CFTR before the protein was eluted (Fig. 1B). As a control, (R)CFTR was shown to not bind nickel resin. As Fig. 1A illustrates, (R)CFTR and a9STAS interact because eluted protein fractions contain both a9STAS and (R)CFTR.
To determine which oligomeric form of a9STAS interacts with (R)CFTR, we separated the a9STAS-(R)CFTR fraction isolated in pull-downs using gel filtration chromatography (Fig. 1D); eluted fractions are indicated as 10, 11, etc. for GB1-a9STAS (Fig. 1B) and a9STAS (Fig. 1C). The first protein off the column was observed as a 67-kDa a9STAS band by SDS-PAGE, then a very small amount of 67-kDa a9STAS and (R)CFTR, indicating that this interaction appears to be very weak to non-existent (Fig. 1, B, lane 10, C, lane 10). Later eluting fractions show that the monomeric, 33-kDa a9STAS predominantly associates with (R)CFTR (Fig. 1, B, lane 11, C, lane 12). These are the only proteins that elute from the column (Fig. 1D). Molecular mass estimates (determined by calibration curve) are 204 kDa (peak in fx-10) and 51.3 kDa (peak in fx-11). 204 kDa is consistent with 6×-(GB1)a9STAS, and 51.3 kDa is consistent with 1 (GB1)a9STAS (33.5 kDa) plus 1 (R)CFTR (21 kDa). To rule out any involvement of GB1 domain in the interaction, we purified the a9STAS without the GB1 domain (24 kDa) attached and re-performed the binding experiment (Fig. 1C). As Fig. 1C indicates, a9STAS alone and (R)CFTR bind strongly and clearly the GB1 fusion domain is not required. These data also indicate that some structural changes in a9STAS could occur to control the Slc26a9 channel activity (see “Discussion”).
Expression of (NBD1+R)CFTR Proteins in Xenopus Oocytes
To determine whether (R)CFTR or (NBD1+R)CFTR might interact functionally with Slc26a9, we first expressed these pieces in Xenopus oocytes (Fig. 2). As noted these boundaries were previously functionally designated by Chan and co-workers (17). As the Western blots in Fig. 2 illustrate, (R)CFTR and (NBD1+R)CFTR are made by Xenopus oocytes and are found in both the membrane (m) and supernatant (s) fractions.
(NBD1+R)CFTR Inhibits Slc26a9 Function (nCl−-HCO3− Exchange and Cl− Current)
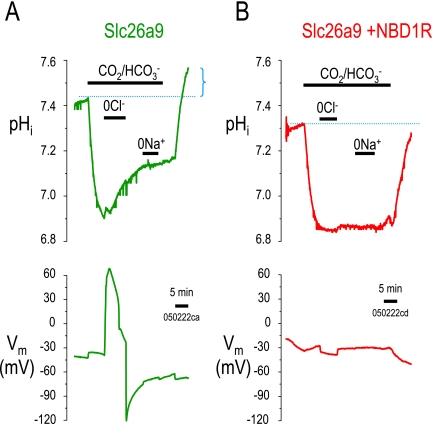
Because Ko and co-workers (6) previously found that Slc26a3 and Slc26a6 can interact with the R-region of CFTR, we co-expressed (NBD1+R)CFTR (Fig. 1) with Slc26a9. Fig. 3 shows two experiments measuring intracellular pH (pHi) in the presence of CO2/HCO3−. As we have shown previously for Slc26a9 (10), removal of Cl− in CO2/HCO3− results in an alkalinization (↑pHi) and depolarization (Fig. 3A), i.e. nCl−-HCO3−, exchange. Importantly, when (NBD1+R)CFTR was co-expressed with Slc26a9 (Fig. 3B), this nCl−-HCO3− exchange activity disappears. When CO2/HCO3− was removed, only Slc26a9 alone (Fig. 3A) results in a “pHi overshoot” (dotted blue line and bracket), which is also diagnostic of cellular HCO3− loading (3).
FIGURE 3.
(NBD1-R)-CFTR inhibits Slc26a9-mediated Cl−-HCO3− exchange. pHi experiments in Xenopus oocytes showing Slc26a9 alone (A) and Slc26a9 co-expressed with (NBD1-R)-CFTR (B). In the presence of 5% CO2, 33 mm HCO3−, pH 7.5, extracellular Cl− was replaced by gluconate (0Cl−) to show Cl−-HCO3− exchange activity (increase in pHi during 0Cl−). The dotted blue lines indicate the initial pHi as compared with the final pHi (after removal of CO2/HCO3−). The blue bracket illustrates the “pHi overshoot,” which is another indication that the oocyte was loaded with additional HCO3−. Note that the pHi overshoot only occurs in Slc26a9 alone (panel A) and not with co-expression of NBD1R (panel B). Text under the “5-min” time bar is the experiment label.
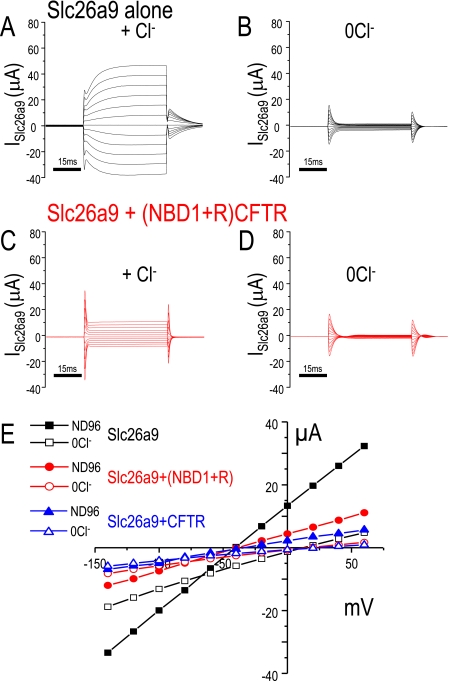
In other experiments, we voltage clamped Xenopus oocytes to examine the Slc26a9 Cl− currents. Again as we previously reported for Slc26a9, in the presence of Cl− the currents are large (10) (Fig. 4A). Cl− removal decreases these currents (Fig. 4B). Co-expression of (NBD1+R)CFTR with Slc26a9 dramatically reduces the currents in the presence (Fig. 4C) or absence of Cl− (Fig. 4D). This inhibition of Slc26a9 Cl− channel activity occurs over the entire voltage range tested (Fig. 4E).
FIGURE 4.
(NBD1+R)-CFTR inhibits Slc26a9 mediated currents. Voltage clamp experiments in Xenopus oocytes showing Slc26a9 alone (A, B, and E, black), Slc26a9 co-expressed with (NBD1+R)-CFTR (C, D, and E, red), and Slc26a9 co-expressed with full-length CFTR (E, blue traces). Panel A shows current sweeps (ISlc26a9) resulting from the voltage step protocol (see “Experimental Procedures”) in ND96 (A) and a Cl−-free ND96 (B). Panels C and D show the resulting current sweeps after co-expression of (NBD+R)-CFTR (red) in the same ND96 (C) and in a Cl−-free ND96 (D). Panel E displays the current-voltage (I-V) relations from similar experiments (black squares, Slc26a9; red circles, Slc26a9 + (NBD1+R)-CFTR; blue triangles, Slc26a9 + full-length CFTR; solid, ND96; outline, 0Cl− ND96). Note that these experiments did not include forskolin or any other addition that would activate the CFTR channel activity.
Deletion of Slc26a9 STAS Domain (a9-ΔSTAS) Alters Slc26a9 Function (Reduces Cl− Currents but Retains nCl−-HCO3− Exchange)
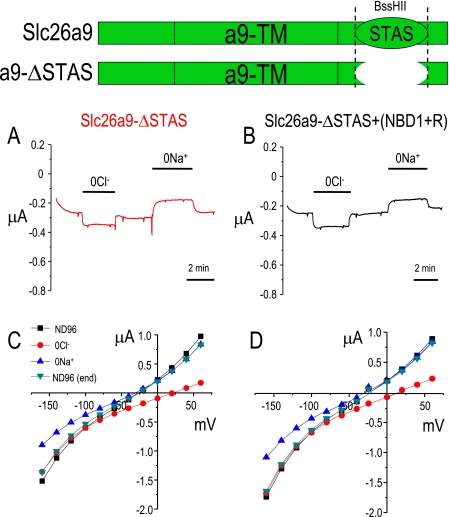
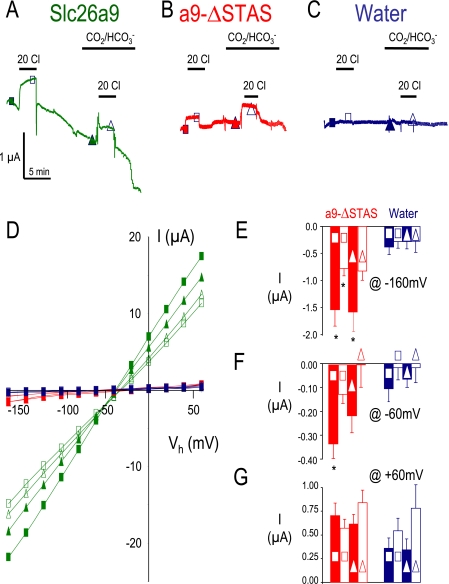
Next, we sought to determine whether the (NBD1+R)CFTR inhibition of Slc26a9 function was due to an interaction with the Slc26a9-STAS domain. For these experiments, we deleted the STAS domain of Slc26a9 (a9-ΔSTAS, see diagram in Fig. 7, top). Deletion of the STAS domain did not generate a “dead” transporter/channel (Figs. 5 and 6). The Slc26a9 currents are dramatically reduced (<80%), yet still present and still responsive to alterations of bath Cl− (Fig. 5, B and D–G, red). These a9-ΔSTAS currents are small but are clearly different from the water-injected control cells (Fig. 5, C–G, blue). Although there is some variation in the Slc26a9 and a9-ΔSTAS anion currents in the absence (Fig. 5, squares) or presence of CO2/HCO3− (Fig. 5, triangles), these differences are not statistically significant. To highlight that a9-ΔSTAS currents are different from the water-injected control currents, currents are plotted at −160, −60, and +60 mV (Fig. 5, E–G). These data indicate that the small a9-ΔSTAS currents measured are still anion selective and can be distinguished from the water-injected controls.
FIGURE 7.
The STAS domain is necessary for (NBD1-R)-CFTR-mediated inhibition of Slc26a9 currents. Removal of the STAS domain from Slc26a9 (A and C) dramatically reduces the currents evoked by expression of Slc26a9-ΔSTAS. Co-expression of Slc26a9-ΔSTAS with (NBD1+R)-CFTR (B and D) does not further alter these voltage-dependent currents. ND96 contains 96 mm Na+ and 104 mm Cl−.
FIGURE 5.
The Slc26a9-STAS domain is needed for Slc26a9 currents. Voltage clamp experiments in Xenopus oocytes showing Slc26a9 (A, green), Slc26a9-ΔSTAS (B, red), and water-injected oocytes (C, blue) clamped to −60 mV, whereas bath [Cl−] is lowered to 20 mm (open shapes). Panel D show the I-V relationships. Average responses at −160 (E), −60 (F), and +60 mV (G) are shown for a9-ΔSTAS (red) and water-injected oocytes (blue). Triangles indicate CO2/HCO3− solutions, whereas squares indicate non-HCO3− solutions. Asterisk indicates p < 0.05 compared with water-injected oocytes. Currents for Slc26a9 (green, at −160, −60, and +60 mV) were all statistically different than both a9-ΔSTAS (red) and water-injected oocytes (blue) (p < 0.05). n is 6 for a9-ΔSTAS (red) and 5 for water (blue).
FIGURE 6.
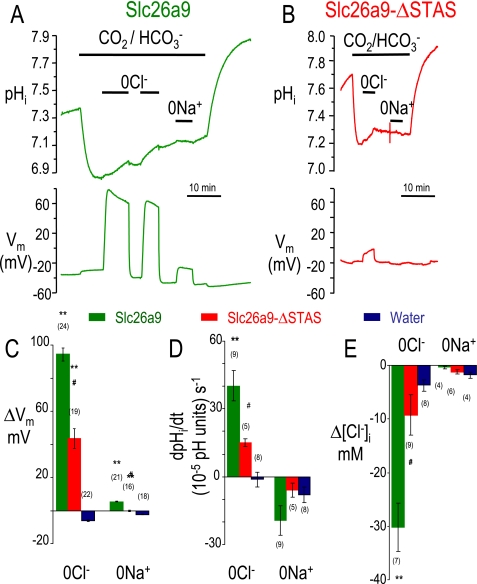
The Slc26a9-STAS domain is not critical for Slc26a9-mediated Cl−-HCO3− exchange. Representative pHi experiments for Slc26a9 (A, green) and Slc26a9-ΔSTAS (B, red) in CO2/HCO3− solutions. Cl− removal (0Cl−) in these HCO3− solutions, depolarized the oocytes (C) and increased pHi (D). Similar experiments using intracellular Cl− microelectrodes were performed (not shown) and changes of intracellular [Cl−] averaged (E). Average responses from Cl− removal (0Cl−) or Na+ removal (0Na+) are shown (C–E).
To further examine the function of a9-ΔSTAS, we performed pHi experiments in the presence of CO2/HCO3− (Fig. 6). We compared acidification and alkalinization of wild-type Slc26a9 (Fig. 6A, black) to that of a9-ΔSTAS (Fig. 6B, red). On average, the depolarization evoked by Cl− removal was 43.6 ± 5.9 mV (a9-ΔSTAS) rather than 94.5 ± 3.9 mV for wild-type (wt-Slc26a9) (Fig. 6C). The voltage difference (ΔVm) with Na+ removal (“0 Na+”) for a9-ΔSTAS (−0.3 ± 0.4 mV) was smaller than Slc26a9 (+5.4 ± 0.2 mV) (see Fig. 6C and Table 1), although ΔVm for wt-Slc26a9 was smaller in these paired experiments (compare Fig. 6C and Table 1). The ΔVm was not statistically different from the water-injected controls for these paired experiments (−2.3 ± 0.3 mV; p > 0.05). Similarly, the rate of alkalinization (dpHi/dt) with Cl− removal was +15 ± 1.7 × 10⁻⁵ pH units s−1 (a9-ΔSTAS) compared with +40.2 ± 6.7 × 10⁻⁵ pH units s−1 (Slc26a9), and −1.3 ± 3.3 × 10⁻⁵ pH units s−1 (water controls) (Fig. 6D, p < 0.05). Na+ removal acidified the wt-Slc26a9 oocyte (−30 × 10−5 pH units s−1), whereas the a9-ΔSTAS oocyte (−6 ± 3.2 × 10⁻⁵ pH units s−1) was not statistically different from the water-injected control (Fig. 6D). Measuring intracellular [Cl−] ([Cl−]i), revealed that Cl− removal decreased [Cl−]i for wt-Slc26a9 (−30.2 ± 4.5 mm), whereas [Cl−]i of a9-ΔSTAS oocytes decreased by about one-third (−9.3 ± 3.8 mm) (Fig. 6E). Together these data indicate that a9-ΔSTAS has about one-third of the nCl−-HCO3− exchange activity of wt-Slc26a9 (Table 2).
TABLE 1.
Acid-base transport properties of Slc26a9, water, and a9ΔSTAS
Measured and calculated acid-base transport properties of clones used in this study as previously reported for other transporters (24, 66).
| Units | Slc26a9 |
Water |
a9 ΔSTAS |
|||||||
|---|---|---|---|---|---|---|---|---|---|---|
| Avg | S.E. | n | Avg | S.E. | n | Avg | S.E. | n | ||
| dpHi/dt | ||||||||||
| 0Cl−/CO2 | 10−5 pH units s−1 | 40.2 | 6.7 | 9 | −1.3 | 3.3 | 8 | 15.0 | 1.7 | 5 |
| 0Na+/CO2 | 10−5 pH units s−1 | −19.3 | 6.5 | 9 | −8.0 | 3.4 | 8 | −6.0 | 3.2 | 5 |
| ΔVm | ||||||||||
| 0Cl−/CO2 | mV | 94.5 | 3.9 | 24 | −6.4 | 0.4 | 22 | +43.6 | 5.9 | 21 |
| 0Na+/CO2 | mV | 5.4 | 0.2 | 21 | −2.3 | 0.3 | 18 | −0.4 | 0.34 | 16 |
| Δ[Cl−]i | ||||||||||
| 0Cl−/CO2 | mm | −30.2 | 4.5 | 7 | −3.7 | 1.08 | 8 | −9.3 | 3.8 | 9 |
| 0Na+/CO2 | mm | −0.3 | 0.2 | 5 | −1.8 | 0.50 | 4 | −1.2 | 0.4 | 6 |
TABLE 2.
Acid-base transport properties of Slc26a9, water, and a6-a9-a6 chimera
Measured and calculated acid-base transport properties of clones used in this study as previously reported for other transporters (24, 66). “β” is the buffering capacity in units of mm × (pH unit)−1.
| Units | Slc26a9 |
Water |
a6-a9-a6 |
|||||||
|---|---|---|---|---|---|---|---|---|---|---|
| Avg | S.E. | n | Avg | S.E. | n | Avg | S.E. | n | ||
| Initial pHi | 7.29 | 0.07 | 12 | 7.34 | 0.04 | 7 | 7.60 | 0.08 | 7 | |
| Final pHi | 7.64 | 0.08 | 12 | 7.32 | 0.07 | 7 | 7.64 | 0.08 | 7 | |
| Initial Vm | mV | −28.42 | 0.97 | 12 | −33.00 | 4.58 | 7 | −36.86 | 2.30 | 7 |
| CO2/HCO3− (ΔpHi) | pH unit | −0.51 | 0.03 | 12 | −0.44 | 0.03 | 7 | −0.55 | 0.04 | 7 |
| [HCO3−]i | mm | 5.81 | 0.59 | 12 | 7.61 | 1.12 | 7 | 9.51 | 1.55 | 7 |
| Apparent βCO2a | mm × (pH unit)−1 | 11.76 | 1.59 | 12 | 18.15 | 3.79 | 7 | 17.24 | 2.00 | 7 |
| (0Cl) CO2/HCO3− (ΔpHi) | pH unit | 0.12 | 0.02 | 12 | −0.01 | 0.00 | 7 | 0.16 | 0.03 | 7 |
| [HCO33−]i | mm | 8.30 | 0.98 | 12 | 7.52 | 1.08 | 7 | 15.03 | 2.81 | 7 |
| Δ[HCO3−]i | mm | 2.49 | 0.46 | 12 | 0.00 | 0.00 | 5.52 | 1.46 | 7 | |
| βCBEa | mm × (pH unit)−1 | 20.17 | 2.13 | 12 | 0.00 | 0.00 | 7 | 35.67 | 8.52 | 7 |
| dpHi/dt | ||||||||||
| CO2 | 10−5 pH units s−1 | −341 | 49 | 12 | −183 | 12 | 7 | −333 | 27 | 7 |
| 0Cl−/CO2 | 10−5 pH units s−1 | +18 | 11 | 17 | +6 | 8 | 7 | +51 | 16 | 7 |
| ΔVm | ||||||||||
| CO2/HCO3− | mV | −0.29 | 0.20 | 7 | 0.57 | 0.52 | 7 | NDb | ||
| 0Cl−/CO2 | mV | +96.65 | 4.30 | 17 | −4.14 | 0.98 | 7 | +97.29 | 4.09 | 7 |
| 0Na+/CO2 | mV | 20.00 | 4.47 | 7 | −1.43 | 0.81 | 7 | 5.14 | 0.55 | 7 |
a Apparent βCO2 = ([HCO3−]i)/(ΔpHi from CO2 addition). βCBE (β resulting from activation of nCl−-HCO3− exchange) = (Δ[HCO3−]i)/(ΔpHi from 0 Cl−/CO2 addition).
b ND, not determined.
Slc26a9 STAS Domain Is Necessary for (NBD1+R)CFTR Inhibition of Slc26a9 Function
The a9-ΔSTAS-mediated function is unaffected by co-expression with (NBD1+R)CFTR.
Once we determined that a9-ΔSTAS has some residual Slc26a9 function (Fig. 6), we sought to determine whether the residual activity would still be controlled by coexpression of (NBD1+R)CFTR. Fig. 7 shows the results of these experiments. In contrast to wild-type Slc26a9 (Fig. 7, A and C), a9-ΔSTAS currents (0Cl−, 0Na+) are unaffected by co-expression of (NBD1+R)CFTR (Fig. 7, B and D). That is, the a9-ΔSTAS currents are neither decreased nor increased by co-expression of (NBD1+R)CFTR. These data indicate that the Slc26a9-STAS domain is critical for binding and functional interaction with (NBD1+R)CFTR.
Replacement of Slc26a9-STAS with the Slc26a6-STAS Domain (a6-a9-a6) Generates Resistance to (NBD1+R)CFTR
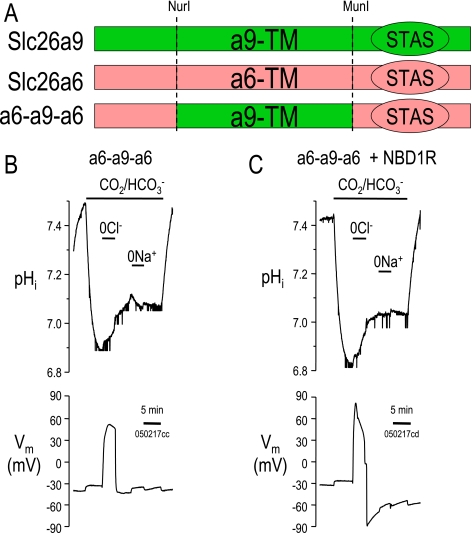
Because deletion of the Slc26a9-STAS domain apparently removed the interaction with (NBD1+R)CFTR, our next strategy was to replace the Slc26a9-STAS domain with the STAS domain from Slc26a6. This chimeric construct (a6-a9-a6) is illustrated at the top of Fig. 8.
FIGURE 8.
Slc26a6-STAS prevents (NBD1+R)-CFTR inhibition of Slc26a9-mediated Cl−-HCO3− exchange. A, models of Slc26a9, Slc26a6, and the a6-a9-a6 chimera. pHi experiments in Xenopus oocytes showing the a6-a9-a6 chimera alone (B) and a6-a9-a6 co-expressed with (NBD1-R)-CFTR (C). Note that the a6-a9-a6 chimera maintains Slc26a9-type Cl−-HCO3− exchange.
Cl−-HCO3− Exchange Activity
As previously reported for Slc26a6 (26) and wild-type Slc26a9 (3, 10), we monitored pHi and removed Cl− from the CO2/HCO3− solution (Fig. 8). The a6-a9-a6 construct has nCl−-HCO3− exchange activity similar to wt-Slc26a9 although more robust (see Fig. 6A and Table 2). Cl− removal from the a6-a9-a6-injected oocytes results in a depolarization (a6-a9-a6: +97.3 ± 4.1 mV, Fig. 8A versus wt-Slc26a9: +96.7 ± 4.3 mV, Fig. 6A) and alkalinization (a6-a9-a6: +51 ± 16 × 10−5 pH units s−1 versus wt-Slc26a9: +18 ± 11 × 10−5 pH units s−1). The a6-a9-a6 chimera does slightly increase general cellular buffering (βCO2) (a6-a9-a6: 17.2 ± 2.0 mm × (pH unit)−1 versus Slc26a9: 11.8 ± 1.6 mm × (pH unit)−1 (see Table 1). Buffering due to nCl−-HCO3− exchange activity (βCBE, buffering resulting from Cl− removal in the CO2/HCO3− ND96 solution) increases (a6-a9-a6: 36.7 ± 8.5 mm × (pH unit)−1 versus Slc26a9: 20.2 ± 2.1 mm × (pH unit)−1) reflecting the increased nCl−-HCO3− exchange activity (Table 2).
Even though the a6-a9-a6 chimera (Fig. 8A) seemed more active than Slc26a9 (Fig. 6A), there was no indication that this nCl−-HCO3− exchange activity was reduced by co-expression with (NBD1+R)CFTR (Fig. 8B). In fact, there seemed to be a slight increase in a6-a9-a6 nCl−-HCO3− exchange activity with (NBD1+R)CFTR as previously reported by Ko and colleagues (6).
Cl− Currents
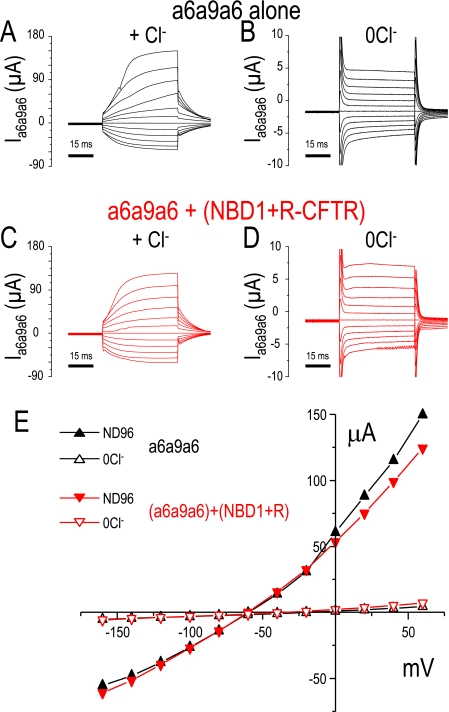
As found with nCl−-HCO3− exchange activity, the a6-a9-a6 chimera Cl− currents (Fig. 9A) were increased with respect to those of Slc26a9 (Fig. 4A). Cl− currents for Slc26a9 ranged from 60 to 100 μA, whereas currents for the a6-a9-a6 chimera were usually greater than 100 μA. The residual currents after removal of bath Cl− (0Cl−) for the a6-a9-a6 chimera (Fig. 9B) were larger than those for Slc26a9 (Fig. 4B). Despite these larger currents, co-expression of the a6-a9-a6 chimera with (NBD1+R)CFTR did not inhibit anion currents in the presence of bath Cl− (Fig. 9C) or in the absence of bath Cl− (Fig. 9D). These results indicate that the Slc26a6-STAS domain does not mediate inhibition of Slc26 protein function by interacting with (NBD1+R)CFTR. These results also imply that the Slc26a6-STAS domain interacting with (NBD1+R)CFTR cannot increase the anion currents unlike the apparent increase in nCl−-HCO3− exchange activity.
FIGURE 9.
Slc26a6-STAS prevents (NBD1+R)-CFTR inhibition of Slc26a9-mediated currents. Voltage clamp experiments in Xenopus oocytes showing a6-a9-a6 alone (A, B, and E, black) and a6-a9-a6 co-expressed with (NBD1+R)-CFTR (C–E, red). Panel A shows current sweeps (ISlc26a9) resulting from the voltage step protocol (see “Experimental Procedures”) in ND96 (A) and Cl−-free ND96 (B). Panels C and D show the resulting current sweeps after co-expression of (NBD+R)-CFTR (red) in the same ND96 (C) and in a Cl−-free ND96 (D). Panel E displays the current-voltage (I-V) relationship from similar experiments (black squares, Slc26a9; red circles, Slc26a9 + (NBD1+R)-CFTR; solid, ND96; outline, 0Cl− ND96).
DISCUSSION
Mutations in Slc26 anion transporter-channel proteins cause a variety of human diseases: diarrhea, deafness, goiter, diastrophic dysplasia, etc. (5, 27–41). Mouse studies have revealed additional roles for these Slc26 proteins in mammalian physiology: deafness, goiter, and acidosis (Slc26a4, pendrin) (42–44), cochlear motor protein (Slc26a5, prestin) (45–47), proximal tubule NaCl absorption, nephrolithiasis, and intestinal HCO3− secretion (Slc26a6, Pat-1, CFEX) (8, 48–52), sperm motility (Slc26a8, Tat-1) (53), and gastric acid secretion (Slc26a9) (14). Additionally, several of the Slc26 proteins have reported sensitivity to WNK kinase phosphorylation (11, 13), potentially linking them to hypertension (54–58).
As noted in the Introduction, in vitro studies with pancreatic ducts of slc26a6−/− mice (8, 50) complicate this interpretation as there are also mouse stain-dependent differences in basal and stimulated Cl−-HCO3− exchange activity. Mice with targeted deletion of slc26a6 have an unexpected increase in pancreatic duct Cl−-HCO3− exchange activity (8, 50). Considerable differences exist between these two studies. First, the studies involve different knock-out mouse strains, which further complicate biochemistry and tissue physiology, Ishiguro and colleagues (50) reported that basal as well as cAMP-stimulated Cl−-HCO3− exchange activity is increased in their slc26a6−/− mice. In particular, the influx mode of Cl−-HCO3− exchange was greatly increased whereas, the efflux mode seemed decreased. These slc26a6−/− mice also had a marked increase in Slc26a3 expression, suggesting that Slc26a3 is the dominant Cl−-HCO3− exchanger in these slc26a6-deficient cells. In contrast, Wang and co-workers (8) reported (i) a large increase in basal Cl−-HCO3− exchange and fluid secretion, but (ii) a marked attenuation of cAMP-stimulated secretion. These investigators found no change in Slc26a3 expression in pancreatic ducts (8), versus whole pancreas as shown by Ishiguro et al. (50). Knockdown and pharmacological inhibition of CFTR indicates that CFTR activity is paradoxically enhanced in the later Slc26a6−/− mice (8). Wang and co-workers explained these combined results by suggesting that in the resting duct there is removal of tonic inhibition of CFTR and thus a reduced activation of the missing Slc26a6 protein by CFTR in the stimulated ducts (8). The complexity of these results underscores the importance of reciprocal interactions between CFTR and SLC26A6, mediated by binding between the R-region of CFTR and the STAS domain of SLC26A6 (7).
Slc26a3 and Slc26a6 have been shown to functionally interact with the R-region of the cystic fibrosis Cl− channel (CFTR) via their C-terminal STAS domain. Most importance for this study is that these previous studies in expression systems have shown that Slc26a3 or Slc26a6 interacting with CFTR results in mutual activation (6, 7, 15, 59).
Like previous studies, we observed a direct protein-protein interaction of STAS and (R)CFTR (Fig. 1). However, the results here with co-expression of Slc26a9 and (NBD1+R)CFTR show inhibition of Slc26a9 activity (electrogenic nCl−-HCO3− exchange activity, Fig. 3; Cl− channel activity, Fig. 4) not stimulation. These results indicate that different structural interactions may exist between specific STAS domains and the R-region of CFTR. This conjecture is consistent with the dynamic nature of (R)CFTR revealed by Baker and co-workers using two-dimensional NMR (20) as well as the in vitro knock-out studies (8, 50). Alternatively, if the CFTR R-region interaction with different STAS domains is identical, differing structural responses must result elsewhere. Recently, Bertrand and co-workers (60) also found that SLC26A6 and CFTR interact and co-immunoprecipitate. However, their experiments focused on CFTR activity (forskolin-stimulated), which is enhanced with co-expression of SLC26A9. Together these studies indicate that there are likely several layers to these interactions. These varied interactions may help explain the unexpected phenotypes in the slc26a3 and slc26a6−/− mice noted previously.
Purified a9STAS appears as both a monomer and dimer on SDS-PAGE (Fig. 1, B and C, dotted arrows). These binding studies also indicate that the a9STAS-(R)CFTR protein interaction occurs with the a9STAS monomer (Fig. 1B and 1D, fx 11; Fig. 1C, fx 12) over the a9STAS dimer (Fig. 1B and 1D, fx 10; Fig. 1C, L and fx 10), whereas our a9STAS is primarily a homodimer when isolated alone (not shown). Several Slc26 proteins are known to form dimers (61), although the nature of the dimerization is not known. Perhaps the Slc26a9-CFTR interaction alters the oligomeric state of Slc26a9 in the membrane, resulting in Slc26a9 transporter/channel inhibition. Higher transport and channel activity may exist in the dimeric form of the Slc26a9 protein, with the oligomerization state regulated by changes occurring in the STAS domain. If this hypothesis is true, we would expect that Slc26a9 will function normally unless there is a critical amount of CFTR in close proximity. We would also expect (predict) that in epithelial tissues like the small intestine, which can express several Slc26 paralogs at the same membrane (at least Slc26a2, Slc26a3, Slc26a6, and Slc26a9), this ability of CFTR to differentially affect specific Slc26 proteins (via their STAS domains) is likely dynamic. These conjectures seem to be consistent with the dynamic nature of the CFTR R-region and observations that PKA phosphorylation alters the R-region NMR structure (20).
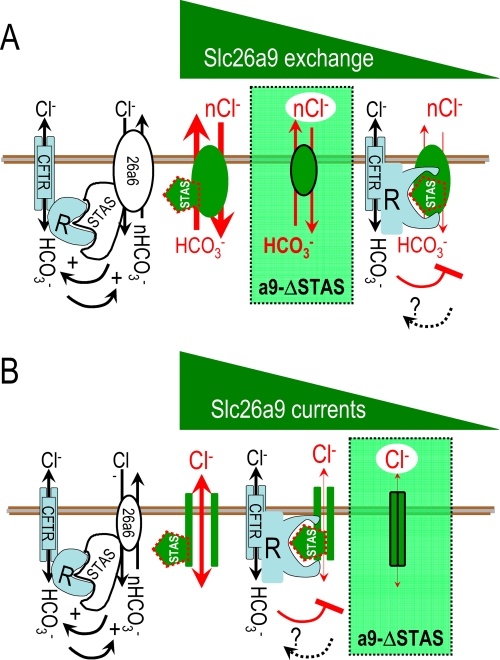
Functionally (6, 7) and structurally (20), the interaction of Slc26a3/Slc26a6 and CFTR seems dependent on the PKA phosphorylation state of (R)CFTR. Bertrand and co-workers (60) found that SLC62A9 and CFTR interact when CFTR activity is forskolin-stimulated. Experiments presented here (see Figs. 1, 3B, and 4) with Slc26a9 have not explored what affect PKA stimulation or phosphorylation may have for binding studies, inhibition of nCl−-HCO3− exchanger activity or inhibition of Cl− channel activity. Nevertheless, (R)CFTR binds a9STAS (Fig. 1) and inhibits Slc26a9 function (Figs. 3 and 4). We have hypothesized that multiple binding proteins may be involved in determining which Slc26a9 activity (exchanger, channel, or cotransporter) dominates in a given epithelial membrane (10). Our results here illustrate that CFTR is one of those binding partners but that rather than selecting a transport “mode,” the CFTR interaction blocks the normal Slc26a9 function (Fig. 10, A and B). Other putative a9STAS binding partners are not yet known, although PDZ binding proteins such as NHERF1, NHERF2, and PDZK1 seem to be reasonable candidates.
FIGURE 10.
Membrane models illustrating relative physiological activity of the Slc26a9-STAS and (R)CFTR interaction. A, apical membrane model illustrating Slc26a9 electrogenic nCl−-HCO3− exchange and the role of the Slc26a9-STAS domain in controlling exchange activity. The green triangle represents the decreasing exchange activity as (i) the STAS domain is deleted (a9-ΔSTAS) or (ii) the R-region of CFTR interacts with the Slc26a9-STAS domain. B, apical membrane model illustrating Slc26a9 Cl− channel activity and the role of the Slc26a9-STAS domain in controlling the Cl− channel activity. The green triangle in B represents decreasing activity of the Slc26a9 Cl− channel function.
Slc26 transporter/channels have a penultimate C-terminal PDZ domain in addition to the C-terminal STAS domain. Slc26a9 has a type II PDZ domain (10). Lohi and co-workers (62) found that these PDZ domains are critical for Slc26 protein function. Mindful of these results, we designed and created a Slc26a9-ΔSTAS (a9-ΔSTAS) protein in which only the STAS domain was removed leaving potential PDZ interactions intact (Fig. 7). Because this a9-ΔSTAS has ∼10% wt-Slc26a9 current (Fig. 5, D–G), these I-results indicate that the a9STAS domain is somehow structurally required for high activity of the Slc26a9 channel mode. Conversely, Fig. 6 shows that the a9-ΔSTAS maintains about one-third of the nCl−-HCO3− exchange activity (dpHi/dt, Fig. 6, D, Δ[Cl−]i, and E). Thus, it appears that the STAS domain of Slc26a9 can change the magnitude of these two Slc26a9 functions or perhaps enable Slc26a9 to favor one functional mode over the other.
Deletion of the STAS domain leads to loss of function in SLC26A3 (63), which otherwise tolerates removal of up to ∼40 C-terminal amino acids. Random mutagenesis of a plant SLC26 sulfate transporter revealed two general classes of mutant effects within the STAS domain (64). First, mutations within the β-pleated sheet region tend to reduce intracellular accumulation of the protein, suggesting that the STAS domain may also have a role in biosynthesis or stability of the Slc26 protein. Second, mutations of the N-terminal end of the α-helical regions was associated with impaired function despite expression at the plasma membrane (64). A more recent study of disease-associated mutations in the STAS domain of SLC26A3 indicates a predominant effect on biosynthesis, affecting different steps in the folding and/or trafficking pathway of the protein (16). We have also found that single nucleotide polymorphisms in human SLC26A9 flank the STAS domain and that at least one seems to reduce SLC26A9-mediated transport (65). Collectively, these studies indicate that the presence, folding, and structure of the STAS domain are important for transport function of the SLC26 transporters.
To test the potential specificity of Slc26-STAS domain and (R)CFTR/(NBD1+R)CFTR interaction, we examined transport changes due to the deletion (a9-ΔSTAS, Fig. 7) or replacement (a6-a9-a6 chimera, Figs. 8 and 9) of the Slc26a9-STAS domain. As expected, deletion of the Slc26a9-STAS domain removes regulation by (NBD1+R)CFTR (Fig. 7). Replacement of the Slc26a9-STAS domain with the Slc26a6-STAS (a6-a9-a6 chimera, Fig. 9A) has several affects. First, a6-a9-a6 maintains apparently all of the native Slc26a9 transport modes (transporter, Fig. 8B; and channel, Fig. 9A). This outcome was unexpected, because as discussed above, deletion of the Slc26a9-STAS domain almost removes the Slc26a9 channel activity and reduces Slc26a9 nCl−-HCO3− exchange activity. Thus, at least one other STAS domain can be substituted for the Slc26a9-STAS domain and maintain (possibly increase) wt-Slc26a9 functional modes. The second affect of replacing the Slc26a9-STAS domain was that interaction (co-expression) with (NBD1+R)CFTR no longer inhibited Slc26a9 nCl−-HCO3− exchange activity. Third, the Slc26a6-STAS domain in Slc26a9 (a6-a9-a6 chimera) may actually increase the Slc26a9 nCl−-HCO3− exchange activity (compare Fig. 8A to Fig. 3A, see also Table 2) and the Slc26a9 Cl− channel activity (compare Figs. 9, A, B, and E to 4, A, B, and E). Thus, consistent with our data “some” STAS domain is needed for Slc26a9 activity; and consistent with the data of Ko and colleagues (6), Slc26a6-STAS seems to activate function even in the context of Slc26a9 function.
In summary, our data show that a9STAS binds the R-region of CFTR (PKA-independent) and that this binding inhibits both the Slc26a9 nCl−-HCO3− exchange activity and the Slc26a9 Cl− channel activity (both PKA-independent) (Fig. 10, A and B). Some STAS domain is crucial for Slc26a9 channel activity. The STAS domain is less crucial for Slc26a9 electrogenic nCl−-HCO3− exchange because deletion or exchange does not remove this activity. Finally, our data imply that the mobile and dynamic R-region of CFTR can interact with any Slc26-STAS domain, but that individual STAS interactions will determine the physiological affect of this interaction. These findings will likely be critical for our understanding of Cl− and HCO3− transporting epithelia, especially those with impaired function in cystic fibrosis.
Acknowledgments
We thank G. Babcock, Heather L. Holmes, and Elyse M. Scileppi for excellent technical support. We also thank Dr. Julie Forman-Kay and Jennifer M. Baker (Hospital for Sick Children, Research Institute, Biochemistry, University of Toronto, Toronto, Ontario M5G1X8, Canada) for providing the purified (R)CFTR critical for these studies.
This work was supported, in whole or in part, by National Institutes of Health Grants DK056218, DK060845, EY017732 (to M. F. R.), and DK038226 and DK57708 (to D. B. M.). This work was also supported by grants from the Veterans Affairs (to D. B. M.), a grant-in-aid from the American Heart Association (to D. B. M.), a postdoctoral fellowship from the American Heart Association (to M. H. C. and K. Z.), and Cystic Fibrosis Foundation Grants ROMERO-06GO and SINDIC-06F0.
- CFTR
- cystic fibrosis transmembrane conductance regulator
- HA
- hemagglutinin
- PKA
- protein kinase A
- MBP
- maltose-binding protein
- wt
- wild-type
- aa
- amino acid(s)
- pHi
- intracellular pH
- STAS
- sulfate transporter anti-sigma.
REFERENCES
- 1.Bissig M., Hagenbuch B., Stieger B., Koller T., Meier P. J. (1994) J. Biol. Chem. 269, 3017–3021 [PubMed] [Google Scholar]
- 2.Mount D. B., Romero M. F. (2004) Pflügers Arch. 447, 710–721 [DOI] [PubMed] [Google Scholar]
- 3.Romero M. F., Chang M. H., Plata C., Zandi-Nejad K., Broumand V., Sussman C. R., Mount D. B. (2006) Novartis Found. Symp. 273, 126–138, discussion 138–147, 261–264 [PubMed] [Google Scholar]
- 4.Romero M. F., Chang M. H., Mount D. B. (2009) in Physiology and Pathology of Chloride Transporters and Channels in the Nervous System: From Molecules to Diseases ( Alvarez-Leefmans F. J., Delpire E. eds) Elsevier Science Publishers, New York [Google Scholar]
- 5.Liu X. Z., Ouyang X. M., Xia X. J., Zheng J., Pandya A., Li F., Du L. L., Welch K. O., Petit C., Smith R. J., Webb B. T., Yan D., Arnos K. S., Corey D., Dallos P., Nance W. E., Chen Z. Y. (2003) Hum. Mol. Genet. 12, 1155–1162 [DOI] [PubMed] [Google Scholar]
- 6.Ko S. B., Shcheynikov N., Choi J. Y., Luo X., Ishibashi K., Thomas P. J., Kim J. Y., Kim K. H., Lee M. G., Naruse S., Muallem S. (2002) EMBO J. 21, 5662–5672 [DOI] [PMC free article] [PubMed] [Google Scholar]
- 7.Ko S. B., Zeng W., Dorwart M. R., Luo X., Kim K. H., Millen L., Goto H., Naruse S., Soyombo A., Thomas P. J., Muallem S. (2004) Nat. Cell Biol. 6, 343–350 [DOI] [PMC free article] [PubMed] [Google Scholar]
- 8.Wang Y., Soyombo A. A., Shcheynikov N., Zeng W., Dorwart M., Marino C. R., Thomas P. J., Muallem S. (2006) EMBO J. 25, 5049–5057 [DOI] [PMC free article] [PubMed] [Google Scholar]
- 9.Xu J., Henriksnäs J., Barone S., Witte D., Shull G. E., Forte J. G., Holm L., Soleimani M. (2005) Am. J. Physiol. Cell Physiol. 289, C493–C505 [DOI] [PubMed] [Google Scholar]
- 10.Chang M. H., Plata C., Zandi-Nejad K., Sindic A., Sussman C. R., Mercado A., Broumand V., Raghuram V., Mount D. B., Romero M. F. (2009) J. Membr. Biol. 228, 125–140 [DOI] [PMC free article] [PubMed] [Google Scholar]
- 11.Dorwart M. R., Shcheynikov N., Wang Y., Stippec S., Muallem S. (2007) J. Physiol. 584, 333–345 [DOI] [PMC free article] [PubMed] [Google Scholar]
- 12.Loriol C., Dulong S., Avella M., Gabillat N., Boulukos K., Borgese F., Ehrenfeld J. (2008) Cell Physiol. Biochem. 22, 15–30 [DOI] [PubMed] [Google Scholar]
- 13.Plata C., Vázquez N., Romero M. F., Gamba G. (2008) FASEB J. 22, 1202.9 (abstr) [Google Scholar]
- 14.Xu J., Song P., Miller M. L., Borgese F., Barone S., Riederer B., Wang Z., Alper S. L., Forte J. G., Shull G. E., Ehrenfeld J., Seidler U., Soleimani M. (2008) Proc. Natl. Acad. Sci. U.S.A. 105, 17955–17960 [DOI] [PMC free article] [PubMed] [Google Scholar]
- 15.Shcheynikov N., Ko S. B., Zeng W., Choi J. Y., Dorwart M. R., Thomas P. J., Muallem S. (2006) Novartis Found. Symp. 273, 177–186; discussion 186–192, 261–174 [PubMed] [Google Scholar]
- 16.Dorwart M. R., Shcheynikov N., Baker J. M., Forman-Kay J. D., Muallem S., Thomas P. J. (2008) J. Biol. Chem. 283, 8711–8722 [DOI] [PMC free article] [PubMed] [Google Scholar]
- 17.Chan K. W., Csanády L., Seto-Young D., Nairn A. C., Gadsby D. C. (2000) J. Gen. Physiol. 116, 163–180 [DOI] [PMC free article] [PubMed] [Google Scholar]
- 18.Huth J. R., Bewley C. A., Jackson B. M., Hinnebusch A. G., Clore G. M., Gronenborn A. M. (1997) Protein Sci. 6, 2359–2364 [DOI] [PMC free article] [PubMed] [Google Scholar]
- 19.Donnelly M. I., Zhou M., Millard C. S., Clancy S., Stols L., Eschenfeldt W. H., Collart F. R., Joachimiak A. (2006) Protein Expr. Purif. 47, 446–454 [DOI] [PMC free article] [PubMed] [Google Scholar]
- 20.Baker J. M., Hudson R. P., Kanelis V., Choy W. Y., Thibodeau P. H., Thomas P. J., Forman-Kay J. D. (2007) Nat. Struct. Mol. Biol. 14, 738–745 [DOI] [PMC free article] [PubMed] [Google Scholar]
- 21.Liman E. R., Tytgat J., Hess P. (1992) Neuron 9, 861–871 [DOI] [PubMed] [Google Scholar]
- 22.Romero M. F., Fong P., Berger U. V., Hediger M. A., Boron W. F. (1998) Am. J. Physiol. 274, F425–F432 [DOI] [PubMed] [Google Scholar]
- 23.Sciortino C. M., Romero M. F. (1999) Am. J. Physiol. Renal Physiol. 277, F611–F623 [DOI] [PubMed] [Google Scholar]
- 24.Dinour D., Chang M. H., Satoh J., Smith B. L., Angle N., Knecht A., Serban I., Holtzman E. J., Romero M. F. (2004) J. Biol. Chem. 279, 52238–52246 [DOI] [PubMed] [Google Scholar]
- 25.Romero M. F., Henry D., Nelson S., Harte P. J., Dillon A. K., Sciortino C. M. (2000) J. Biol. Chem. 275, 24552–24559 [DOI] [PubMed] [Google Scholar]
- 26.Xie Q., Welch R., Mercado A., Romero M. F., Mount D. B. (2002) Am. J. Physiol. Renal Physiol. 283, F826–F838 [DOI] [PubMed] [Google Scholar]
- 27.Hästbacka J., Superti-Furga A., Wilcox W. R., Rimoin D. L., Cohn D. H., Lander E. S. (1996) Am. J. Hum. Genet. 58, 255–262 [PMC free article] [PubMed] [Google Scholar]
- 28.Rossi A., van der Harten H. J., Beemer F. A., Kleijer W. J., Gitzelmann R., Steinmann B., Superti-Furga A. (1996) Hum. Genet. 98, 657–661 [DOI] [PubMed] [Google Scholar]
- 29.Cai G., Nakayama M., Hiraki Y., Ozono K. (1998) Am. J. Med. Genet. 78, 58–60 [PubMed] [Google Scholar]
- 30.Hästbacka J., Kerrebrock A., Mokkala K., Clines G., Lovett M., Kaitila I., de la Chapelle A., Lander E. S. (1999) Eur. J. Hum. Genet. 7, 664–670 [DOI] [PubMed] [Google Scholar]
- 31.Rossi A., Cetta G., Piazza R., Bonaventure J., Steinmann B., Supereti-Furga A. (2003) Pediatr. Pathol. Mol. Med. 22, 311–321 [DOI] [PubMed] [Google Scholar]
- 32.Höglund P., Holmberg C., Sherman P., Kere J. (2001) Gut 48, 724–727 [DOI] [PMC free article] [PubMed] [Google Scholar]
- 33.Höglund P., Sormaala M., Haila S., Socha J., Rajaram U., Scheurlen W., Sinaasappel M., de Jonge H., Holmberg C., Yoshikawa H., Kere J. (2001) Hum. Mutat. 18, 233–242 [DOI] [PubMed] [Google Scholar]
- 34.Mäkelä S., Kere J., Holmberg C., Höglund P. (2002) Hum. Mutat. 20, 425–438 [DOI] [PubMed] [Google Scholar]
- 35.Everett L. A., Glaser B., Beck J. C., Idol J. R., Buchs A., Heyman M., Adawi F., Hazani E., Nassir E., Baxevanis A. D., Sheffield V. C., Green E. D. (1997) Nat. Genet. 17, 411–422 [DOI] [PubMed] [Google Scholar]
- 36.Coyle B., Reardon W., Herbrick J. A., Tsui L. C., Gausden E., Lee J., Coffey R., Grueters A., Grossmann A., Phelps P. D., Luxon L., Kendall-Taylor P., Scherer S. W., Trembath R. C. (1998) Hum. Mol. Genet. 7, 1105–1112 [DOI] [PubMed] [Google Scholar]
- 37.Zheng J., Shen W., He D. Z., Long K. B., Madison L. D., Dallos P. (2000) Nature 405, 149–155 [DOI] [PubMed] [Google Scholar]
- 38.Aronson P. S. (2006) Kidney Int. 70, 1207–1213 [DOI] [PubMed] [Google Scholar]
- 39.Monico C. G., Weinstein A., Jiang Z., Rohlinger A. L., Cogal A. G., Bjornson B. B., Olson J. B., Bergstralh E. J., Milliner D. S., Aronson P. S. (2008) Am. J. Kidney Dis. 52, 1096–1103 [DOI] [PMC free article] [PubMed] [Google Scholar]
- 40.Soleimani M. (2008) J. Physiol. 586, 1205–1206 [DOI] [PMC free article] [PubMed] [Google Scholar]
- 41.Mäkelä S., Eklund R., Lähdetie J., Mikkola M., Hovatta O., Kere J. (2005) Mol. Hum. Reprod. 11, 129–132 [DOI] [PubMed] [Google Scholar]
- 42.Everett L. A., Belyantseva I. A., Noben-Trauth K., Cantos R., Chen A., Thakkar S. I., Hoogstraten-Miller S. L., Kachar B., Wu D. K., Green E. D. (2001) Hum. Mol. Genet. 10, 153–161 [DOI] [PubMed] [Google Scholar]
- 43.Royaux I. E., Wall S. M., Karniski L. P., Everett L. A., Suzuki K., Knepper M. A., Green E. D. (2001) Proc. Natl. Acad. Sci. U.S.A. 98, 4221–4226 [DOI] [PMC free article] [PubMed] [Google Scholar]
- 44.Wagner C. A., Finberg K. E., Stehberger P. A., Lifton R. P., Giebisch G. H., Aronson P. S., Geibel J. P. (2002) Kidney Int. 62, 2109–2117 [DOI] [PubMed] [Google Scholar]
- 45.Wu X., Gao J., Guo Y., Zuo J. (2004) Brain Res. Mol. Brain Res. 126, 30–37 [DOI] [PubMed] [Google Scholar]
- 46.Dallos P., Wu X., Cheatham M. A., Gao J., Zheng J., Anderson C. T., Jia S., Wang X., Cheng W. H., Sengupta S., He D. Z., Zuo J. (2008) Neuron 58, 333–339 [DOI] [PMC free article] [PubMed] [Google Scholar]
- 47.Drexl M., Lagarde M. M., Zuo J., Lukashkin A. N., Russell I. J. (2008) J. Neurophysiol. 99, 1607–1615 [DOI] [PubMed] [Google Scholar]
- 48.Wang Z., Wang T., Petrovic S., Tuo B., Riederer B., Barone S., Lorenz J. N., Seidler U., Aronson P. S., Soleimani M. (2005) Am. J. Physiol. Cell Physiol. 288, C957–C965 [DOI] [PubMed] [Google Scholar]
- 49.Jiang Z., Asplin J. R., Evan A. P., Rajendran V. M., Velazquez H., Nottoli T. P., Binder H. J., Aronson P. S. (2006) Nat. Genet. 38, 474–478 [DOI] [PubMed] [Google Scholar]
- 50.Ishiguro H., Namkung W., Yamamoto A., Wang Z., Worrell R. T., Xu J., Lee M. G., Soleimani M. (2007) Am. J. Physiol. Gastrointest. Liver Physiol. 292, G447–G455 [DOI] [PubMed] [Google Scholar]
- 51.Seidler U., Rottinghaus I., Hillesheim J., Chen M., Riederer B., Krabbenhöft A., Engelhardt R., Wiemann M., Wang Z., Barone S., Manns M. P., Soleimani M. (2008) Pflugers Arch. 455, 757–766 [DOI] [PubMed] [Google Scholar]
- 52.Singh A. K., Amlal H., Haas P. J., Dringenberg U., Fussell S., Barone S. L., Engelhardt R., Zuo J., Seidler U., Soleimani M. (2008) Kidney Int. 74, 438–447 [DOI] [PMC free article] [PubMed] [Google Scholar]
- 53.Toure A., Lhuillier P., Gossen J. A., Kuil C. W., Lhote D., Jegou B., Escalier D., Gacon G. (2007) Hum. Mol. Genet. 16, 1783–1793 [DOI] [PubMed] [Google Scholar]
- 54.Wilson F. H., Disse-Nicodème S., Choate K. A., Ishikawa K., Nelson-Williams C., Desitter I., Gunel M., Milford D. V., Lipkin G. W., Achard J. M., Feely M. P., Dussol B., Berland Y., Unwin R. J., Mayan H., Simon D. B., Farfel Z., Jeunemaitre X., Lifton R. P. (2001) Science 293, 1107–1112 [DOI] [PubMed] [Google Scholar]
- 55.Choate K. A., Kahle K. T., Wilson F. H., Nelson-Williams C., Lifton R. P. (2003) Proc. Natl. Acad. Sci. U.S.A. 100, 663–668 [DOI] [PMC free article] [PubMed] [Google Scholar]
- 56.Kahle K. T., Wilson F. H., Leng Q., Lalioti M. D., O'Connell A. D., Dong K., Rapson A. K., MacGregor G. G., Giebisch G., Hebert S. C., Lifton R. P. (2003) Nat. Genet. 35, 372–376 [DOI] [PubMed] [Google Scholar]
- 57.Kahle K. T., Macgregor G. G., Wilson F. H., Van Hoek A. N., Brown D., Ardito T., Kashgarian M., Giebisch G., Hebert S. C., Boulpaep E. L., Lifton R. P. (2004) Proc. Natl. Acad. Sci. U.S.A. 101, 14877–14882 [DOI] [PMC free article] [PubMed] [Google Scholar]
- 58.Kahle K. T., Ring A. M., Lifton R. P. (2008) Annu. Rev. Physiol. 70, 329–355 [DOI] [PubMed] [Google Scholar]
- 59.Shcheynikov N., Kim K. H., Kim K. M., Dorwart M. R., Ko S. B., Goto H., Naruse S., Thomas P. J., Muallem S. (2004) J. Biol. Chem. 279, 21857–21865 [DOI] [PubMed] [Google Scholar]
- 60.Bertrand C. A., Zhang R., Pilewski J. M., Frizzell R. A. (2009) J. Gen. Physiol. 133, 421–438 [DOI] [PMC free article] [PubMed] [Google Scholar]
- 61.Detro-Dassen S., Schänzler M., Lauks H., Martin I., zu Berstenhorst S. M., Nothmann D., Torres-Salazar D., Hidalgo P., Schmalzing G., Fahlke C. (2008) J. Biol. Chem. 283, 4177–4188 [DOI] [PubMed] [Google Scholar]
- 62.Lohi H., Lamprecht G., Markovich D., Heil A., Kujala M., Seidler U., Kere J. (2003) Am. J. Physiol. Cell Physiol. 284, C769–C779 [DOI] [PubMed] [Google Scholar]
- 63.Chernova M. N., Jiang L., Shmukler B. E., Schweinfest C. W., Blanco P., Freedman S. D., Stewart A. K., Alper S. L. (2003) J. Physiol. 549, 3–19 [DOI] [PMC free article] [PubMed] [Google Scholar]
- 64.Shibagaki N., Grossman A. R. (2006) J. Biol. Chem. 281, 22964–22973 [DOI] [PubMed] [Google Scholar]
- 65.Chen A. P., Chang M. H., Sindic A., Mount D. B., Romero M. F. (2009) FASEB J. 23, 796.24 (abstr) [Google Scholar]
- 66.Chang M. H., DiPiero J., Sönnichsen F. D., Romero M. F. (2008) J. Biol. Chem. 283, 18402–18410 [DOI] [PMC free article] [PubMed] [Google Scholar]


