Abstract
Motivation: Quantitative real-time polymerase chain reaction (qPCR) is routinely used for RNA expression profiling, validation of microarray hybridization data and clinical diagnostic assays. Although numerous statistical tools are available in the public domain for the analysis of microarray experiments, this is not the case for qPCR. Proprietary software is typically provided by instrument manufacturers, but these solutions are not amenable to the tandem analysis of multiple assays. This is problematic when an experiment involves more than a simple comparison between a control and treatment sample, or when many qPCR datasets are to be analyzed in a high-throughput facility.
Results: We have developed HTqPCR, a package for the R statistical computing environment, to enable the processing and analysis of qPCR data across multiple conditions and replicates.
Availability: HTqPCR and user documentation can be obtained through Bioconductor or at http://www.ebi.ac.uk/bertone/software.
Contact: bertone@ebi.ac.uk
1 INTRODUCTION
Quantitative real-time polymerase chain reaction (qPCR) is widely used for the detection of specific nucleic acids, measurement of RNA transcript abundance and validation of high-throughput experimental results. qPCR is often performed in standard 96-well plates, and newer instruments can utilize higher density formats. These include the Roche LightCycler, which can accommodate 384-well thermocycler blocks, and the Applied Biosystems TaqMan machines employing 384-well Low Density Array (TLDA) micro-fluidic cards.
The technology relies on fluorescence data as a measure of RNA or DNA template concentration, represented by cycle threshold (Ct) values determined at the initial phase of exponential amplification. The calculation of fold changes between genes often entails only limited comparisons of Ct values across two conditions, and omits statistical testing of the significance of observed differences.
We have developed a package for high-throughput analysis of qPCR data (HTqPCR) within the R/Bioconductor framework (Gentleman et al., 2004). The software performs quality assessment, normalization, data visualization and statistical significance testing for Ct values between features (genes and microRNAs) across multiple biological conditions, such as different cell culture treatments, comparative expression profiles or time-series experiments.
2 SOFTWARE FEATURES
HTqPCR is developed for the R statistical computing environment (www.r-project.org), will run on all major platforms and is available as open source. Core R and Bioconductor packages are the only software dependencies and the package includes a detailed tutorial.
2.1 Data input requirements
The input data format consists of tab-separated text files containing Ct values, feature identifiers (genes, microRNAs, etc.) and other (optional) information. Data files can be user-formatted plain text or the direct output of Sequence Detection Systems (SDS) software. Internally, this information is embodied as instances of the qPCRset class, which are analogous to the ExpressionSet objects typically used to represent fluorescence data in microarray analyses.
2.2 Visualization features
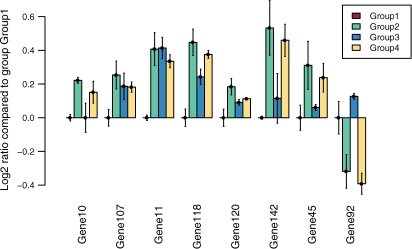
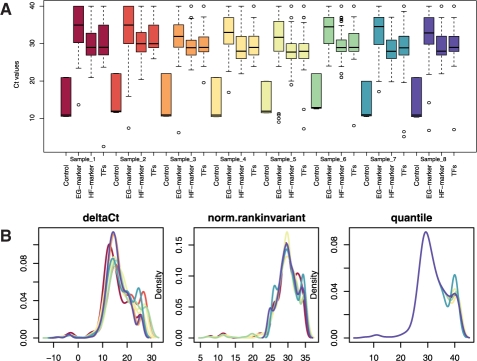
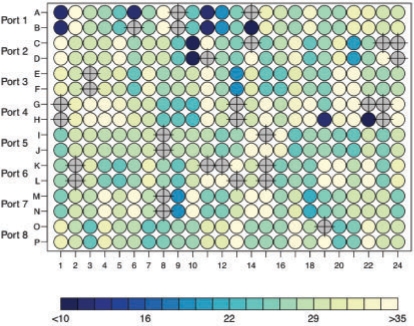
HTqPCR contains multiple functions for data visualization. Subsets of genes across one or more samples can be represented in bar plots, displaying either absolute Ct values or fold changes compared with a calibrator sample (Fig. 1). Data quality control across samples can be assessed via diagnostic aids such as density distributions, box plots, scatterplots and histograms, some of which can be stratified according to various attributes of the features (Fig. 2). When qPCR assays are performed in multiwell plates or another spatially defined layout, the Ct values can be plotted accordingly to visualize any spatial artifacts such as edge effects (Fig. 3). Clustering of samples or genes can be performed using principal component analysis, heatmaps or dendrograms.
Fig. 1.
Log2 ratios between the normalized Ct values for four different sample groups, relative to the calibrator (Group 1; ratio=0.0). Error bars indicate the 90% confidence interval compared with the average calibrator Ct.
Fig. 2.
Box plot of Ct values across all samples, stratified based on the class membership of each gene (A) and the distribution of Ct values across samples after normalization using three different methods (B).
Fig. 3.
Ct values for a typical qPCR assay performed in 384-well format. Gray wells overlaid with crosses were flagged as ‘Undetermined’.
2.3 Ct quality control
Individual Ct values are a principal source of uncertainty in qPCR results. This can arise due to inherent bias in the amplification conditions (variable primer annealing, amplicon sequence content, suboptimal reaction temperature or salt concentration, etc.), or when initial template concentrations are insufficient to generate copy numbers exceeding the minimum detection threshold. In HTqPCR, the reliability of Ct values can be assessed either individually or across replicates. Through user-adjustable parameters all values are flagged as one of ‘OK’, ‘Undetermined’ or ‘Unreliable’, and this information is propagated throughout the analysis. Non-specific filtering can be applied to remove genes that are marked ‘Undetermined’ and/or ‘Unreliable’ across samples, or those having low variability (i.e. not differentially expressed) after normalization.
2.4 Data normalization
The qPCR data are often normalized by subtracting average Ct values from those of predetermined housekeeping genes, producing a ΔCt readout (Livak and Schmittgen, 2001). More sophisticated normalization procedures are also implemented in HTqPCR, for use when housekeeping genes are not present or not reliably expressed. Three different normalization options are available in HTqPCR: (i) rank-invariant features across the experiment can be used to scale each sample; (ii) quantile normalization can be performed to produce a uniform empirical distribution of Ct values across samples; and (iii) a pseudo-mean or -median reference can be defined, rank-invariant features for each sample are identified, and a normalization curve is generated by smoothing the corresponding Ct values (Fig. 2B). For the rank-invariant methods, low-quality Ct values can also be excluded when calculating a scaling factor or normalization curve, thereby avoiding additional bias.
2.5 Statistical testing
Assuming normally distributed Ct values and equal variance across sample groups being compared, fold-change significance can be assessed in two ways: applying a t-test between two conditions, or using methods from the limma package (Smyth, 2005) for more sophisticated comparisons. Information about the quality of each feature (‘OK’, ‘Undetermined’ or ‘Unreliable’) across biological and technical replicates is summarized in the final results.
3 CONCLUSIONS
Efficient data processing is required for the use of high-throughput qPCR applications. HTqPCR is a software package amenable to the analysis of high-density qPCR assays, either for individual experiments or across sets of replicates and biological conditions. Methods are implemented to handle all phases of the analysis, from raw Ct values, quality control and normalization to final results. As the software is R based, it runs on different operating systems and is easy to incorporate into an analysis pipeline, or used in conjunction with other tools available through the Bioconductor project.
ACKNOWLEDGEMENTS
The authors thank Steven Pollard and Anna Falk (Wellcome Trust Centre for Stem Cell Research, Cambridge) for useful discussions.
Funding: EMBL and Cancer Research UK (Grant C25858/A9160).
Conflict of Interest: none declared.
REFERENCES
- Gentleman RC, et al. Bioconductor: open software development for computational biology and bioinformatics. Genome Biol. 2004;5:R80. doi: 10.1186/gb-2004-5-10-r80. [DOI] [PMC free article] [PubMed] [Google Scholar]
- Livak KJ, Schmittgen TD. Analysis of relative gene expression data using real-time quantitative PCR and the 2−ΔΔCtmethod. Methods. 2001;25:402–408. doi: 10.1006/meth.2001.1262. [DOI] [PubMed] [Google Scholar]
- Smyth GK. Bioinformatics and Computational Biology Solutions using R and Bioconductor. New York: Springer; 2005. Limma: linear models for microarray data; pp. 397–420. [Google Scholar]


