Abstract
Background
Gas exchange between the middle ear and adjacent compartments determines the trajectory of middle ear pressure change. Little information is available regarding the permeability of the tympanic membrane (TM) to physiological gases.
Objective
Determine in vivo if the human TM is permeable to O2 and CO2 at physiologic transTM pressure gradients.
Methods
An ear canal (EC) probe (ECP) constructed from a custom-fitted acrylic body, a glass capillary tube enclosing an oil meniscus to maintain ambient ECP+EC pressure and a silica glass microtube linked to a mass spectrometer (MS) for measuring gas composition was hermetically sealed within one ear canal of 15 adults. ECP+EC volume was measured and gas samples taken at 10 minute intervals for 1 hour. 1:100,000 epinephrine was applied topically to the ipsilateral TM to decrease blood flow and the experiment repeated. The MS recorded ECP+EC pressures of O2 (32 AMU) and CO2 (44 AMU) were regressed on time and the slope divided by the predicted transTM partial-pressure gradients to yield estimates of transTM O2 and CO2 conductance.
Results
Consistent with expectation for transTM gas exchange, ECP+EC O2 decreased and CO2 increased during the experiments. TransTM CO2 exchange was faster after application of the epinephrine suggesting an effect of perfusion on that estimate. The ratio of O2/CO2 conductances was approximately 5 which is not consistent with the TM acting primarily as a water or lipid barrier to diffusion.
Conclusion
The human TM is permeable to CO2 and O2 at physiologic pressure gradients.
INTRODUCTION
A near equivalence between middle ear (ME) and environmental (ambient) pressure is prerequisite for optimal ME function as a transducer coupling tympanic membrane (TM) vibrations due to environmental sound pressures to oval window vibrations for cochlear stimulation (1, 2). However, ambient-ME pressure equivalence is intrinsically unstable because environmental pressure is continuously changing with weather conditions and/or elevation and ME pressure shows a net decrease over time (3).
Because the ME is a relatively non-collapsible (ignoring the relatively small volume displacements of the TM vis a vis ME volume), temperature stable, closed (in the absence of Eustachian tube openings) gas pocket, its pressure is determined by the total number of gas moles that it contains (4). Consequently, transfers of gas to or from the ME change its pressure. Under physiological conditions, ME gas transfers can occur over three passive and one active exchange routes (5). Passive exchange occurs between the ME and local blood via the ME mucosa, the ME and inner ear via the round window membrane and, perhaps, the ME and atmosphere via the TM. The dynamics of these passive exchanges conform to the Fick laws of diffusion which specify that the exchange rates for each gas species depends on the extant trans-barrier partial-pressure gradient and certain physiochemical properties of the exchange barrier (6). Active ME gas exchange is characterized by bolus transfer of mixed gases between ME and nasopharynx during periodic, transient openings of the Eustachian tube. The volume of gas transferred during a tubal opening depends on the total nasopharynx-ME pressure gradient and on specific functional properties of the tube (e.g. resistance, opening duration etc) (7). The algebraic sum of gas species transfers across all pathways for successive, short, time-intervals determines the long-term trajectory of ME pressure change.
Gas exchange between the ME and both the inner ear and blood does not depend on the local ambient pressure, and therefore, those exchanges tend to decouple ME pressure from ambient pressure leading to pressure imbalances. In contrast, gas exchange across the Eustachian tube depends on the ambient (at the Nasopharynx)-ME pressure gradient and, as such, drives ME pressure toward the local ambient pressure and decreases any pre-existing ME-ambient pressure deviations (5). However, the effect of transTM gas exchange on the ME-ambient pressure balance is difficult to predict. Some mathematical models suggest that transTM gas exchange can contribute to ME-ambient pressure equalization (8, for example, consider the extreme case of TMs with functioning tympanostomy tubes), but the validity of those solutions depends on model parameters whose values are not known for the human ME.
There remains a question as to whether or not the TM is permeable to inert and reactive gases at physiological gradients. Early ex vivo and in vivo experiments failed to demonstrate significant transTM transfers of either CO2 (9) or Xenon gas (10). These results contrast with those for experiments in cats (4, 11), monkeys (8) and chinchillas (12) where in vivo transTM exchange of both inert and reactive gases was demonstrated. However, the animal experiments required invasive methodologies to establish known driving gradients for transTM gas transfers and to measure the exchange rates for specified gases at different applied gradients. For ethical reasons, similar types of experiments cannot be done in humans.
In this report, a methodology for measuring transTM CO2 (ME to environment) and O2 (environment to ME) exchange in humans is described and preliminary results presented. The method takes advantage of the extant physiolological transTM gradients for O2 and CO2 (5). Assuming the validity of past experimental studies on gas exchange for the human TM (9, 10), the null hypothesis tested is that the human TM is not permeable to CO2 and/or O2 at physiological transTM pressure gradients.
METHODS
Study Subjects
Healthy, adult (18 to 50 years old) volunteer subjects with disease-free MEs were recruited by advertisement for entry into this study of gas exchange across the “normal” TM. The study protocol was approved by the IRB at the University of Pittsburgh. Presenting subjects provided written informed consent for participation and were screened for a negative history of otitis media, other diseases affecting the TM (e.g. cholesteatoma, atrophy, sclerosis), and/or past TM perforation. The TM was examined using pneumatic otoscopy for no evidence of retraction, bulging, atrophy or sclerosis, and documentation of a white-pink color, good mobility and semi-translucency with a ground glass appearance. All MEs had a Type A tympanogram. All TMs with MEs satisfying these conditions were classified as “normal” and eligible for testing under the study protocol. One “normal” TM in each of 15 adult subjects was tested using the described protocol.
Instrumentation
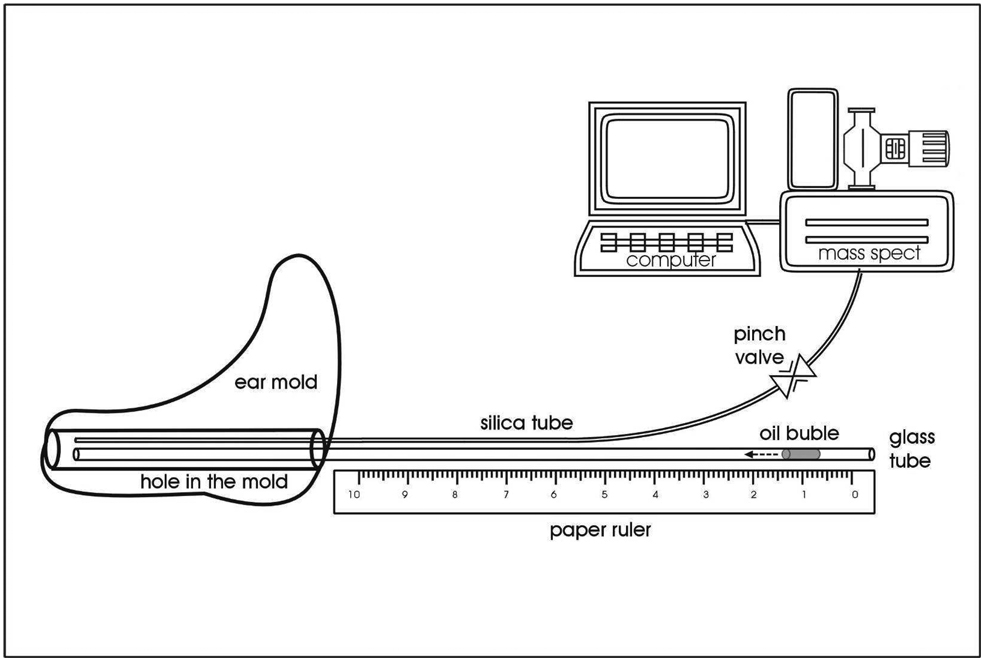
For all consenting subjects with a “normal” TM and healthy ME on screening, an impression of the ipsilateral ear-canal (EC) was made using a two-part silicone impression material (Mega-sil, Microsonics Inc, Burnham, PA). The resulting impressions were sent to a manufacturing company (Microsonic Inc, Ambridge, PA 15003) for fabrication of acrylic ear plugs custom-fitted to the molded ECs. Each acrylic ear plug was drilled and fitted with a calibrated glass capillary tube (Calibrated Color Coded Disposable Micropipets, 100µl, VWR Scientific, West Chester, PA USA, OD=1.7 mm ID=1.3 mm) and a 50 cm length of fused silica glass tubing (50 micron, Scientific Glass Engineering model number 062463), each extending through the plug from its outer, environmental surface to a point proximal to the TM. These tubes were hermetically sealed within the ear plug using Epoxy Gel (The Original Super Glue, Pacer Technology, LLC, Rancho Cucamango, CA USA). The complete assembly is referred to as the EC probe (ECP), and the internal volume of the ECP and enclosed EC volume between ECP as the ECP+EC volume. (See Figure 1)
Figure 1.
Schematic diagram showing the ECP design (acrylic ear mold) with embedded capillary tube and silica glass microtubing and the configuration of the “one line” instruments for measuring gas composition (Mass Spec) and analyzing the resulting data (microcomputer).
For an experiment, the silica microtubing from the ECP was attached via a pneumatic pinch valve to same diameter silica microtubing leading to the inlet port of an Ametek Turbo-Molecular pump (TCP 121 Electronic Drive Unit and TSU 050 Pumping Unit) coupled to a Dycor (model#M100M) quadrapole mass spectrometer (MS). The serial port of a microcomputer was connected to that of the MS. The MS had a steady-state total pressure of approximately 1 µtorr with the pinch valve closed and 2 to 3 µtorr with the valve open. The flow rate through the microtubing during sample acquisition was approximately 20 µl/min. On each test day, the MS was calibrated to ambient air. MS data were retrieved using manufacturer supplied software (Dycor) with ion current values at 28 (N2), 32 (O2), 40 (Ar) and 44 (CO2) Atomic Mass units (AMU) outputted to the memory of the microcomputer for analysis.
Experimental Protocol
On the day of the experiment, the subject presented to the ENT research laboratory, his/her ears were examined by otoscopy and bilateral tympanometry was done to document “normal” TMs and disease-free MEs. The subject was seated in an ENT exam chair that was reclined to a comfortable position. The ECP surface that contacts the EC was covered with water-based, spirit gum glue (Kryolan, Water Soluable Spirit Gum, Berlin Kryolan Corp, SF, CA USA) and introduced into the ipsilateral EC and the ECP microtubing was connected to the pinch valve. ECP+EC volume was measured by coupling, via a valve, the capillary tube to a pressurized, fixed volume cavity with attached pressure transducer of known volume, opening the interposed valve, and recording the pressure change of the system. The total system volume was calculated using Boyle’s Law and the ECP+EC volume calculated by subtraction. The adequacy of the ECP+EC pressure seal was evaluated by applying a pressure to the capillary tube and documenting a lack of pressure decay over time. Then, a small volume of olive oil was introduced into the capillary tube forming a linear meniscus whose position within the capillary tube was measured against a ruled tape. Barometric pressure and ambient temperature were recorded, the pinch valve opened and a 30 second gas sample was taken from the ECP+EC for MS analysis of gas composition. Then, the pinch valve was closed and the position of the meniscus was recorded to document the volume lost to sampling. This sampling procedure was repeated every 10 minutes for 1 hour. Then, the ECP was removed from the EC, the oil was evacuated from the capillary tube by suctioning and the internal volume of the ECP was washed with room air. After a short break (≈10 minutes), 0.5 cc of 1:100,000 epinephrine was applied to the ipsilateral TM and, after a 5 minute exposure, the EC was suctioned dry. The ECP was reinserted as described above and the experiment repeated.
Data
The data from each experiment consist of the barometric pressure, ambient temperature, estimates of ECP+EC volume, the change in volume after each sample, and the ion currents (mass spectrometer pressures =mspAMU) for the samples recorded at 28 (N2), 32 (O2), 40 (Ar) and 44 (CO2) AMU taken at 10 minute intervals during the 60 minutes before (Phase 1) and after (Phase 2) topical application of epinephrine to the TM.
Methodology for Data Analysis
Passive, diffusion-limited gas exchange across a simple barrier such as the TM is described by the Fick equation as:
| Equation 1) |
where QTMg is the volume flow of gas g across the TM, ΔPTMg is the transTM gas g pressure gradient, STMg and DTMg are the solubility and diffusion coefficient of gas g in the TM, and ATM and TTM are the TM surface area and thickness (6). For a given TM, the product SgDgATM/TTM is a constant, KTMg , and the exchange equation can be rewritten as:
| Equation 2) |
This form of the equation shows that QTMg is a linear function of ΔPTMg with slope KTMg (=STMgDTMgATM/TTM) and intercept equal to 0. Gas conductance for the TM can be defined as volume gas flow at a specified transTM partial-pressure gradient which is shown by rearranging Equation 2 to be equal to KTMg or:
| Equation 3) |
TransTM conductances for all physiological gases are the requisite parameters of models that describe the effect of transTM gas exchange on the ME-ambient pressure balance. However, the solubility and diffusivity of individual gases in the bulk composition of the TM cannot be predicted and the average thickness of a given TM is not easily measured in vivo (4, 8, 11). Therefore, transTM conductance for each represented gas species must be determined empirically which requires concurrent measurement of the extant partial-pressure gradient and transTM gas flow for each gas species.
In the experiments described here, advantage is taken of the large, physiological transTM CO2 and O2 pressure gradients. Specifically, the N2, O2, CO and Ar pressures in the ME adjusted to a standard total pressure of 760 mmHg, and assuming H2O saturation at body temperature (47 mmHg), were measured in humans to be approximately 612, 41, 53 and 7 mmHg (13, 14) while the pressures of those gases in the atmosphere are 593, 159, 1 and 7 mmHg. Thus, significant transTM ME-ambient gradients for CO2 of 52 mmHg and for O2 of -118 mmHg are extant, and because the gas partial-pressures in the ECP+EC at the start of each experiment are atmospheric, these gradients can be used to estimate the initial ΔPTMCO2 and ΔPTMO2 for calculation of transTM CO2 and O2 conductance (See Equation 3).
In the experiments, volume gas flow across the TM was not measured directly. However, this is proportional to the directional transfer of gas moles per unit time (δNECPg/δt). For gas transfers to or from a relatively fixed volume compartment (such as that approximated by the ECP+EC), the gas transfer rate is a linear function of the rate of change in gas partial-pressure as given by:
| Equation 4 |
where M is a constant of proportionality (=δNECPg/δt/ QTMg), NECPg/δt is the rate of change in moles of gas g in the ECP+EC, R is the molar gas constant, TECP is the ECP+EC temperature in degrees Kelvin (=room temperature), PECPg is the partial-pressure of gas g in the ECP+EC, and VECP is the ECP+EC volume. By measurement, the change in VECP during each experiment was small relative to the initial volume and, to simplify the calculations, ECP+EC volume was considered to be constant for each experiment. Recognizing that that the ECP+EC partial-pressure of a gas is equal to the gas pressure measured by the MS (ion current for the gas) multiplied by a constant of proportionality (C) and substituting CmspAMU for PECPg in Equation 4 yields;
| Equation 5 |
where L is a constant for a given TM equal to VECP(MRTECP)−1 and C is equal to PECPg/mspAMU.
Given the directional, extant transTM partial-pressure gradients discussed above, documentation of a progressive increase in ECP+EC CO2 and decrease in O2 during an experiment will be cause to reject the null hypothesis that the TM is impermeable to those gases. This was evaluated by regressing msp32 and msp44 on time and testing the slopes of those functions for a significant difference from 0 using a 1-tailed, Student’s t test.
Information regarding the physiochemical properties of the TM can be derived from comparative analyses of the paired O2 and CO2 transTM gas flows measured on the same TM in the same experiment. Combining Equation 5 with Equation 1 and rearranging terms yields;
| Equation 6 |
where δ(msp-AMU)/δt can be calculated by linear regression as the slope of the linear portion of the (msp-AMU) versus time function, and the initial ΔPTMg is known. The ratio of conductances for paired gases measured in the same experiment can be calculated as the ratio of the calculated δ(mspAMU)/δt(ΔPTMg)−1 for the two gases (C and L on the left side of the equation divide out), and that value is equal to the ratio of the product of solubility and diffusivity for the two gases (ATM and TTM on the right side of the equation divide out). The solubility and permeability of O2 and CO2 in lipids and water are known and this derivation can be used to determine if the TM behaves as a lipid, water or mixed barrier to CO2 and O2 exchange. There the measured O2/CO2 conductance ratio was compared to the predicted values using a 2 tailed, Students t test.
To compare the transTM gas conductance for different experiments performed at different times, estimates of absolute transTM gas conductances are required. This can be expressed as the rate of change in moles per time (δNECPg/δt) divided by the extant gradient (ΔPTMg). From Equation 4, the numerator of this ratio can be calculated as VECP(RTECP)−1 δPECPg/δt. With the exception of δPECPg/δt, all other terms are either measured by experiment or known constants. To estimate δPECPg/δt without the introduction of a proportionality constant (C) with unknown value, a fractional gas pressure for the ECP+EC can be calculated as the mspAMU for a given gas divided by the sum of mspAMUs for all represented gases (mspAMU/ΣgmspAMU). Fractional pressure can be converted to partial-pressure by multiplying by total ECP+EC pressure (=ambient) and the rate of change in ECP+EC partial-pressure can be expressed as:
| Equation 7 |
and calculated as the slope of the time function using linear regression. This value is entered into Equation 4 to solve for δNECPg/δt which is then divided by the extant transTM partial-pressure gradient for the gas (ΔPTMg) to yield a transTM gas conductance (KTMg) with the units, gas moles/time/mmHg.
A caveat to the use of this method for calculation is that the change in ECP+EC fractional pressure for a given gas depends not only on the number of moles of that gas transferred to or from the ECP+EC but on the transfer rate of other represented gases as well. For example, the more rapid transTM exchange of CO2 vis a vis O2 observed for the measured δmspAMU/δt will cause a progressive increase in the fractional CO2 pressure as well as a progressive lowering in the fractional O2 pressure with the latter reflected as an overestimate of the true rate of ECP+EC O2 loss. Computer modeling using the observed rates of change in ECP+EC mspAMUs with time shows a very limited influence of this effect on the δPECPCO2/δt estimates but a significant overestimation of the δPECPO2/δt. Therefore, presented comparisons of conductances between experiments are limited to those calculated for transTM CO2 exchange.
Statistical Analysis
Data analyses and statistical testing were done using the NCSS 2000 Statistical Package (Kaysville, Utah, USA). Slopes for various functions were calculated using least squares linear regression operating on the complete data for the 60 minute period, or, when calculating representations of CO2 conductance, on the data for the first 20 minutes of each period. The latter restriction was imposed to limit the magnitude of decay in the transTM CO2 gradient (assumed to be constant) consequent to the rapid, progressive increase in ECP+EC CO2 pressure. Linear relationships between variables were expressed by calculating the Pearson Product Moment Correlation Coefficient (r). Most statistical comparisons were done using a Student’s t test or the appropriate non-parametric test when applicable. Significance was assigned at α≤.05. The convention average±standard deviation is used consistently in reporting the results.
RESULTS
A total of 15 adult volunteers aged 18 to 42 years (8 males; 7 females 13 white, 2 black) met the entry criteria for the study and were enrolled. The experiment was done on 2 of the right ears and 13 of the left ears. Two of the 15 experiments failed due to a blockage of the microcapillary tubing within the ECP.
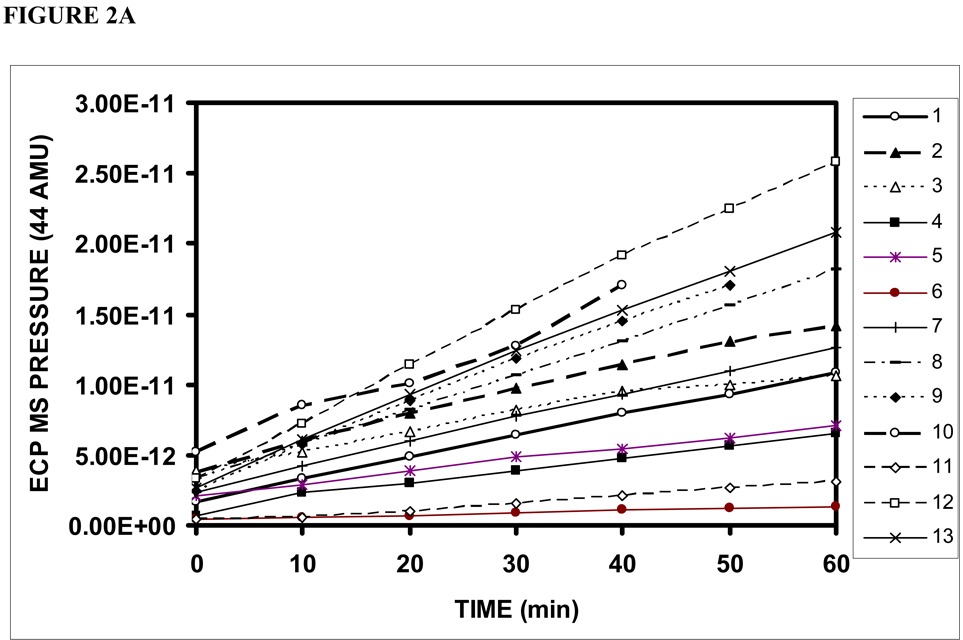
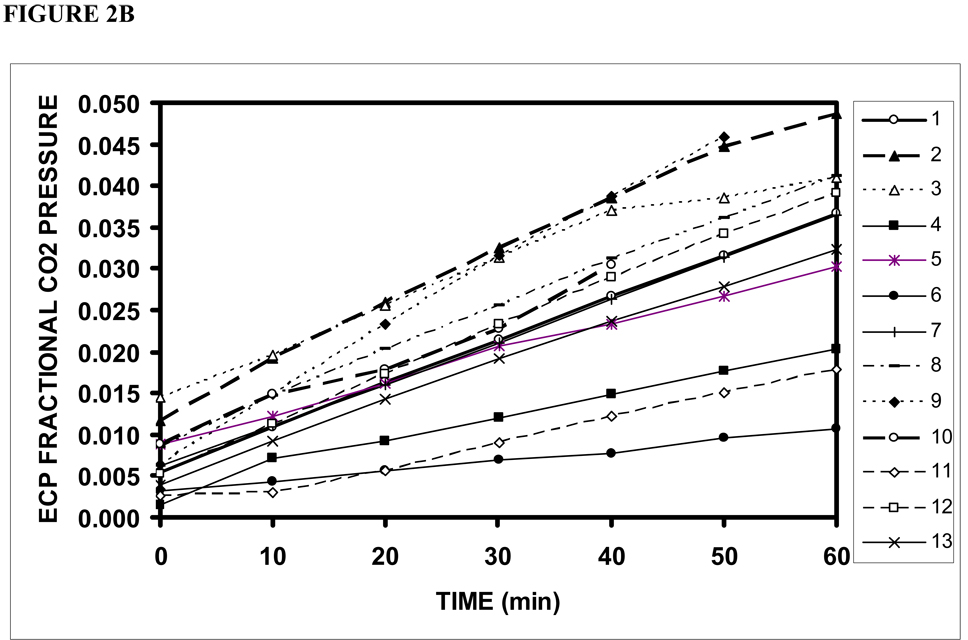
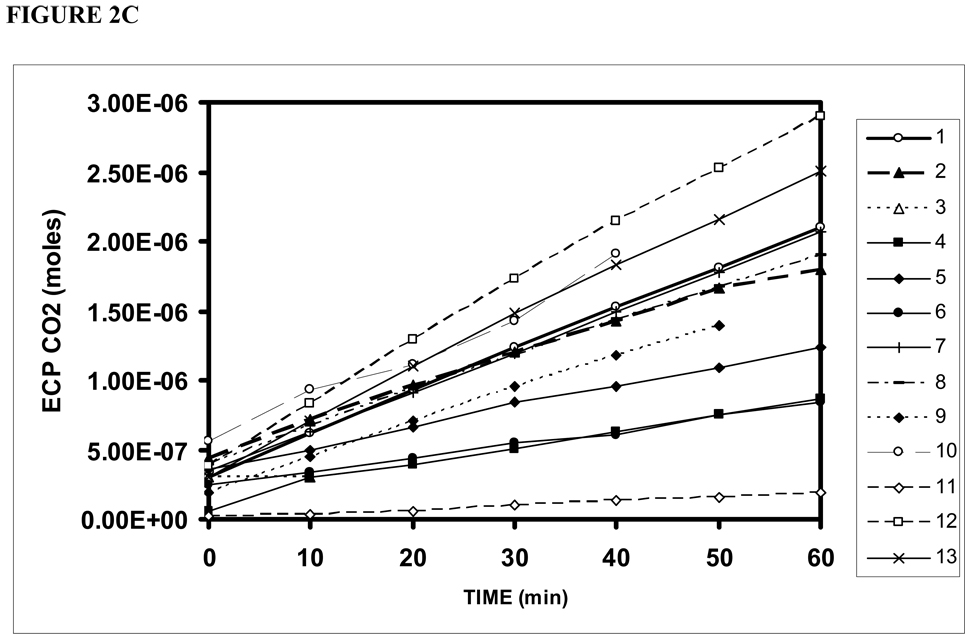
Figure 2 shows the ECP+EC msp44 (a), CO2 fractional pressure (b) and calculated CO2 moles (c) as a function of time for Phase 1 of each experiment. The data from all experiments showed a significant, time-dependent increase in the three measures with slopes that varied among TMs from 1.59×10⁻¹⁴ to 3.78×10⁻¹³ (average=1.81×10⁻¹³±1.10×10⁻¹³ , p<.01) msp44/min, from .0001 to .0008 (average=.0005±.0002, p<.01) /min and from 2.91×10⁻⁹ to 4.21×10⁻⁸ (average= 2.19×10⁻⁸±1.16×10⁻⁸, p<.01) moles/min, respectively. A progressive increase in ECP+EC CO2 until ME and ECP+EC CO2 equivalence is predicted by the extant transTM pressure gradient, and thus, these results demonstrate that the human TM is permeable to CO2.
Figure 2.
ECP+EC CO2 measured as MS pressure at 44 AMU (a), fractional MS pressure at 44 AMU (b) and calculated CO2 moles (c) as a function of time for phase 1 of the 13 successful experiments on individual TMs.
Simultaneously measured msp32 showed a relatively linear, significant decrease with time with slopes varying among TMs from −1.89×10⁻¹⁴ to −3.37×10⁻¹³ (average=−1.35×10⁻¹³±1.02×10⁻¹³, p<.01) msp32/minute. A progressive decrease in ECP+EC O2 until ME O2 equivalence is predicted by the extant transTM pressure gradient, and thus, this result demonstrates that the human TM is permeable to O2.
The linearity of these data over most of the time period for both O2 and CO2 suggests that the gas transfers did not appreciably affect the driving gradient for the exchange. However, for some TMs, the measured ECP-EC CO2 fractional pressures at 60 minutes approached the fractional CO2 pressures for the ME (.6–.8) and, therefore, all CO2 slopes were calculated over the first 20 minutes of the experiments.
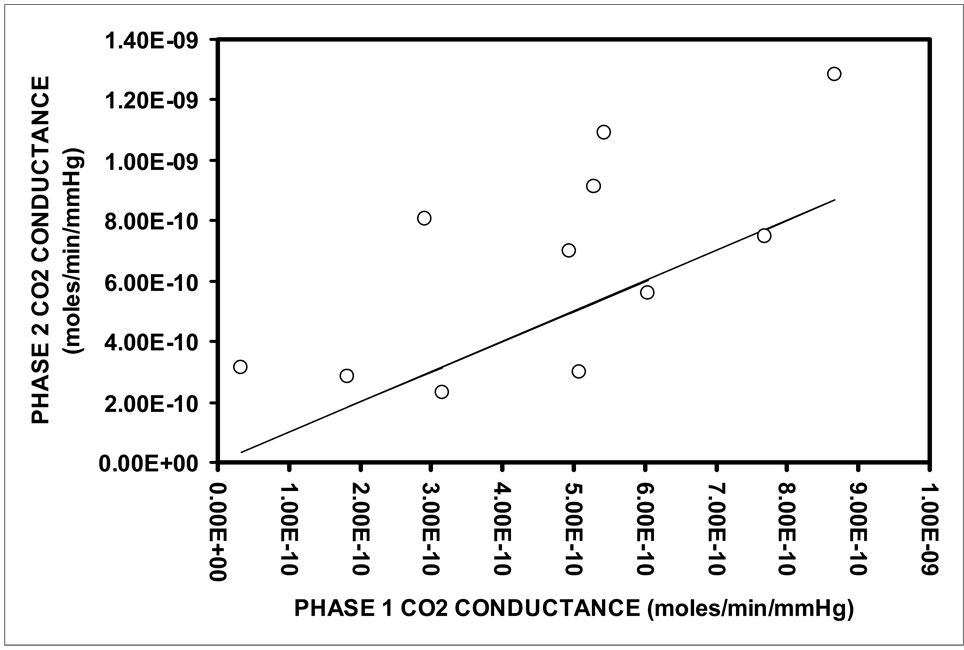
Figure 3 shows a scatterplot of the CO2 conductance estimated as moles/min/mmHg (over the first 20 minutes of each period) during Phase 2 as a function of that measured during Phase 1 of each experiment. Regression analysis documented a linear relationship between these paired observations (Phase 2 conductance= 0.98×Phase 1 conductance+2.0×10⁻¹⁰, r=.68, p<.01). As shown in the figure, the majority of the Phase 2 CO2 conductances lie above the line of identity for the Phase 1 conductances reflecting greater values and this is supported by the nonzero intercept for the regression (2.0×10⁻¹⁰± 8.7×10⁻¹⁰). The between-Phase difference in CO2 paired conductance values was statistically significant (2-tailed, Wilcoxon Signed-Rank Test, Z=2.0, P=.05). These results support an effect of intraTM blood perfusion on the estimated transTM CO2 exchange rate.
Figure 3.
Scatterplot of the calculated Phase 2 CO2 conductance in units of moles/min/mmHg versus the paired Phase 1 conductance for each experiment with complete data for the two Phases. Solid line is the identity for the Phase 1 CO2 conductance.
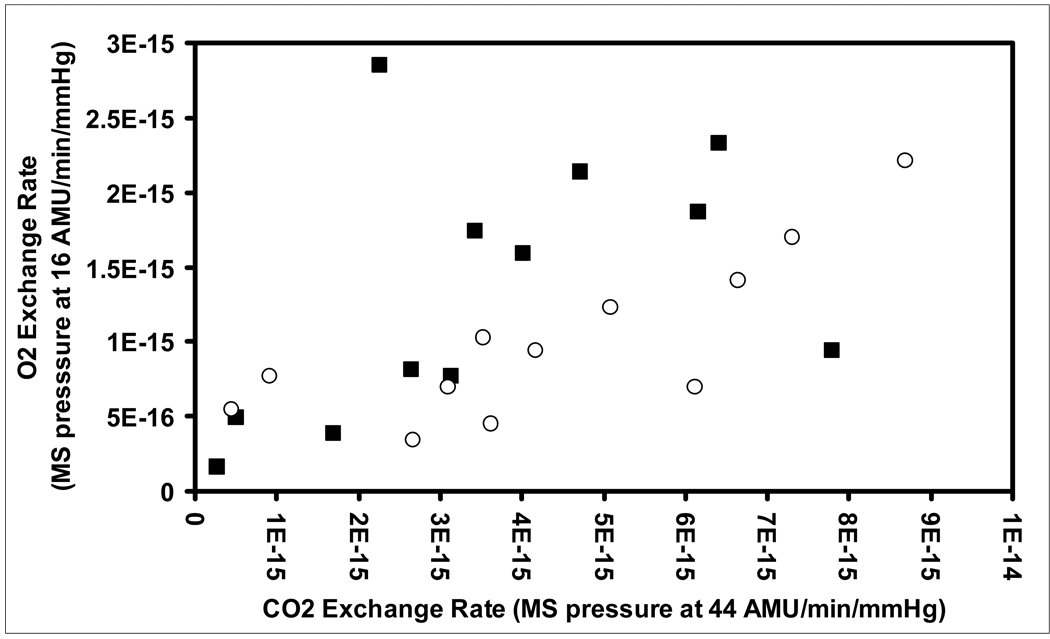
Figure 4 shows a scatterplot of the simultaneously measured transTM O2 exchange rate calculated as msp32/min/mmHg (over 60 minutes) as a function of the CO2 exchange rate calculated as msp44/min/mmHg (over 20 minutes) for both Phases of all experiments with paired measures. For the Phase 1 and 2 data sets, regression analyses documented that the O2 exchange rate was linearly related to the CO2 exchange rate (Phase 1: O2 exchange rate = 0.17×CO2 exchange rate+7.18×10⁻¹⁶, r=.45, p<.01; Phase 2: O2 exchange rate=0.18×CO2 exchange rate+2.23×10⁻¹⁶, r=.81, p<.01). The linear fit of the regression equation (estimated by r2 as the fraction of the variance in transTM O2 exchange rate explained by the regression) was significantly better for Phase 2 data when compared to the Phase 1 data (P<.01). The average CO2/O2 exchange rate ratio (=CO2/O2conductance ratio) calculated from paired observations was 3.0±2.0 for Phase 1 and 4.7±2.5 Phase 2, but was approximately 5.5 (=1/0.17, 1/0.18) for both Phases as estimated from the slopes of the regression equations. This range of ratios is inconsistent with those predicted for TMs acting as either a water ( ≈19, p<.01) or lipid ( ≈10, p<.01) barrier to diffusive gas exchange (12).
Figure 4.
Scatterplot of the O2 exchange rate measured in units of MS pressure at 32 AMU/min/mmHg versus the paired CO2 exchange rate measured in units of MS pressure at 44 AMU/min/mmHg for Phase 1 (solid squares) and Phase 2 (open circles) of each experiment.
DISCUSSION
In this report, an in vivo methodology for determining if the human TM is permeability to O2 and CO2 is presented and a mathematical model for quantifying transTM gas exchange is described. To accomplish this, an acrylic ECP custom-fitted to the EC of each tested TM was fabricated. The materials used in ECP construction were chosen to be impermeable to the physiological gases, a significant problem with previous probes constructed from materials such as plastics and rubber (15). The ECP was fitted with a glass capillary enclosing an oil meniscus to maintain ambient total pressure throughout the experimental period and to allow for measurement of ECP+EC volume change during sampling. Silica glass microtubing exposed to the enclosed ECP+EC volume and sealed within the ECP was connected “online” to a turbomolecular pump for withdrawal of ECP+EC gas samples that were analyzed for composition by a MS.
As configured, the gases of the ECP+EC volume can potentially communicate with three gas compartments; the ME airspace via transTM exchange, the subepithelial blood of the ECP enclosed EC via serial gas transfers through the different layers of the skin and the ambient environment via transfers through the capillary meniscus. These represent, independent parallel pathways with the rate of gas exchange for each pathway following the relationships described in Equation 1. When appropriately scaled to the characteristics of each pathway, Equation 1 shows that the transTM pathway controls the ECP-EC gas composition. For example, the predicted rate of gas exchange across the meniscus is significantly limited by the small cross-sectional area of the air-liquid interface, the large diffusion path (meniscus length) and the nonexistent (at the start of the experiment where sampling space equals atmospheric composition) to low (throughout the experiment) partial-pressure gradients to drive the exchange. However, the blood of the EC has O2 and CO2 partial-pressures similar to those of the ME and, thus, a similar driving gradient for gas exchange with the ECP+EC volume. Not measured is the surface area of the EC enclosed by the ECP but this is not expected to be much greater than that of the TM. Limiting gas transfers to or from that source is the much greater thickness of the exchange barrier represented as a thick subdermis and multilayered epidermis when compared to the thin, three-layered (epidermal, fibrous, mucosal) structure of the TM (See Equation 1).
Ruling out a contribution of transEC gas exchange and recognizing that gas transfers across the meniscus would re-establish ambient gas composition, the progressive increase in CO2 and decrease in O2 recorded over time for the ECP+EC volume is directionally consistent with the physiological transTM gradients and, thus, provides strong evidence for transTM exchange of those gases. This result is consistent with past reports for studies in animals where transTM inert and reactive gas exchange was demonstrated under well controlled experimental conditions (4, 8, 11, 12). Therefore, the null hypothesis of no transTM CO2 and O2 gas exchange is rejected.
Using the methods described earlier in this report, the study data were analyzed to estimate transTM CO2 conductance. Those calculations yielded an average value of 4.7×10⁻¹¹ mole/min/mmHg/TM for the Phase 1 period which is approximately equal to 1.13×10⁻² µl/min/mmHg/TM or, given the average TM surface area of 98.6 mm2, 1.15×10⁻⁴ µl/min/mmHg/mm2. This value is an order of magnitude greater than the value of 9.0 ×10⁻⁶ µl/min/mmHg/mm2 reported by Elner for the cadaveric TM in his experiments (9). However, it is interesting that the CO2 conductances calculated here for the human TM is quite similar to those measured for the monkey TM, 2.54×10⁻⁴ µl/min/mmHg/mm2 (8) and for the chinchilla TM, 1.00×10⁻⁴ µl/min/mmHg/mm2 (12).
For simple gas diffusion across a barrier, gas conductance depends on certain physiochemical properties of the barrier including the surface area available for exchange, the barrier thickness and the solubility and diffusivity of the gas in the barrier. Because solubility and diffusivity of many gases in water, lipid and other liquids are known, paired measurements of conductance for different gases across the same barrier can be used to determine if the bulk composition of the barrier is consistent with a given substance. Specifically, the mathematical descriptions discussed earlier show that the conductance ratio for two gases is equal to the ratio of the product of solubility and diffusivity for the two gases in the barrier. As measured in this experiment the CO2/O2 conductance ratio was estimated to be between 3 and 5.5 which excludes a bulk TM composition of water (ratio≈19), lipid (ratio≈10) or a mixed water-lipid. Previous studies of transTM gas exchange in animals that used other gas pairings similarly rejected a TM composition of either lipid or water (4, 8). One study using chinchillas reported a transTM CO2/O2 conductance ratio of 2.9 which is not different from that reported here for the human TM (12).
Finally, in a pilot study, the effect of a procedure designed to reduce intraTM blood flow on the estimate of transTM gas conductance was explored. The analysis focused on estimated transTM CO2 conductance and showed that the conductance was increased after topical application of epinephrine to the TM. While not measured, epinephrine is expected to decrease the blood perfusion of the TM. Because the subepidermal TM gas partial-pressures are predicted to lie between those of the ME and the arterial blood and it is these pressures that drive transTM gas exchange with the atmosphere, higher blood flows tend to drive intraTM partial-pressures toward those of the arterial blood while lower blood flows drive intraTM partial-pressures toward those of the ME. In calculating transTM CO2 conductance, the extant CO2 driving gradient was not estimated based on the unknown intraTM-ambient value but on the known ME-ambient value. Thus the conductance estimates are downwardly biased under conditions of high intraTM blood perfusion, but should become more accurate as blood perfusion is reduced. This bias in the gradient estimate can account for the difference in CO2 conductance measured before and after application of epinephrine. If this interpretation is correct, it suggests that the more accurate conductance estimate is provided by the measure made after application of epinephrine. This could explain the observed better fit of the regression of O2 on CO2 for Phase 2 of the experiment when compared to that of the regression for Phase 1. To demonstrate this effect conclusively, the experiment should be repeated using a cross-over design (active vs placebo application) with objective documentation of intraTM blood flow and gas pressure.
In summary, the results of these experiments show that the human TM is permeable to O2 and CO2 at physiological transTM gradients. The exchange rates of these gases are not consistent with the TM acting as a primary water or lipid barrier to exchange. Preliminary evidence suggests that intraTM blood perfusion is inversely related to the estimated transTM CO2 conductance. The described methodologies should be modified to allow for study of transTM inert gases exchange. When completely characterized for all physiological gases, the transTM gas conductances can be entered as parameters into a more general model of ME pressure-regulation and the role, if any, played by transTM gas exchange evaluated.
ACKNOWLEDGEMENTS
This study was supported in part by a grant from the National Institutes of Health (P50 DC007667) and the Hamburg Endowment to the Department of Pediatric Otolaryngology, University of Pittsburgh.
REFERENCES
- 1.Lildholdt T, Courtois J, Kortholm B, Schou JW, Warrer H. The correlation between negative middle ear pressure and the corresponding conductive hearing loss in children. A 12-month study of 352 unselected 7-year-old children. Scand Audiol. 1979;8(2):117–120. doi: 10.3109/01050397909076310. [DOI] [PubMed] [Google Scholar]
- 2.Merchant SN, Ravicz ME, Voss SE, Peake WT, Rosowski JJ. Toynbee Memorial Lecture 1997. Middle ear mechanics in normal, diseased and reconstructed ears. J Laryngol Otol. 1998;112(8):715–731. doi: 10.1017/s0022215100141568. [DOI] [PubMed] [Google Scholar]
- 3.Doyle WJ, Alper CM, Seroky JT. Trans-mucosal inert gas exchange constants for the monkey middle ear. Auris Nasus Larynx. 1999;26(1):5–12. doi: 10.1016/s0385-8146(98)00060-1. [DOI] [PubMed] [Google Scholar]
- 4.Ranade A, Lambertsen CJ, Noordergraaf A. Inert gas exchange in the middle ear. Acta Otolaryngol Suppl. 1980;371:1–23. [PubMed] [Google Scholar]
- 5.Doyle WJ. Middle ear pressure regulation. In: Rosowski JJ, Merchant SN, editors. The Function and Mechanics of Normal, Diseased amd Reconstructed Middle Ears. The Hague, Netherlands: Kugler Publications; 2000. pp. 3–21. [Google Scholar]
- 6.Piiper J. Various models for analysis of the absorption of inert gases from gas cavities in the body. Respir Physiol. 1970;9(1):74–85. doi: 10.1016/0034-5687(70)90008-3. [DOI] [PubMed] [Google Scholar]
- 7.Cantekin EI, Saez CA, Bluestone CD, Bern SA. Airflow through the eustachian tube. Ann Otol Rhinol Laryngol. 1979;88(5 Pt 1):603–612. doi: 10.1177/000348947908800504. [DOI] [PubMed] [Google Scholar]
- 8.Doyle WJ, Alper CM, Seroky JT, Karnavas WJ. Exchange rates of gases across the tympanic membrane in rhesus monkeys. Acta Otolaryngol. 1998;118(4):567–573. doi: 10.1080/00016489850154748. [DOI] [PubMed] [Google Scholar]
- 9.Elner A. Gas diffusion through the tympanic membrane. A model study in the diffusion chamber. Acta Otolaryngol. 1970;69(3):185–191. doi: 10.3109/00016487009123352. [DOI] [PubMed] [Google Scholar]
- 10.Riu R, Flottes L, Bouche J, Le Den R. La physioloie del la Trompe dþEustache. Paries: Librairie Arnette; 1966. [Google Scholar]
- 11.Dueker CW, Lambertsen CJ, Rosowski JJ, Saunders JC. Middle ear gas exchange in isobaric counterdiffusion. J Appl Physiol. 1979;47(6):1239–1244. doi: 10.1152/jappl.1979.47.6.1239. [DOI] [PubMed] [Google Scholar]
- 12.Felding UN, Banks JM, Doyle WJ. Gas diffusion across the tympanic membrane in chinchillas: effect of repeated perforations. Auris Nasus Larynx. 2004;31(4):353–359. doi: 10.1016/j.anl.2004.07.006. [DOI] [PubMed] [Google Scholar]
- 13.Felding JU, Rasmussen JB, Lildholdt T. Gas composition of the normal and the ventilated middle ear cavity. Scand J Clin Lab Invest Suppl. 1987;186:31–41. [PubMed] [Google Scholar]
- 14.Hergils L, Magnuson B. Human middle ear gas composition studied by mass spectrometry. Acta Otolaryngol. 1990;110(1–2):92–99. doi: 10.3109/00016489009122520. [DOI] [PubMed] [Google Scholar]
- 15.Kania RE, Herman P, Ar A, Tran Ba Huy P. Technical pitfalls in middle ear gas studies: errors introduced by the gas permeability of tubing and additional dead space. Acta Otolaryngol. 2005;125(5):529–533. doi: 10.1080/00016480510026205. [DOI] [PubMed] [Google Scholar]


