Abstract
The increasing prevalence of obesity suggests a need to develop a convenient, reliable, and economical tool for assessment of this condition. Three-dimensional (3-D) body surface imaging has emerged as an exciting technology for the estimation of body composition. We present a new 3-D body imaging system, which is designed for enhanced portability, affordability, and functionality. In this system, stereo vision technology is used to satisfy the requirement for a simple hardware setup and fast image acquisition. The portability of the system is created via a two-stand configuration, and the accuracy of body volume measurements is improved by customizing stereo matching and surface reconstruction algorithms that target specific problems in 3-D body imaging. Body measurement functions dedicated to body composition assessment also are developed. The overall performance of the system is evaluated in human subjects by comparison to other conventional anthropometric methods, as well as air displacement plethysmography, for body fat assessment.
Subject terms: three-dimensional surface imaging, stereo vision, body measurement, obesity
1 Introduction
The importance of human body composition research has increased due to the prevalence of obesity, a health disorder characterized by excess body fat. Obesity is a public health concern because of its associations with chronic diseases, including type 2 diabetes, hypertension, and coronary heart disease.1,2 The World Health Organization (WHO) classifies obesity in terms of body mass index (BMI), calculated by dividing body weight (in kilograms) by squared height (in square meters).1 However, BMI is only a crude conjecture of body fat, as it can be influenced by muscularity, age, gender, and ethnicity.2 More precise, noninvasive, inexpensive methods are needed to estimate the impact of the size and shape of the body on the distribution and degree of adiposity and the associated health risks.
A multiplicity of techniques have been developed for direct measurements of the amount and distribution of body fat. Previous technology, such as hydrodensitometry3 (underwater weighing) and air displacement plethysmography,4 focused on densitometry methods for determinations of body volume and estimations of overall density. These methods give a percent of body fat based on empirical predicting models.5,6 The significant time and subject burden of hydrodensitometry with subjects repeatedly being submerged in water limited its applicability to certain populations. Currently, volumetric measurements have been improved by air displacement technology such as the BodPod®. But its bulkiness and high expense have reserved its use to research and special facilities. A more rapid and inexpensive method to estimate body fat is bioelectrical impedance analysis,7 although this method is not recommended for research in persons with altered hydration states.8 Dual-energy x-ray absorptiometry9 (DXA), computed tomography10 (CT), and magnetic resonance imaging11 are more advanced and accurate techniques, but their significant expense and nonportability restricts their use to medical and research settings. Furthermore, the ionizing radiation of DXA would limit its continual use; the stronger radiation of CT is much more worrisome.
The escalation of worldwide obesity has intensified the demand for a convenient, safe, and relatively inexpensive device for the estimation of body size, shape and composition. Recent studies have shown that three-dimensional (3-D) body surface imaging is a potential alternative to assess body fat and to predict the risk of metabolic syndrome.12,13 This type of instrument, commonly called a body scanner, captures the surface geometry of the human body by utilizing digital techniques. Body scanning is a densitometry method for body fat assessment that provides noncontact, fast, and accurate body measurements. Anthropometric parameters computed by this system include waist and hip circumferences, sagittal abdominal diameter, segmental volumes, and body surface area. Therefore, body scanning provides more comprehensive measurements than traditional anthropometric tools.
Although body-scanning technologies have been evolving for the past several decades, the application of 3-D body measurement for body composition assessment is still at an early stage. The development of body scanning initially focused on custom clothing, character animation, and other applications.14,15 Currently, several body scanners are commercially available, but their high price and large size limit their practicality for field studies. In addition, because software systems capable of performing body composition assessment are rarely available, there is a need to promote 3-D body measurement for body composition research. Thus, the purpose of this study was to develop a portable, low-cost, 3-D body surface imaging system that would be readily accessible to body composition researchers and public health practitioners.
The majority of current body scanners are based on laser scanning, structured light, or stereo vision. In laser scanning, consecutive profiles are captured by sweeping a laser stripe across the surface.16 This system is more intricate and expensive than the other two types as it involves moving parts. Structured light utilizes a sequence of regular patterns to encode spatial information.17 It requires dedicated lighting and a dark environment, which makes the hardware relatively more complex than stereo vision. Stereo vision18 works similarly in concept to human binocular vision, and in principle, it is a passive method that it is not dependent on a light source. The major challenge in stereo vision is in disparity computation when the surface is without texture. Unfortunately, human skin is not rich in texture. Therefore, a projector to generate artificial texture on the scanned surface is usually required in a practical system. Data acquisition by stereo vision is very fast because one image from each camera can be captured simultaneously. In contrast, images must be captured sequentially in synchronization with pattern projections in structured light. In the case of whole body scanning, image acquisition by structured light can be further slowed down, because multiple sensing units in the system cannot work simultaneously; otherwise pattern projections from different units may interfere with each other. Rapid data acquisition is critical to the curtailment of artifacts caused by body movements because a slight body position movement may induce unacceptable inaccuracy in quantification of body volume. Therefore, the new system presented here is based on stereo vision.
2 System Setup
In a basic stereo vision system, two slightly separated cameras reconstruct the visible surface of an object. Since the two cameras observe the object from slightly different views, the captured left and right images are not exactly the same. The relative displacement of the object in the two images is called the disparity, which is used to calculate the depth. A prototype whole-body imaging system based on stereo vision was developed in this study. To reduce the cost and shorten the duration of development, off-the-shelf components such as cameras and projectors were utilized. The basic unit of the system is a stereo head that consists of a pair of cameras and a projector. The projector is used to shed artificial texture onto the body. Multiple stereo heads are required for full- body imaging. Our previous work on a rotary laser scanner indicates that full-body reconstruction can be made from two scanning units that are placed on the front and back sides of the subject, respectively.19 A similar construction was used in the study. However, two stereo heads are ncecessary to cover each side of the body, due to the limited field of view of the cameras and projectors. Therefore, there are a total of four stereo heads in the system, as illustrated in Fig. 1. The four stereo heads are mounted on two steady stands. Compared to some existing whole-body scanners, the unique setup of the system has greatly improved its affordability and portability.
Fig. 1.
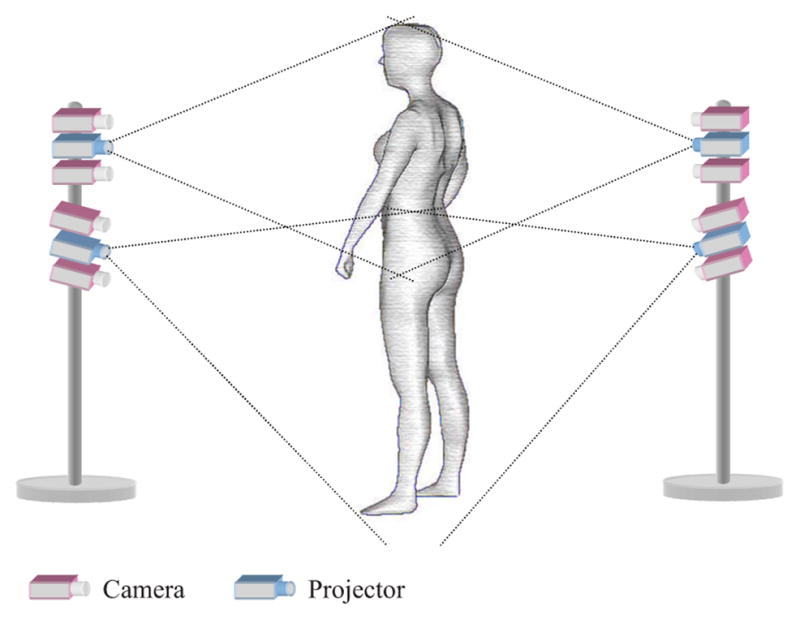
Schematic of the system setup.
More specifically, four pairs of monochromatic CMOS cameras (Videre Design, Menlo Park, California) with a resolution of 1280×960 were used. The focal length of the cameras was 12 mm and the baseline length was set as 90 mm. Four ultrashort throw NEC 575VT LCD projectors (NEC Corp., Tokyo, Japan) were used to create artificial texture on the subject. At a projection distance of 2.3 m, the image size was 1.5×1.15 m. Hence, when two such projectors are used together with a slight overlap for each side, the field of view can be as large as 1.5×2.0 m, a size that is large enough for the majority of the population. The distance between the stands can be reduced if we use projectors with an even smaller throw ratio, which is defined as the projection distance divided by the image size. The cameras communicated with a host computer via IEEE 1394 Firewire. A dual-port graphics card sent a texture pattern to the projectors through a VGA (video graphics array) hub.
3 Algorithms
The procedures of data processing in the system are illustrated in Fig. 2. The major components and associated algorithms are described as follows.
Fig. 2.
Data flow diagram of the system.
3.1 Image Acquisition
The cameras and projectors were synchronized by the host computer and a single random texture pattern was sent to the projectors. Then four pairs of images were captured simultaneously when the body was illuminated by the projectors. The entire image acquisition procedure was completed in 200 ms, and thus, the artifacts caused by involuntary body movements were drastically reduced. As an example, a stereo image pair captured by one of the stereo heads is shown in Fig. 3.
Fig. 3.
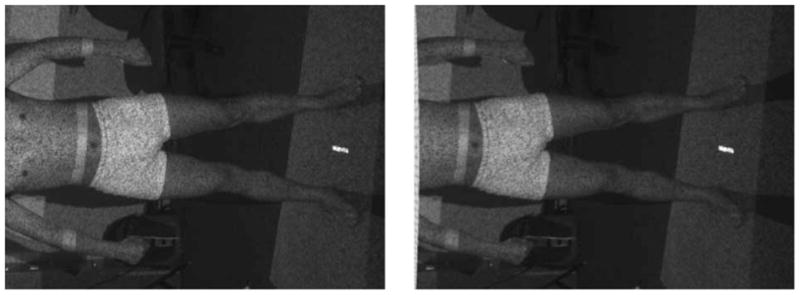
Example of a pair of stereo images.
3.2 System Calibration
The system was calibrated in two separate stages: camera calibration and 3-D registration. Camera calibration is a procedure of determining the intrinsic and extrinsic camera parameters. The intrinsic parameters correct the distortion induced in each individual camera by imperfect lens and lens displacement, and more specifically, include the effective horizontal and vertical focal lengths, the principal point describing the center offset of the lens, and the radial and tangential lens distortion coefficients. The extrinsic parameters describe the position and orientation of the each individual camera in a reference coordinate system, and can be represented by a rotation matrix and a translation vector. Based on the extrinsic parameters of the two cameras of a stereo head, their relative position and orientation was determined. The Small Vision System shipped with the cameras provided a toolbox of plane-based calibration routines, using the algorithm originally proposed by Zhang.20
The preceding camera calibration procedure was performed separately on each individual stereo head, and each stereo head had its own camera coordinate system. The goal of 3-D registration is to transform each camera coordinate system to a common world coordinate system so that 3-D data from each view can be merged to complete surface reconstruction. This transformation followed the rigid body model since it does not change the Euclidean distance between any points. To determine a rigid body transformation, three noncollinear points are sufficient. For this purpose, we designed a planar board target. There are six dots on each side of the board, and each stereo head requires only three of them. The world coordinates of the centers of the dots were manually measured. The images of the target were first rectified, and then the dots were identified and sorted. Next, the centers of the dots were estimated and the camera coordinates of each point can be calculated from its disparity.
Within the two stages, camera calibration is relatively complicated, but it is not necessary to repeat it frequently, since the relative position of two cameras in a stereo head can be readily fixed and intrinsic camera parameters can be stabilized using locking lenses. Therefore, only 3-D registration is required when the system is transported. This property contributes to the portability and also reduces maintenance cost.
3.3 Stereo Matching
Stereo matching21,22 solves the correspondence problem in stereo vision. For the stereo vision system developed in this study, a matching algorithm with subpixel accuracy was necessary to reach the quality of 3-D data demanded by body measurements. Additionally, because the system was designed to capture the front and rear sides of the body only, some portions of the body are invisible to the cameras. To deal with this issue, a surface reconstruction algorithm (described in the next subsection) was developed that is capable of filling in the gaps in 3-D data caused by occlusions. However, if the boundaries of the body in each view cannot be accurately located, it would be difficult to recover the surface from incomplete data. Therefore, in addition to high accuracy in matching, the algorithm should be able to accurately segment the body from the background. Thus, the matching algorithm must accurately recover the boundaries of foreground objects.
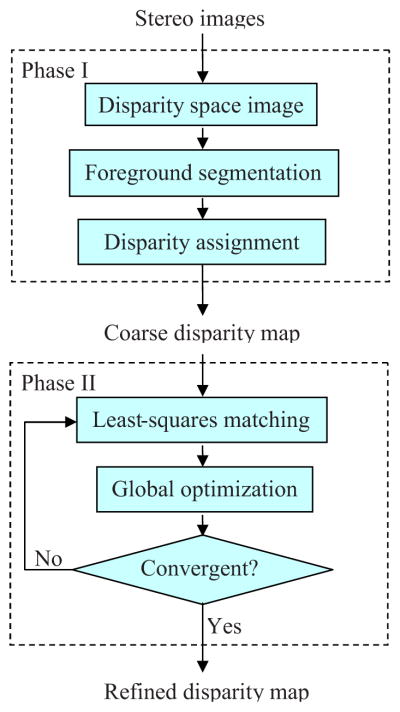
The stereo matching algorithm involves two major phases. In the first phase, foreground objects are accurately segmented from the background of the scene, and meanwhile, a disparity map with integer-pixel accuracy is computed. In the second phase, the disparity map is iteratively refined to reach subpixel accuracy. The flowchart of the algorithm is shown in Fig. 4 and is explained as follows.
Fig. 4.
Flowchart of the stereo matching algorithm.
3.3.1 Phase I
The first step is to compute a disparity space image (DSI), which is a matching cost function defined in the reference image and at each possible disparity.21 Let Il(x,y) and Ir(x,y) be the left and right intensity images, respectively. Taking the left image as the reference, a match is denoted as (x,y)l ↔ [x+d(x,y),y]r, where d(x,y) is the disparity map to be solved. Suppose the images have been rectified so that the disparity exists only in the horizontal scanline. In this paper, a match is measured by normalized cross-correlation (NCC), since it is less sensitive to photometric distortions by the normalization in the local mean and standard deviation.23 Accordingly, the matching cost can be defined by
| (1) |
where ρ(x,y,d) is the NCC coefficient. Since −1 ≤ ρ(x,y,d) ≤ 1, we have 0 ≤ C(x,y,d) ≤ 2. Here the trivariate function C(x,y,d) is called the DSI. For the sake of conciseness, we will also denote the DSI as Cp(d), with p being a pixel.
Then foreground segmentation is performed in the DSI. Let P denote the pixel set of the reference image. We define L={F,B} as a label set with F and B representing the foreground and background, respectively. Then the goal is to find a segmentation (or labeling) f(P) ↦ L that minimizes an energy function E(f), which usually consists of two terms,24
| (2) |
where N ⊂ P × P is the set of all neighboring pixel pairs; Dp (fp) is derived from the input images that measures the cost of assigning the fp to pixel p; and Vp,q (fp, fq) imposes the spatial coherence of the labeling between the neighboring pixels p and q.
To derive Dp(fp), we assume the disparity space can be divided into two subspaces: the foreground space and the background space that contain the object and the background, respectively. The interface between the two subspaces can be readily determined from the known geometrical configuration of the system, as described in Ref. 25. Denote the interface as d*(P). Now we define , and thus CF(P) and CB(P) represent the minimum surfaces in the foreground and background subspaces, respectively. If , we can expect that there is a good chance that pixel p belongs to the foreground. The same applies to and the background. Therefore, we can define Dp (fp) by
| (3) |
Since there are only two states in the label space L, the Potts model25 can be used to define the spatial coherence term in Eq. (2), i.e.,
| (4) |
In the 8-neighborhood system, we set βp,q = β0 if p and q are horizontal or vertical neighbors, and if they are diagonal neighbors.
As a binary segmentation problem, the global minimum of the energy function E(f) can be searched by using the graph-cuts method.26 Once the pixels are labeled, each pixel in the foreground is assigned a disparity to minimize the cost function, i.e.,
| (5) |
In practice, the obtained disparity map can be noisy, so median filtering is used to quench the impulse noise. Furthermore, morphological closed and open operators are used to smooth the contour.
3.3.2 Phase II
The disparity map from the first phase takes only discrete values, and it should be refined to achieve subpixel precision. The refinement process is iterative and involves two steps: local least-squares matching and global optimization. For the first step, the amount of update is estimated locally for each pixel. The estimation can be made by minimizing the matching cost function defined in Eq. (1). However, the process is difficult since the NCC function ρ is highly nonlinear. So instead, the sum of squared differences (SSD) is applied to define the matching cost as in the least-squares matching algorithm.27 If the SSD takes into account the gain and bias factors between cameras, it is essentially equivalent to NCC. Now the matching cost is defined as
| (6) |
where W(x,y) is a matching window around (x,y), and a and b are the gain and bias factors, respectively. Then the local estimate of the disparity d̃ is obtained by minimizing the preceding equation.
In the second step, the disparity map is optimized at a global level by minimizing the following energy function:
| (7) |
where dx and dy are the disparity gradients. The first term of the function measures the consistency with the local estimation, and the second term imposes smoothness constraints on the solution. Note that λ is called the regularization parameter, which weighs the smoothness term. This process follows the principles of regularization theory.28
The preceding two steps are repeated until a convergence is reached. The advantage of this method is that high accuracy can be reached by the least-squares matching. Meanwhile, stability is maintained and potential errors are corrected by the global optimization. More detailed description of the algorithm is available in. Ref. 25
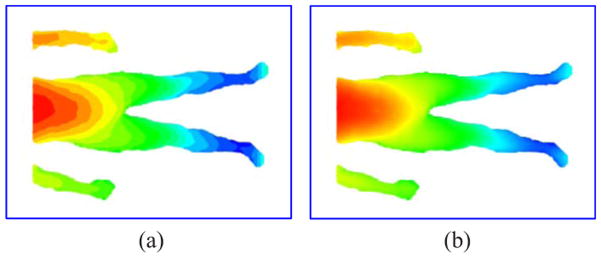
The results of stereo matching on the images of Fig. 3 are shown in Fig. 5. The disparities are coded with the standard cold-to-hot color mapping that corresponds to “far-to-close” to the cameras. The coarse and refined disparity maps are shown in Figs. 5(a) and 5(b), respectively. The results show that the algorithm is effective in both foreground segmentation and subpixel matching and is promising for our application.
Fig. 5.
Example of stereo matching: (a) foreground segmentation and coarse disparity map and (b) refined disparity map.
3.4 Surface Reconstruction
The raw data obtained from stereo matching are comprised of around 1 million scattered 3-D points, from which it is hard to read and handle the desired information directly. Surface reconstruction is a process that accurately fits the raw data with a more manageable surface representation. Thus, the data can be manipulated and interpreted more easily for some specific applications.
In developing a surface reconstruction algorithm, a proper surface representation must be selected initially. One of the most common representations is the B-spline surface representation due to its attractive properties such as piecewise smoothness, local support, and the same differentiability as found with the basis functions.29 But B-spline patches require cylindrical or quadrilateral topology, and intricate boundary conditions are necessary to zipper patch together to represent a more complex surface. In contrast, a piecewise smooth subdivision surface, resulting from iteratively refining a control mesh of arbitrary topology, gives a more flexible representation.30
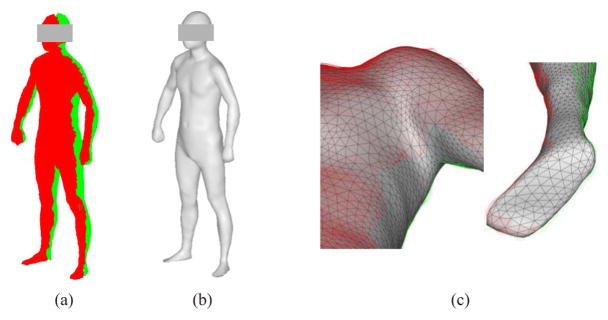
Since the system is made up of four stereo heads mounted on two stands that are placed in front and in back of the subject, the scan data can be grouped into two sets that correspond to the front and back views, respectively. For our system, a unique challenge is that there are large gaps in the data caused by occlusions. For example, the raw data of a human subject are shown in Fig. 6(a). The data set comprises of around 1.2 million scattered 3-D points. The objective of surface reconstruction is to create an accurate, smooth, complete, and compact 3-D surface model, which will be used in applications such as 3-D body measurement. A desirable reconstruction technique should produce a surface that is a good approximation to the original data, as well as be capable of filling the holes and gaps and smoothing out noise. In previous work,31 an effective body surface reconstruction algorithm was developed based on subdivision surface representation for a two-view laser scanning system. The algorithm can be applied to the stereo vision system with a slight modification. The basic idea of the method is described here. First, the original 3-D data points on a regular grid are resampled, and the explicit neighborhood information of these resampled data are utilized to create an initial dense mesh. Then the initial dense mesh is simplified to produce an estimate of the control mesh. Finally, the control mesh is optimized by fitting its subdivision surface to the original data, and accordingly, the body model is reconstructed.
Fig. 6.
Example of surface reconstruction: (a) original 3-D data points of a human subject, (b) reconstructed 3-D surface model, and (c) close-up views of gap filling for the armpit and foot.
In the example of Fig. 6, the reconstructed surface model is shown in Fig. 6(b). To demonstrate that the algorithm is capable of gap filling, some close-up views of the model are shown in Fig. 6(c). Note that the gap under the armpit has been completed and the holes at the sole have been filled. Although the original data are noisy, the reconstructed surface is smooth. The foot is one of the most difficult areas to be reconstructed due to the missing data and high noise, but the following result is acceptable.
3.5 Body Measurement
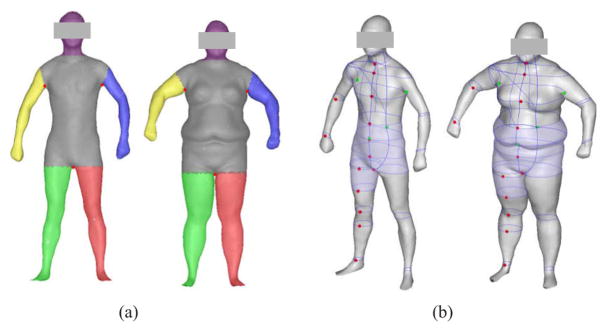
To create a 3-D body imaging system ready for practical use, automatic body measurement is indispensable. A body measurement system dedicated to body composition assessment was developed based on an earlier system that was designed for applications in apparel fitting.32 In this method, key landmarks were searched in some target zones that were predefined based on the proportions relative to the stature. The armpits and neck were searched, with the criterion of minimum inclination angle between neighboring triangles. The crotch was detected by observing the transition of cusps along successive horizontal contours. Once the key landmarks were located, the body was segmented into the torso, head, arms, and legs. Then various measures such as circumferences and lengths were extracted. The functions of 3-D measurement can be enhanced further by taking advantage of modern graphics hardware. Volume measurement was performed using a depth buffer of the graphics hardware. In modern computer graphics, the depth buffer, also called the z-buffer, records a depth value for each rendered pixel. With 3-D APIs such as OpenGL, (Ref. 33) the z-buffer was switched to keep track of the minimum or maximum depth (distance to the viewport) for each pixel on the screen. To measure the body volume, the 3-D body model was rendered twice in the anterior view using orthographic projection. During the two renderings, the z-buffer was set to record the minimum and maximum depth of each pixel, respectively. Then the two depth maps were read from the z-buffer corresponding to the front and back surfaces of the body, respectively. As a result, a thickness map of the body from the difference between the two depth maps was created. Finally, the body volume was calculated by integrating over the thickness map based on the known pixel scale.
In principle, the z-buffering method is equivalent to resampling the surface data on a regular grid, and thus the size of the viewport that determines the sampling interval may affect the measure accuracy. However, we found that a moderate size of the viewport such as 500×500 pixels is sufficient to reach high accuracy. This technique is extremely efficient in time cost, as compared to the slice-based methods.
To illustrate the output of the body measurement system, results on two human subjects are shown in Fig. 7. The measured parameters included circumferences and cross-sectional areas of a number of locations (such as the chest, waist, abdomen, hip, upper thigh, etc.), whole-body volume, segmental volumes (such as the abdomen-hip volume and the upper thigh volume), and body surface area.
Fig. 7.
Examples of body measurement on two human subjects: (a) body segmentation and (b) body measurement.
3.6 Obesity Assessment
The anthropometric measures extracted from a 3-D body model can be used to assess the overall amount and the distribution of body fat. For example, 3-D body measurement can be utilized to assess central obesity, which refers to excessive abdominal fat accumulation. From a 3-D body model, waist circumference and waist-hip ratio can be calculated easily. These two measures are widely accepted as strong indicators for assessing central obesity.34 A significant advantage of 3-D body measurement is that it is not limited to linear measures such as circumferences. In fact, this technology offers the possibility to derive new central obesity-associated health indexes from higher dimensional measures such as abdominal volume and waist cross-sectional area.
As previously mentioned, whole-body volume can be used to estimate percent body fat by using the two-component body model when body weight is also measured. If the body is assumed to be composed of fat and fat-free mass (FFM) and these densities are constant, then the percentage of body fat (%BF) can be calculated by
| (8) |
where Db is the body density (in kilograms per liter) calculated by dividing body weight by whole-body volume corrected for lung volume, A and B are derived from the assumed fat density (DF) and FFM density (DFFM), and DF is relatively stable and is set usually as 0.9 kg/L. But slightly different values of DFFM appear in the literature. A commonly used equation was proposed by Siri:6
| (9) |
where DFFM=1.1 kg/L is assumed.
4 Experimental Evaluation and Results
To evaluate the accuracy and repeatability of the prototype 3-D body imaging system, a test was first performed on a static object with known dimensions, and then human subjects were tested for the measurement of body volume and dimensions. To validate its feasibility in body fat assessment, the system was compared to air displacement plethysmography (ADP), which has been commonly used as a method of body composition analysis.
4.1 Test on a Plywood Box
A box made of plywood was used to test the performance of the system on circumference, cross-sectional area, and volume measurement. The dimension of the box is 505.0×505.0×915.0 mm; it was measured with a wood ruler. A 3-D model of the box and an arbitrarily selected cross section are shown in Fig. 8. From a top view of the cross section, as displayed in Fig. 8(b), we can observe that a near perfect square has been reconstructed. We repeated the test 10 times over a period of a week, and each time the location of a cross section was picked arbitrarily for measurement. The results are listed in Table 1. The coefficients of variance (CVs) are 0.16, 0.22, and 0.11% for the circumference, cross-sectional area, and volume measurements, respectively, which means the system is highly repeatable. The relative errors are 0.07, 0.34, and 0.51% for these three measurements. The accuracies are high, although errors increase with the number of dimensions.
Fig. 8.
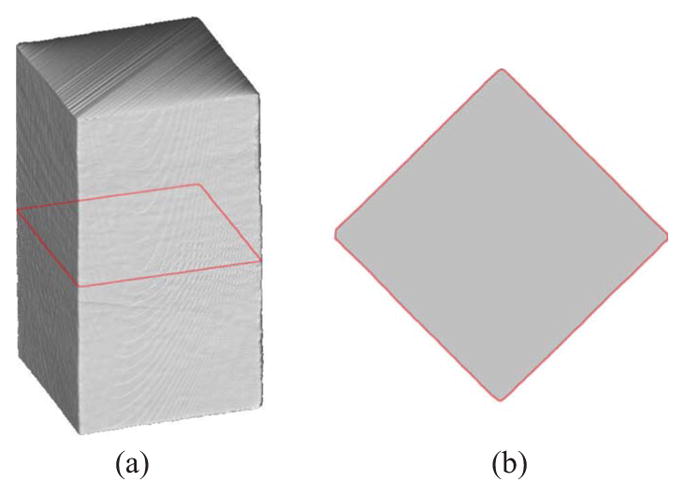
Test on a plywood box: (a) a reconstructed 3-D model and (b) a top view of the cross section marked in (a).
Table 1.
Results on a plywood box.
| 3-D |
||||||
|---|---|---|---|---|---|---|
| Manual | Mean | SD | CV3%3 | Error | %Error | |
| L (mm) | 2020 | 2018.5 | 3.3 | 0.16 | 1.5 | 0.07 |
| A (mm2) | 255,025 | 255,887.9 | 576.7 | 0.22 | 862.9 | 0.34 |
| V (L) | 233.348 | 234.542 | 0.269 | 0.11 | 1.194 | 0.51 |
Note: L is circumference of a cross section, A is cross-sectional area, V is volume, and SD is standard deviation.
4.2 Test on Human Subjects
4.2.1 Subjects and measurements
Twenty adult subjects (10 males and 10 females; 13 Caucasians and 7 Asians) were recruited in this research. The subjects were aged 24 to 51 yr, with weights of 47.9 to 169.5 kg, heights of 156.0 to 193.0 cm, and BMI values of 18.9 to 47.8 kg/m2. The study was approved by the Institutional Review Board of the University of Texas at Austin. An informed written consent was obtained from each subject at the visit.
The subjects wore tight-fitting underwear and a swim cap during the test. Height, weight, waist and hip circumferences, and waist breadth and depth were measured with conventional anthropometric methods. Height was measured to the nearest 0.1 cm via stadiometer (Perspective Enterprises, Portage, Michigan); weight was determined by a calibrated scale from the BodPod® (Life Measurement Inc., Concord, California). A MyoTape body tape measure (AccuFitness, LLC, Greenwood Village, Colorado) was used to measure circumferences, and an anthropometer (Lafayette Instrument Company, Lafayette, Indiana) was utilized to measure the depth and breadth of the waist. The waist was taken at the midpoint between the iliac crest and the lowest rib margin, and the hip was located at the level of the maximum posterior extension of the buttocks.35
The subjects were imaged with normal breathing by the 3-D body measurement system. During imaging, the subjects were asked to stand still in a specific posture with the legs slightly spread, the arms abducted from the torso, and the hands made into fists. The imaging was repeated 10 times for each subject. The subjects were repositioned between scans. The subjects also were assessed for body fat by ADP (BodPod®). The body volume obtained from the 3-D body imaging system should be corrected for thoracic gas volume (TGV), which equals functional residual capacity plus half of tidal volume. In this study, TGV took the value measured or predicted by the BodPod® for consistency. The subjects were instructed to fast at least 3 h, stay hydrated, and avoid excessive sweating, heavy exercise, and caffeine or alcohol use before all procedures were performed.
4.2.2 Statistical analysis
Repeatability was determined by computing the intraclass correlation coefficient (ICC) and the CV from the table of one-way random effects ANOVA (analysis of variance). The comparisons of measurement by different methods were performed using t tests and linear regression analysis.
Percent body fat was calculated from whole-body volume measured by 3-D body imaging and ADP using Siri’s formula [Eq. (9)]. Percent body fat estimates determined by ADP were compared to those obtained by the 3-D body imaging system using paired-sample t tests and linear regression. In addition, a Bland and Altman analysis36 was used to assess agreement of percent body fat across methods; a 95% agreement was estimated by the mean difference ±1.96 SD. For all analyses, statistical significance was P<0.05. The statistical calculations were performed using SPSS 16.0 (SPSS Inc., Chicago, Illinois).
4.2.3 Results
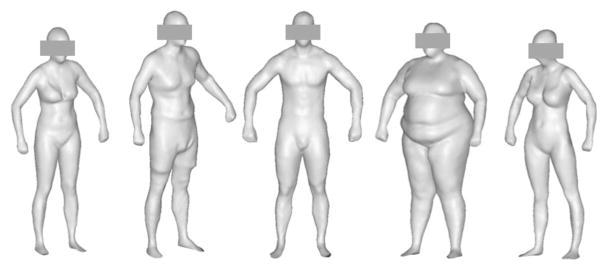
The overall age and anthropometric characteristics of the 20 human subjects are listed in Table 2. Eight subjects were of BMI ≥25.0 kg/m2, and four had of BMI ≥30.0 kg/m2. Sample reconstructed 3-D surface models of subjects with various sizes and shapes are shown in Fig. 9. The repeatability of the measurements is given in Table 3. All ICCs were >0.99, and all CVs were <1.0%, except for the measurement of waist depth. The highest precision was reached in body volume, partially due to the fact there was no ambiguity to calculate whole-body volume for a 3-D model. However, it was difficult to locate precisely the waist and hip, especially the waist in overweight subjects.
Table 2.
Characteristics of the human subjects (10 males and 10 females; 13 Caucasians and 7 Asians).
| Mean | SD | Range | |
|---|---|---|---|
| Age (yr) | 32.2 | 6.2 | 24–51 |
| Height (cm) | 171.7 | 8.4 | 156.0–193.0 |
| Weight (kg) | 79.5 | 31.3 | 47.9–169.5 |
| BMI (kg/m2) | 26.6 | 8.5 | 18.9–47.8 |
Fig. 9.
Examples of 3-D surface models of human subjects.
Table 3.
Repeatability tests of 3-D body imaging in 20 human subjects (10 males and 10 females).
| Mean | MSw | MSb | SDw | SDb | CV(%) | ICC | |
|---|---|---|---|---|---|---|---|
| Waist | |||||||
| Circumf. (mm) | 880.3 | 45.2 | 495886.7 | 6.7 | 222.7 | 0.76 | 0.9991 |
| Breadth (mm) | 305.4 | 9.0 | 40913.8 | 3.0 | 64.0 | 0.98 | 0.9978 |
| Depth (mm) | 237.4 | 19.9 | 53657.9 | 4.4 | 73.2 | 1.88 | 0.9963 |
| Hip circum. (mm) | 1065.4 | 32.8 | 313843.0 | 5.7 | 177.1 | 0.54 | 0.9990 |
| Volume (L) | 80.122 | 0.156 | 10523.455 | 0.394 | 32.440 | 0.49 | 0.9999 |
Note: MSw, within-subject mean squared error (MSE); MSb, between-subject MSE; SDw, within-subject SD; SDb, between-subject SD; CV, coefficient of variance; ICC, intraclass correlation coefficient.
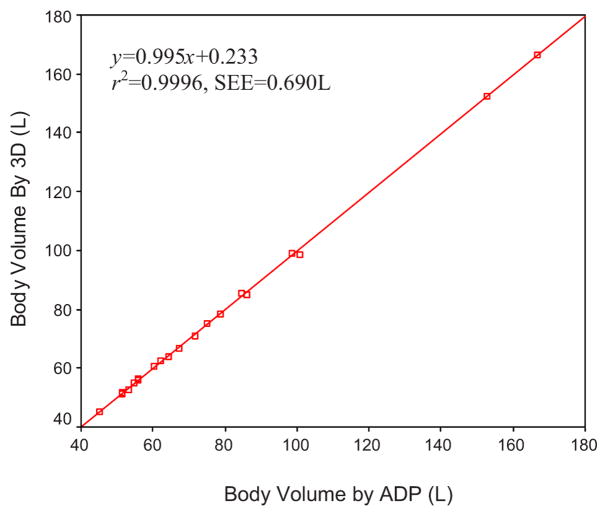
The accuracy of 3-D body imaging with reference to tape, anthropometer and ADP measurements is shown in Table 4. The 3-D imaging was significantly different from tape and anthropometer measures in hip circumference and waist depth, respectively. The differences were not significant for body volume, waist circumference, or breadth. The degrees of agreement also were characterized by linear regression analysis, as shown in Table 5. A relatively high correlation was observed between 3-D imaging and tape or anthropometer measure in body dimensions (r2>0.90), but the standard errors of the estimate (SEEs) were relatively high (20 to 30 mm). A very good agreement was reached in body volume when 3-D imaging was compared to ADP (r2=0.9996, SEE=0.690 L). The body volumes are plotted with the regression line in Fig. 10. The line for the regression equation did not differ significantly from the line of identity.
Table 4.
Comparison of dimensions and volume measured by 3-D body imaging (3-D) and tape, anthropometer, or ADP in 20 human subjects (10 males and 10 females).
| Tape, anthropometer, or ADP | 3-D | Difference | P | |
|---|---|---|---|---|
| Waist | ||||
| Circumf. (mm) | 884.3±217.6 | 880.2±222.5 | −4.1±29.4 | 0.543 |
| Breadth (mm) | 314.8±79.2 | 306.3±65.7 | −8.5±24.9 | 0.152 |
| Depth (mm) | 227.0±83.3 | 240.1±74.5 | 13.1±25.5 | 0.038 |
| Hip circumf. (mm) | 1051.2±180.4 | 1065.1±176.8 | 13.9±29.2 | 0.046 |
| Volume (L) | 76.834±32.445 | 76.669±32.284 | −0.165±0.692 | 0.300 |
Note: The P values were from paired-sample t tests.
Table 5.
Linear regression analysis on dimensions and volume measured by 3D body imaging, and tape, anthropometer or air displacement plethysmography in 20 human subjects (10 males and 10 females).
| a | b | r2 | SEE | |
|---|---|---|---|---|
| Waist | ||||
| Circum. (mm) | 1.014 | 16.351 | 0.9827 | 30.0 |
| Breadth (mm) | 0.795 | 55.954 | 0.9179 | 19.4 |
| Depth (mm) | 0.854 | 46.332 | 0.9097 | 23.0 |
| Hip circum. (mm) | 0.967 | 48.210 | 0.9739 | 29.3 |
| Volume (L) | 0.995 | 0.233 | 0.9996 | 0.690 |
Note: The prediction equations are expressed as y=ax+b. SEE is standard error of the estimate.
Fig. 10.
Linear regression of body volume measured by 3-D body imaging (3D) and ADP.
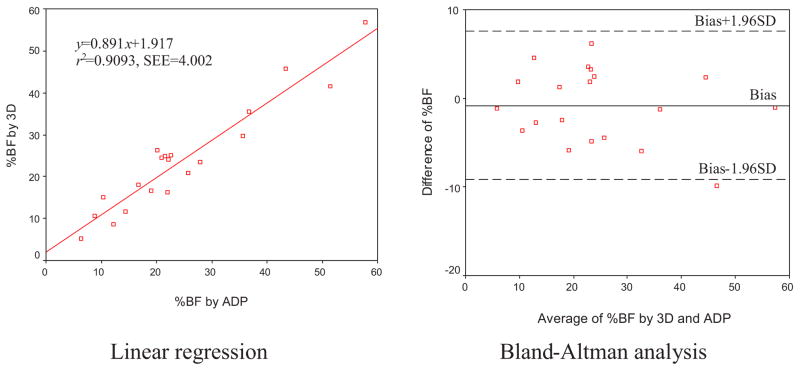
Equation (9) was used to predict body fat for both 3-D body imaging and ADP. Paired comparisons of the percent body fat (%BF) estimated by these two techniques were performed by linear regression and the Bland-Altman analysis (shown in Fig. 11). The prediction equation for the %BF by 3-D body imaging and ADP is y=0.891x+1.917, r2=0.9093, SEE=4.002. Along with the Bland-Altman plots in Fig. 11, the bias and SD of differences between the two methods are given in Table 6. When paired-sample t tests were performed, the methods did not differ significantly for measurements of %BF.
Fig. 11.
Linear regression and Bland-Altman plots of percent body fat (%BF) measured by 3-D body imaging (3D) and ADP.
Table 6.
Bland-Altman analysis of percent body fat measured by 3-D body imaging (3-D) and ADP.
| Bias | SD | Limits of Agreement | P | |
|---|---|---|---|---|
| 3-D-ADP | −0.789 | 4.178 | ±8.189 | 0.409 |
Note: Limits of agreement are defined as ±1.96 SD. The P values were from paired-sample t tests.
4.3 Discussion
The overall performance of the 3-D body imaging system was developed and then evaluated in human subjects. The measurements were found to be highly reproducible within persons. The relatively small differences between methods observed for circumferences, breadths, and depths were derived presumably from the lack of consistency in locating the landmarks. For example, the level of the waist is usually the narrowest part of the torso for individuals of normal weight. However, the location of the waist in the obese is not well defined. In manual measurements, the waist can be determined as midway between the iliac crest and the lowest rib margin.35 But this skeletal information is difficult to detect when performing measurement on a 3-D body model. The error in the waist depth measurement was larger than that observed in the waist breadth; perhaps, this was due to the fact that breathing had a greater effect on the depth. Therefore, in practical applications, cautions should be taken to maximize precision. For example, subsequent studies might examine the use of markers (i.e., a colored tape) to pinpoint landmarks. Also, subjects could hold their breath during scans.
The body volumes measured by 3-D body imaging and ADP were related strongly, suggesting that this method is effective for assessment of body fat. In estimates of body fat, 3-D body imaging and ADP had relatively close agreements. This finding is encouraging since ADP has been commonly used as a criterion method for body fat assessment. Nevertheless, the estimation of percent body fat is very sensitive to the accuracy of body volume measurement in the two-component body composition model. For example, Siri’s formula [Eq. (9)] yields
| (10) |
where W is the body weight in kilograms, and ΔV is the error of body volume measurement in liters. If it is assumed that W=60 kg, then an error of 0.5 L in ΔV would lead to an over 4% difference in %BF. A small error in body volume measurement can readily result from inaccuracy of lung volume estimate or a slight movement of the body during imaging. However, body volume is only one of a number of variables that can be measured from a 3-D body imaging system. Its combination with other standard variables may offer better predictions for the development of new equations to estimate percent body fat.
Note that for the development and validation of the system described in this paper raw images were taken by the eight-camera system and retained for analysis. For actual use, to ensure the privacy of the subjects, the images will be encoded by bit twiddling and automatically deleted when the computation is complete.
5 Conclusions
A portable, economical 3-D body imaging system for body composition assessment was presented. The goal was to develop an instrument that would have applications for use in clinical and field settings such as physician’s offices, mobile testing centers, athletic facilities, and health clubs. This new stereo vision technology offers the benefits of low cost, portability, and minimal setup with instantaneous data acquisition. The technique was created by implementing algorithms for system calibration, stereo matching, surface reconstruction, and body measurement. The accuracy and reliability of the system were investigated by multiple means to determine its feasibility for use in human subjects. The system was shown to be a valid method of body fat and anthropometric measurements. In addition, the repeatability of the apparatus was validated. Future studies should compare this new technology to other criterion methods such as DXA, hydrodensitometry, and laser 3-D imaging as well as collect data on larger and more diverse populations.
The potential of the applications of 3-D body imaging in public health is enormous. For example, it will be of great value if new indices for estimation of the distribution of body fat can be utilized for comparisons to biomarkers and subsequent predictions of health risks. This technology is also ideal for monitoring changes in body size and shape over time and exploring possible associations with related health conditions.
Acknowledgments
The research was sponsored by National Institute of Health (Grant No. R21 DK081206).
Biographies

Bugao Xu received his PhD degree in 1992 from the University of Maryland at College Park and in 1993 joined the University of Texas (UT). Where he is currently a full professor with the School of Human Ecology, the College of Natural Science. He is also on the graduate faculty in the Department of Biomedical Engineering and a research scientist with the Center for Transportation Research of UT Austin. His investigative work comprises multidisciplinary areas including textiles, biometrics, and transportation. He focuses on the development of high-speed imaging systems for fiber identification, human-body measurement, highway pavement inspection, and other applications. His research has been sponsored by the National Institutes of Health (NIH), the National Science Foundation (NSF), the U.S. Department of Agriculture (USDA), the Texas Higher Education Coordinating Board, the Texas Department of Transportation, the Texas Food and Fiber Commission, and by private companies.

Wurong Yu received his BS degree in biomedical engineering and his MS degree in pattern recognition and intelligent systems from Shanghai Jiaotong University, China, in 1996 and 1999, respectively. He also received another MS degree in biomedical engineering in 2003 from the University of Texas at Austin, where he is currently pursuing his PhD degree in biomedical engineering. His research interests include image processing, computer vision, and computer graphics.
Ming Yao received his BS degree in wireless communication engineering and his MS degree in pattern recognition and intelligent systems from Donghua University, Shanghai, China, in 2003 and 2006, respectively. He is currently a research fellow with the Department of Human Ecology, University of Texas at Austin, focusing on the design and development of digital imaging and photogrammatic survey systems.
M. Reese Pepper is a PhD candidate in the Department of Nutritional Sciences at The University of Texas at Austin.

Jeanne Freeland-Graves, PhD, RD, FACN, is the Bess Heflin Centennial Professor in the Department of Nutritional Sciences at The University of Texas at Austin. She is an expert in nutrition, obesity, trace elements and foods and is President of the International Society for Trace Element Research in Humans.
Contributor Information
Bugao Xu, Email: bxu@mail.utexas.edu, The University of Texas at Austin, School of Human Ecology, 1 University Station, GEA 117/A2700, Austin, Texas 78712.
Wurong Yu, The University of Texas at Austin, School of Human Ecology, 1 University Station, GEA 117/A2700, Austin, Texas 78712.
Ming Yao, The University of Texas at Austin, School of Human Ecology, 1 University Station, GEA 117/A2700, Austin, Texas 78712.
M. Reese Pepper, The University of Texas at Austin, Department of Nutritional Sciences, 1 University Station, GEA 117/A2700, Austin, Texas 78712.
Jeanne H. Freeland-Graves, The University of Texas at Austin, Department of Nutritional Sciences, 1 University Station, GEA 117/A2700, Austin, Texas 78712
References
- 1.WHO. Obesity: Preventing and Managing the Global Epidemic: Report of a WHO Consultation on Obesity. Geneva: World Health Organization; 1997. [PubMed] [Google Scholar]
- 2.NIH. Clinical guidelines on the identification, evaluation, and treatment of overweight and obesity in adults—the evidence report. Obes Res. 1998;6(Suppl 2):51S–209S. [PubMed] [Google Scholar]
- 3.Behnke AR, Feen BG, Welham WC. The specific gravity of healthy men. J Am Med Assoc. 1942;118:495–498. doi: 10.1002/j.1550-8528.1995.tb00152.x. [DOI] [PubMed] [Google Scholar]
- 4.Dempster P, Aitkens S. A new air displacement method for the determination of human body composition. Med Sci Sports Exercise. 1995;27(12):1692–1697. [PubMed] [Google Scholar]
- 5.Brozek J, Grande F, Anderson JT, Keys A. Densitometric analysis of body composition: revision of some quantitative assumptions. Ann NY Acad Sci. 1963;110:113–140. doi: 10.1111/j.1749-6632.1963.tb17079.x. [DOI] [PubMed] [Google Scholar]
- 6.Siri WE. Body composition from fluid spaces and density: analysis of methods. In: Brozek J, Henschel A, editors. Techniques for Measuring Body Composition. National Academy of Sciences; Washington, DC: 1961. pp. 223–244. [Google Scholar]
- 7.Thomasett A. Bio-electrical properties of tissue. Impedance measurements in clinical medicine. Lyon Med. 1962;94:107–118. [PubMed] [Google Scholar]
- 8.Kyle UG, Bosaeus I, De Lorenzo AD, Deurenberg P, Elia M, Gomez JM, Heitmann BL, Kent-Smith L, Melchior JC, Pirlich M, Scharfetter H, Schols AMWJ, Pichard C. Bioelectrical impedance analysis-part II: utilization in clinical practice. Clin Nutr. 2004;23(6):1430–1453. doi: 10.1016/j.clnu.2004.09.012. [DOI] [PubMed] [Google Scholar]
- 9.Mazess RB, Barden HS, Bisek JP, Hanson J. Dual-energy x-ray absorptiometry for total-body and regional bone-mineral and soft-tissue composition. Am J Clin Nutr. 1990;51(6):1106–1112. doi: 10.1093/ajcn/51.6.1106. [DOI] [PubMed] [Google Scholar]
- 10.Sjostrom L. A computer-tomography based multicompartment body composition technique and anthropometric predictions of lean body mass, total and subcutaneous adipose tissue. Int J Obes. 1991;15(2):19–30. [PubMed] [Google Scholar]
- 11.Ross R, Leger L, Morris D, de Guise J, Guardo R. Quantification of adipose tissue by MRI: relationship with anthropometric variables. J Appl Physiol. 1992;72(2):787–795. doi: 10.1152/jappl.1992.72.2.787. [DOI] [PubMed] [Google Scholar]
- 12.Wang J, Gallagher D, Thomton JC, Yu W, Horlick M, Pi-Sunyer FX. Validation of a 3-dimensional photonic scanner for the measurement of body volumes, dimensions, and percentage body fat. Am J Clin Nutr. 2006;83(4):809–816. doi: 10.1093/ajcn/83.4.809. [DOI] [PMC free article] [PubMed] [Google Scholar]
- 13.Wells JCK, Ruto A, Treleaven P. Whole-body three-dimensional photonic scanning: a new technique for obesity research and clinical practice. Int J Obes. 2008;32:232–238. doi: 10.1038/sj.ijo.0803727. [DOI] [PubMed] [Google Scholar]
- 14.Istook CL, Hwang SJ. 3D body scanning systems with application to the apparel industry. J Fashion Market Manage. 2001;5(2):120–132. [Google Scholar]
- 15.Thalmann D, Shen J, Chauvineau E. Fast realistic human body deformations for animation and VR applications. Proc. 1996 Conf. on Computer Graphics Int.; New York: IEEE Computer Society; 1996. pp. 166–174. [Google Scholar]
- 16.Besl P. Advances in Machine Vision. Springer-Verlag; New York: 1989. Active optical range imaging sensors; pp. 1–63. [Google Scholar]
- 17.Batlle J, Mouaddib E, Salvi J. Recent progress in coded structured light as a technique to solve the correspondence problem: a survey. Pattern Recogn. 1998;31(7):963–982. [Google Scholar]
- 18.Forsyth DA, Ponce J. Computer Vision: A Modern Approach. Prentice Hall; Englewood Cliffs, NJ: 2003. [Google Scholar]
- 19.Xu B, Huang Y. Three-dimensional technology for apparel mass customization, Part II: body scanning with rotary laser stripes. J Text Inst. 2003;94(1 Part 1):72–80. [Google Scholar]
- 20.Zhang Z. A flexible new technique for camera calibration. IEEE Trans Pattern Anal Mach Intell. 2000;22(11):1330–1334. [Google Scholar]
- 21.Scharstein D, Szeliski R. A taxonomy and evaluation of dense two-frame stereo correspondence algorithms. Int J Comput Vis. 2002;47(1):7–42. [Google Scholar]
- 22.Brown MZ, Burschka D, Hager GD. Advances in computational stereo. IEEE Trans Pattern Anal Mach Intell. 2003;25(8):993–1008. [Google Scholar]
- 23.Sun C. Fast stereo matching using rectangular subregioning and 3D maximum-surface techniques. Int J Comput Vis. 2002;47(1):99–117. [Google Scholar]
- 24.Boykov Y, Veksler O, Zabih R. Fast approximate energy minimization via graph cuts. IEEE Trans Pattern Anal Mach Intell. 2001;23(11):1222–1239. [Google Scholar]
- 25.Yu W, Xu B. A portable stereo vision system for whole body surface imaging. Image Vis Comput. doi: 10.1016/j.imavis.2009.09.015. (in press) [DOI] [PMC free article] [PubMed] [Google Scholar]
- 26.Kolmogorov V, Zabih R. Computing visual correspondence with occlusions using graph cuts. Proc. IEEE Int. Conf. on Computer Vision; New York: IEEE Computer Society; 1981. pp. 508–515. [Google Scholar]
- 27.Lucas BD, Kanade T. An iterative image registration technique with an application to stereo vision. Proc. DARPA Image Understanding Workshop; Washington, DC. 2001. pp. 121–130. [Google Scholar]
- 28.Poggio T, Torre V, Koch C. Computational vision and regularization theory. Nature (London) 1985;317(6035):314–319. doi: 10.1038/317314a0. [DOI] [PubMed] [Google Scholar]
- 29.Piegl L. On NURBS: a survey. IEEE Comput Graphics Appl. 1991;11(1):55–71. [Google Scholar]
- 30.Warren J, Weimer H. Subdivision Methods for Geometric Design: A Constructive Approach. Morgan Kaufmann; San Francisco: 2001. [Google Scholar]
- 31.Yu W, Xu B. Surface reconstruction from two-view body scanner data. Text Res J. 2008;78(5):457–466. [Google Scholar]
- 32.Zhong Y, Xu B. Automatic segmenting and measurement on scanned human body. Int J Clothing Sci Technol. 2006;18(1):19–30. [Google Scholar]
- 33.Shreiner D, Woo M, Neider J, Davis T. OpenGL Programming Guide, Version 2.1. Addison-Wesley; Reading, MA: 2007. [Google Scholar]
- 34.Bjorntorp P. Centralization of body fat. In: Bjorntorp P, editor. International Textbook of Obesity. Wiley; New York: 2001. pp. 213–224. [Google Scholar]
- 35.Han TS, Lean MEJ. Anthropometric indices of obesity and regional distribution of fat depots. In: Bjorntorp P, editor. International Textbook of Obesity. Wiley; New York: 2001. pp. 51–65. [Google Scholar]
- 36.Bland JM, Altman DG. Statistical methods for assessing agreement between two methods of clinical measurement. Lancet. 1986;1(8476):307–310. [PubMed] [Google Scholar]


