Abstract
Near-infrared (NIR) fluorophores have several advantages over visible fluorophores including improved tissue penetration and lower autofluorescence but only indocyanine Green (ICG) is clinically approved. Its use in molecular imaging probes is limited because it loses its fluorescence after protein binding. This property can be harnessed to create an activatable, NIR probe. After cell binding and internalization, ICG dissociates from the targeting antibody thus, activating fluorescence. ICG was conjugated to the antibodies Daclizumab (Dac), trastuzumab (Tra) or panitumumab (Pan). The conjugates had almost no fluorescence in PBS but became fluorescent after SDS and 2-ME, with a quenching capacity of 10-fold for 1:1 conjugates, and 40 to 50-fold for 1:5 conjugates. In vitro microscopy demonstrated activation within the endo-lysosomes in target cells. In vivo imaging in mice demonstrated that CD-25-expressing tumors were specifically visualized with Dac-ICG. Furthermore, tumors overexpressing HER1 and HER2 were successfully characterized in vivo using, Pan-ICG(1:5) and Tra-ICG(1:5), respectively. Thus, we have developed an activatable NIR optical probe which “switches on” only in target cells. Because both the antibody and the fluorophore, are FDA-approved, the likelihood of clinical translation is improved.
Keywords: molecular imaging, activatable, cancer, ICG, humanized antibody
Introduction
Molecular imaging probes which employ Near-infrared (NIR, emission spectra ~700-850nm) fluorophores offer several advantages over visible fluorophores. NIR probes have better tissue penetration, less auto-fluorescence and large Stokes shifts allowing better rejection of excitation light (1,2). Only Indocyanine Green (ICG), which has absorption at ~780nm and emission at ~820nm, has been approved by the FDA and in clinical use for over 30 years with an excellent safety record (3,4). Unfortunately, the conjugation chemistry of ICG is difficult because of its amphophillicity and few functional groups. While protein binding is possible, once bound to protein, ICG dramatically loses its fluorescence. That feature has dissuaded investigators from using ICG in molecular imaging probes. However, this property can be harnessed to create activatable NIR optical probes.
Activation of optical probes can achieved using mechanisms including photon-induced electron transfer (PeT) (5,6), self-quenching (homo-FRET) (7) and quencher-fluorophore interaction (hetero-FRET). Activation leads to high tumor-to-background ratios (TBR) because unbound agents yield little signal. Once ICG conjugated with proteins, fluorescence is markedly decreased (8-10). However, upon catabolism light is once again emitted.
A probe that targets cells and internalizes, could lead to high TBR if the probe activates upon internalization. By combining ICG with FDA-approved monoclonal antibodies (MoAb) directed at cell-surface markers overexpressed on cancers (anti-CD25, anti-EGFR1 and anti-HER2), we demonstrate the feasibility of using ICG-MoAb conjugates as activatable in vivo molecular imaging probes. The possibilities of clinical translation are greatly enhanced because both components of this probe, the targeting moiety and the fluorophore, are already FDA-approved.
Materials and Methods
Reagents
ICG-sulfo-OSu was purchased from Dojindo Molecular Technologies (Gaithersburg, MD). The following MoAbs were used: Daclizumab, humanized MoAb to the IL-2Rα (CD25) (Hoffmann-La Roche Inc. Nutley, NJ), Panitumumab, human anti-HER1 IgG2 MoAb, (AMGEN Inc. Thousand Oaks, CA), Trastuzumab, humanized anti-HER-2 MoAb (Genentech Inc. South San Francisco, CA), and human polyclonal IgG, a control antibody (Sigma Chemical St. Louis, MO). ZsGreen plasmid was purchased from Clontech Laboratories, Inc. (Mountain View, CA). All other chemicals used were of reagent grade.
Synthesis of ICG conjugated antibodies
Daclizumab (1mg, 6.8nmol) was incubated with ICG-sulfo-OSu (6.8nmol or 68nmol) in 0.1M Na2HPO4 (pH 8.5) at room temperature for 30 min. The mixture was purified with a Sephadex G50 column (PD-10; GE Healthcare, Piscataway, NJ). The protein concentration was determined with CoomassiePlus protein assay kit (Pierce Biotechnology, Rockford, IL). The concentration of ICG was measured by absorption with the UV-Vis system to confirm numbers of fluorophore molecules conjugated to each trastuzumab molecule. The absorption was also measured in 5%SDS and 2-mercapto ethanol (2-ME) which were added to diminish hydrophobic interaction among ICG molecules and between ICG and the antibody. For HER1 or HER2 targeting studies, panitumumab or trastuzumab were respectively conjugated with ICG in the same manner as daclizumab. The number of ICG per antibody was 4-5 for 1:10 reaction condition and 1 for 1:1 reaction conditions. Consequently, Dac-ICG(1:5), Pan-ICG(1:5) and Tra-ICG(1:5) were prepared under 1:5 antibody:ICG conditions, and Dac-ICG(1:1) and Tra-ICG(1:1) were prepared under 1:1 antibody:ICG conditions. Control human polyclonal IgG-Cy5.5 was synthesized in the similar manner as above using Cy5.5-NHS ester (GE Healthcare). The number of Cy5.5 per antibody was adjusted to 1.
Determination of quenching ability in vitro
For investigation of the quenching ability of bound ICG, all conjugates were treated with 5% SDS and 2-ME to diminish hydrophobic π-π interactions and separate IgG chains. The change in fluorescence intensity for each conjugate was investigated with an in vivo imaging system (Maestro™, CRi Inc., Woburn, MA) using 710 to 760nm excitation and 800nm long-pass emission filters.
Cell culture
For IL-2Rα targeting studies, IL-2Rα+ ATAC4 cell was used. As a negative control, red fluorescent protein-transfected IL-2Rα– A431 cell (A431/DsRed) was employed. For HER1 and HER2 targeting studies, HER1-positive A431 and MDA-MB468 cells and HER2 gene-transfected NIH3T3 (3T3/HER2+) cell were used. Cell lines were grown in RPMI1640 (Life Technologies, Gaithersburg, MD) containing 10% fetal bovine serum (Life Technologies), 0.03% L-glutamine, 100units/mL penicillin, and 100μg/mL streptomycin in 5%CO2 at 37°C.
Fluorescence microscopy studies
3T3/HER2+ (1 × 10⁴) were plated on a cover glass–bottomed culture well and incubated for 16 h. Then Tra-ICG(1:1) or Tra-ICG(1:5) was added to the medium (30μg/mL), and the cells were incubated for either 1 or 8 hr. Cells were washed once with PBS, and fluorescence microscopy was performed using an Olympus BX61 microscope (Olympus America, Inc., Melville, NY) equipped with the following filters: excitation wavelength 672.5 to 747.5nm, emission wavelength 765 to 855nm. Transmitted light differential interference contrast images were also acquired.
Animal Tumor model
All procedures were carried out in compliance with the Guide for the Care and Use of Laboratory Animal Resources (1996), National Research Council, and approved by the NIH Animal Care and Use Committee. For IL-2Rα targeting studies, ATAC4 cells (IL-2Rα+, 2x10⁶ cells) and A431/DsRed cells (IL-2Rα-, 2×10⁶ cells) were injected subcutaneously in the left and right dorsum of the mice, respectively. The experiments were performed 14 - 18 days after cell injection.
For HER1 and HER2 targeting studies, MDA-MB468 (HER1+, HER2-, 2×10⁶ cells), A431 (HER1+, HER2-, 2×10⁶ cells) and 3T3/HER2+ (HER1-, HER2+, 2×10⁶ cells) were injected subcutaneously into the left flank, right buttock and right flank, respectively.
In vivo CD-25 targeted imaging studies
Dac-ICG(1:1) or Dac-ICG(1:5) (50μg) was injected via the tail vein into ATAC4 and A431/DsRed tumor bearing mice. The mice were anesthetized with intraperitoneally administered 10% sodium pentobarbital with 0.1% scopolamine butyl bromide, then spectral fluorescence images were obtained with the Maestro™ (CRi) using two filter sets before and 1, 2, 3 and 4 days after injection. Two filter sets (Green: excitation; 505 to 545 nm, emission; long-pass over 563 nm and NIR: excitation; 710 to 760 nm, emission; long-pass >700 nm) were used to detect DsRed and ICG fluorescence. The spectral fluorescence images consisting of ICG, DsRed, and autofluorescence spectra were then unmixed based on their spectral patterns using commercial software (Maestro software, CRi). The regions of interest were placed on ICG spectrum images with reference to the white light and DsRed spectrum images to measure fluorescence intensities of ATAC4 and A431/DsRed tumors and body (background). After imaging at day 4, mice were sacrificed with carbon dioxide. Then ex vivo imaging of the resected tumors was performed. Dissected lesions were embedded and stained with Hematoxylin and Eosin (H&E).
In vivo tumor characterization study with HER1+ and HER2+ tumors bearing mice
Three tumors, two HER1+HER2- (MDA-MB468 and A431) and one HER2+HER1-(3T3/HER2+), bearing mice were used. Pan-ICG(1:5) or Tra-ICG(1:5) (50 μg) was injected via tail vein and images were obtained 4 days after injection using the Maestro™ (CRi) with the ICG filter set . Histologic examination was performed with H&E staining.
In vivo 2-color imaging with Pan-ICG or Tra-ICG compared with co-injected polyclonal human IgG-Cy5.5 to validate specificity of accumulation
To validate the specific accumulation of Pan-ICG or Tra-ICG, control polyclonal human IgG-Cy5.5 was co-injected (50μg, i.v.) with either Pan-ICG(1:5) or Tra-ICG(1:5) (50μg, i.v.). In vivo and ex vivo spectral fluorescence images were obtained 4 days after injection into HER1+ and HER2+ tumors bearing mice described above using Maestro™. Two filter sets (Red: excitation; 615 to 665 nm, emission; long-pass >700 nm and NIR: excitation; 710 to 760 nm, emission; long-pass >800 nm) separated Cy5.5 and ICG fluorescence. The fluorescence images consisting of spectra from ICG, Cy5.5, and autofluorescence were then unmixed with commercial software (Maestro software ver. 2.4, CRi) using the multi-excitation spectral analysis function. The dissected tumors were embedded in paraffin and stained with H&E.
Results
Antibody-fluorophore conjugates demonstrate high quenching capacity
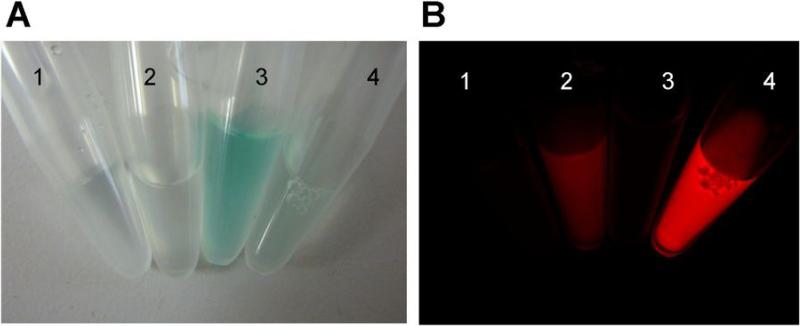
The molecular interaction of ICG and MoAb can be dissociated and disrupted with SDS and 2-ME treatments. Fluorescence intensity was low for all antibody-fluorophore conjugates before 5%SDS and 2-ME treatments; intense fluorescence was detected after dissociation (Fig. 1). The quenching capacities were 43, 6, 58, 44, and 10 for Dac-ICG(1:5), Dac-ICG(1:1), Pan-ICG(1:5), Tra-ICG(1:5), Tra-ICG(1:1), respectively.
Figure 1.
The bright field (A) and fluorescence (B) images of antibody-ICG conjugates. 1, 2: Zen-ICG(1:1), 3, 4: Zen-ICG(1:1). 1, 3: in PBS, 2, 4: SDS and 2-ME added condition. In PBS, all the conjugates have no fluorescence. The fluorescence was activated by SDS and 2-ME treatment.
In vitro microscopic studies demonstrate fluorescence activation only within target HER2+ cells
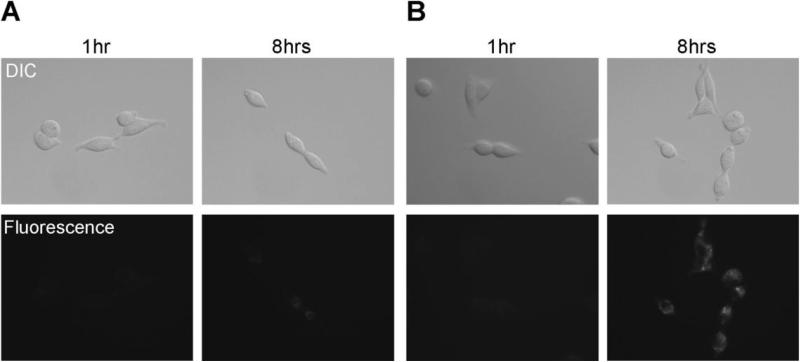
Fluorescence was not observed for either Tra-ICG(1:1) or Tra-ICG(1:5) inside the HER2+ cells after 1hr incubation, however by 8hr, both conjugates showed fluorescence, which were brighter for Tra-ICG(1:5) than Tra-ICG(1:1) (Fig. 2). These results show that fluorescence activation occurs only after internalization within target cells, and minimal fluorescence is found outside the cell.
Figure 2.
Fluorescence microscopy. 3T3/HER2+ cells were incubated with Tra-ICG(1:1) (A) or Tra-ICG(1:5) (B) for 1hr or 8hr. The fluorescent signal on the cell surface was not observed after 1hr incubation. The fluorescent signal was detected after internalization into the cells by 8hr incubation. The signal was higher for Tra-ICG(1:5) than Tra-ICG(1:1).
In vivo studies: Target tumor was specifically visualized with ICG-conjugated daclizumab with high tumor-to-background ratio
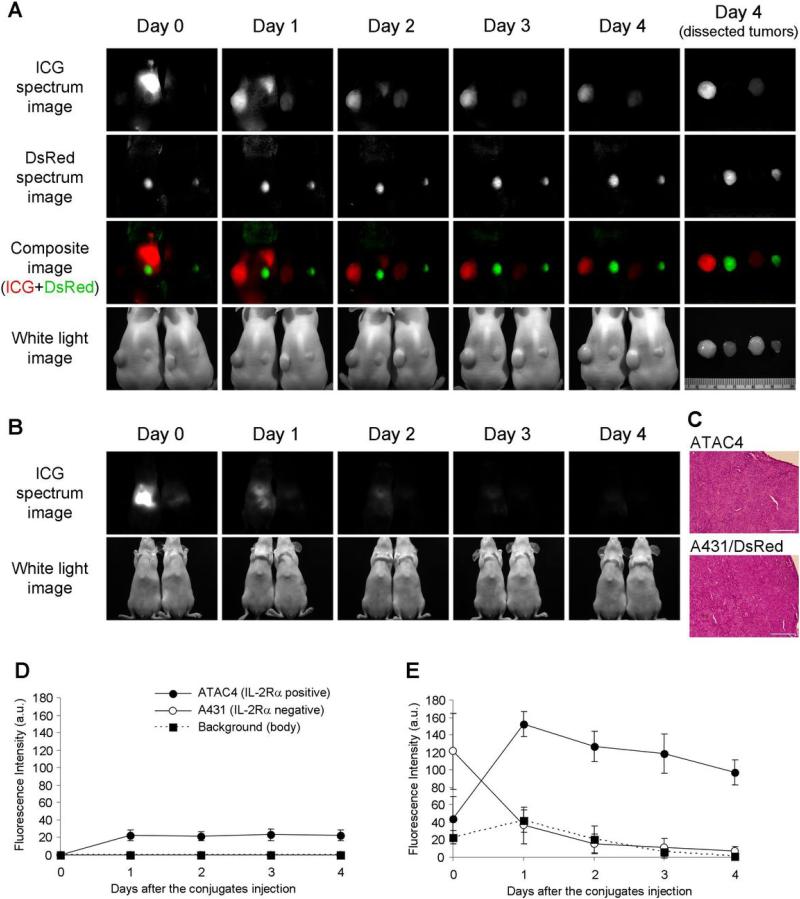
The time-course fluorescence intensity in ATAC4 (IL2-Rα+) and A431/DsRed (IL2-Rα-) tumors after Dac-ICG(1:5) or Dac-ICG(1:1) is summarized in Fig. 3. The fluorescence increased only in target ATAC4 tumors, and was higher for Dac-ICG(1:5) than Dac-ICG(1:1). The background and non-target tumor fluorescence was low for both Dac-ICG(1:1) and Dac-ICG(1:5), while control human polyclonal IgG-Cy5.5 conjugate yielded similar fluorescence in both tumors (Supplemental figure 1). Histological findings of both genetically-modified A431 tumors were identical (Fig. 3C). The liver uptake was higher for Dac-ICG(1:5) (Fig. 3B). This high liver uptake affected the measured fluorescence intensity in A431/DsRed tumors just after Dac-ICG(1:5) injection (day 0), because tumors located near the liver. To check the cause of slight fluorescence from the body for Dac-ICG(1:5), blood fluorescence was measured 1day after injection. However, ICG signal was not detected in blood samples (Supplemental figure 2).
Figure 3.
In vivo and ex vivo spectral fluorescence images with ATAC4 (left dorsum) and A431/DsRed (right dorsum) tumor bearing mice (A, B). A: dorsal images, B: ventral images. Dac-ICG(1:5) injected mouse is on the left side and Dac-ICG(1:1) injected mouse is on the right side. The target tumor (ATAC4) was visualized by both conjugates, but the brightness was higher for Dac-ICG(1:5). The non-target tumor (A431/DsRed) was not detected by either conjugate. C: H&E staining of dissected tumors (bar = 200 μm). Histologic findings of both tumors were identical. High initial liver uptake was observed for Dac-ICG(1:5), but the clearance was rapid. The time course of ICG fluorescence intensities after intravenous injection of Dac-ICG(1:1) (D) or Dac-ICG(1:5) (E). The fluorescence intensity was increased only in the target tumor (ATAC4).
Tumors over-expressing cell surface receptors were successfully characterized in vivo using their respective ICG-conjugated antibodies
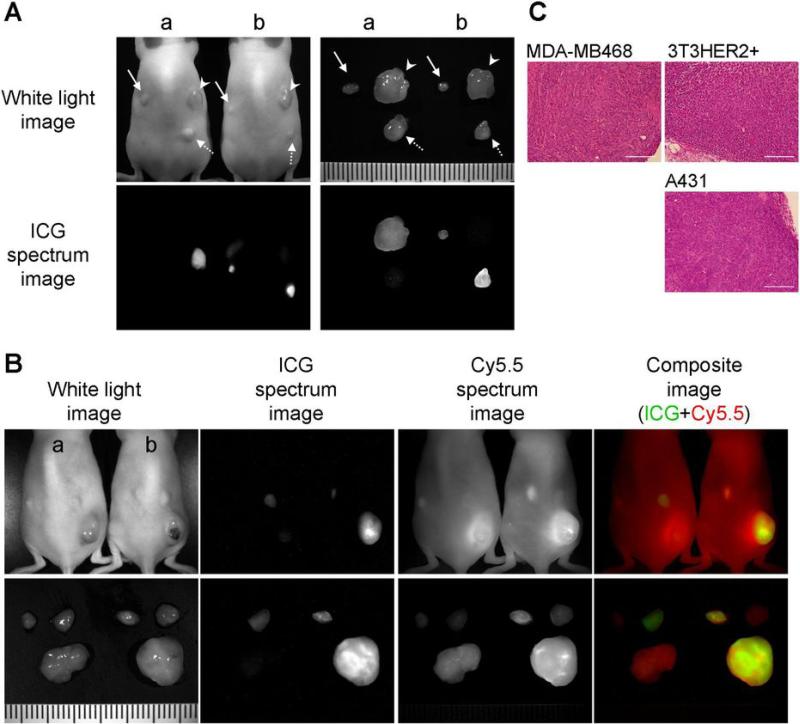
HER1+ tumors (MDA-MB468 and A431) were only visualized by Pan-ICG(1:5) not by Tra-ICG(1:5). On the other hand, the HER2+ tumor (3T3/HER2+) was imaged only by Tra-ICG(1:5) (Fig. 4A). Co-injected control human polyclonal IgG conjugated with Cy5.5 resulted in similar fluorescence in all 3 tumors (Fig. 4B). Histologic findings of these 3 tumors showed expected differences in histology (Fig. 4C).
Figure 4.
A: Fluorescence imaging with HER1 positive and HER2 positive tumor bearing mice. Arrow head; 3T3/HER2 tumors (HER2 positive), solid arrow; MDA-MB468 tumors (HER1 positive), dashed arrow; A431 (HER1 positive) tumors. a; Tra-ICG(1:5) injected mouse, b; Pan-ICG(1:5) injected mouse. The images were obtained 4 days after the injection. Only the target specific tumor was detected and tumor characterization was successful. B: Human polyclonal human IgG-Cy5.5 was co-injected with Tra-ICG(1:5) (a) or Pan-ICG(1:5) (b) to validate specific accumulation. Only the target tumor was visualized with each specific ICG conjugated antibody, however, all tumors were detected with IgG-Cy5.5. C: H&E staining of dissected tumors (bar = 200 μm).
Discussion
A growing number of humanized MoAbs directed against tumor-specific cell surface antigens have gained FDA approval and are successful in the clinic. If labeled with imaging “beacons”, these MoAbs could be used to diagnose and treat cancers. Such antibodies can be “labeled” with chelates that bind radioactive metals useful for diagnosis and therapy (11,12). Radiolabeling, however, exposes patients to ionizing radiation and results in imaging with poor spatial and temporal resolution. Optical labeling overcomes these disadvantages but suffers from poor tissue penetration preventing whole body imaging. Among the fluorophores, NIR probes have the greatest tissue penetration and among the NIR probes only ICG is FDA approved for clinical use.
The use of ICG conjugated antibodies has been limited because ICG loses its fluorescence, once it is covalently bound to protein (8-10). Fluorescence, however, can be recovered from Ab-ICG conjugates by application of 5%SDS and 2-ME that release the ICG from the protein. Although the mechanism is still poorly understood, it is likely that a non-covalent interaction between the ICG and hydrophobic amino acids on IgG causes loss of fluorescence. Of course, this effect can be combined with classic self-quenching to produce even higher quenching capacities. For instance, when the antibody:ICG ratio was increased to 1:5 quenching capacities of 43-58 fold were observed vs. ~6-fold for the 1:1 conjugation. This property can be exploited in vivo. Trastuzumab binds to HER2 on the plasma membrane, and subsequently, gradually internalized into the cytoplasm and then is delivered to lysosome to degenerate (13). It was observed in HER2+ cells that Tras-ICG became activated after 8 hours of incubation, yielding virtually no signal before that. It is proposed that as Tras-ICG is internalized and cut into component peptides releasing ICGs in the endosome-lysosome over 8 hours. Similarly, uptake within tumors can be demonstrated with matched Ab-ICG conjugates and antigen-expressing cell lines with minimal background signal. Thus, Ab-ICG conjugates are capable of labeling tumors in vivo with an FDA-approved NIR optical probe enabling tumors to be detected below the skin surface.
Ab-ICG(1:5) conjugate releases weakly bound ICG or is partially trapped in the liver. ICG is catabolized in the liver and excreted into the bile hence its use in assessing hepatic function in humans (14). Therefore, it is not surprising that considerable uptake in the liver one day after injection could be cleared quickly. This interfered with in vivo imaging by increasing scattered background signal especially for tumors placed near the liver. Fortunately, ICG is excreted relatively rapidly through the liver so that by day 3 liver signal was greatly reduced. The phenomenon of hepatic uptake was higher for the Ab:ICG(1:5) compounds but this was balanced by much higher signal from the tumor itself.
Regarding clinical translation of Ab-ICG compounds it is helpful that both MoAbs; daclizimab, panitumumab and trastuzumab and the NIR fluorophore, ICG, are already FDA-approved. Recognizing that conjugates may have different toxicities than their individual components, these agents will have to undergo extensive toxicity testing prior to human use, however, the presence of two approved agents in the conjugate certainly bodes well for its eventual clearance for human use compared with fluorescent proteins, which are excellent endogenous fluorescence emitters (15,16) but require in vivo transfection which is unlikely to be permitted in humans in the near term (17).
Clinical translation of described agents will require detector/scanner systems for in vivo NIR fluorescence imaging in humans. NIR endoscopic cameras to assist surgery have been described (18,19). In addition, a NIR clinical breast scanner has recently become available. Therefore, it is realistic to assume that this technology could be adapted for use with the ICG-MoAb conjugates described here. Since the optical imaging system is simple and inexpensive compared to other imaging methods, it is likely that the method, if helpful in humans, would be readily accepted by clinicians.
Supplementary Material
Acknowledgements
This research was supported by the Intramural Research Program of the NIH, National Cancer Institute, Center for Cancer Research.
References
- 1.Sharma R, Wendt JA, Rasmussen JC, Adams KE, Marshall MV, Sevick-Muraca EM. New horizons for imaging lymphatic function. Ann N Y Acad Sci. 2008;1131:13–36. doi: 10.1196/annals.1413.002. [DOI] [PMC free article] [PubMed] [Google Scholar]
- 2.Weissleder R. A clearer vision for in vivo imaging. Nat Biotechnol. 2001;19:316–7. doi: 10.1038/86684. [DOI] [PubMed] [Google Scholar]
- 3.Sakka SG. Assessing liver function. Curr Opin Crit Care. 2007;13:207–14. doi: 10.1097/MCC.0b013e328012b268. [DOI] [PubMed] [Google Scholar]
- 4.Dzurinko VL, Gurwood AS, Price JR. Intravenous and indocyanine green angiography. Optometry. 2004;75:743–55. doi: 10.1016/s1529-1839(04)70234-1. [DOI] [PubMed] [Google Scholar]
- 5.Urano Y, Asanuma D, Hama Y, et al. Selective molecular imaging of viable cancer cells with pH-activatable fluorescence probes. Nat Med. 2008 doi: 10.1038/nm.1854. in press. [DOI] [PMC free article] [PubMed] [Google Scholar]
- 6.Kamiya M, Kobayashi H, Hama Y, et al. An enzymatically activated fluorescence probe for targeted tumor imaging. J Am Chem Soc. 2007;129:3918–29. doi: 10.1021/ja067710a. [DOI] [PMC free article] [PubMed] [Google Scholar]
- 7.Hama Y, Urano Y, Koyama Y, et al. A target cell-specific activatable fluorescence probe for in vivo molecular imaging of cancer based on a self-quenched avidin-rhodamine conjugate. Cancer Res. 2007;67:2791–9. doi: 10.1158/0008-5472.CAN-06-3315. [DOI] [PubMed] [Google Scholar]
- 8.Tadatsu Y, Muguruma N, Ito S, et al. Optimal labeling condition of antibodies available for immunofluorescence endoscopy. J Med Invest. 2006;53:52–60. doi: 10.2152/jmi.53.52. [DOI] [PubMed] [Google Scholar]
- 9.Tadatsu M, Ito S, Muguruma N, et al. A new infrared fluorescent-labeling agent and labeled antibody for diagnosing microcancers. Bioorg Med Chem. 2003;11:3289–94. doi: 10.1016/s0968-0896(03)00239-6. [DOI] [PubMed] [Google Scholar]
- 10.Muguruma N, Ito S, Hayashi S, et al. Antibodies labeled with fluorescence-agent excitable by infrared rays. J Gastroenterol. 1998;33:467–71. doi: 10.1007/s005350050116. [DOI] [PubMed] [Google Scholar]
- 11.Waldmann TA. Immunotherapy: past, present and future. Nat Med. 2003;9:269–77. doi: 10.1038/nm0303-269. [DOI] [PubMed] [Google Scholar]
- 12.Goldenberg DM, Larson SM, Reisfeld RA, Schlom J. Targeting cancer with radiolabeled antibodies. Immunol Today. 1995;16:261–4. doi: 10.1016/0167-5699(95)80177-4. [DOI] [PubMed] [Google Scholar]
- 13.Harari D, Yarden Y. Molecular mechanisms underlying ErbB2/HER2 action in breast cancer. Oncogene. 2000;19:6102–14. doi: 10.1038/sj.onc.1203973. [DOI] [PubMed] [Google Scholar]
- 14.Cherrick GR, Stein SW, Leevy CM, Davidson CS. Indocyanine green: observations on its physical properties, plasma decay, and hepatic extraction. J Clin Invest. 1960;39:592–600. doi: 10.1172/JCI104072. [DOI] [PMC free article] [PubMed] [Google Scholar]
- 15.Hoffman RM. The multiple uses of fluorescent proteins to visualize cancer in vivo. Nat Rev Cancer. 2005;5:796–806. doi: 10.1038/nrc1717. [DOI] [PubMed] [Google Scholar]
- 16.Hasegawa S, Yang M, Chishima T, et al. In vivo tumor delivery of the green fluorescent protein gene to report future occurrence of metastasis. Cancer Gene Ther. 2000;7:1336–40. doi: 10.1038/sj.cgt.7700244. [DOI] [PubMed] [Google Scholar]
- 17.Yang M, Baranov E, Moossa AR, Penman S, Hoffman RM. Visualizing gene expression by whole-body fluorescence imaging. Proc Natl Acad Sci U S A. 2000;97:12278–82. doi: 10.1073/pnas.97.22.12278. [DOI] [PMC free article] [PubMed] [Google Scholar]
- 18.Upadhyay R, Sheth RA, Weissleder R, Mahmood U. Quantitative real-time catheter-based fluorescence molecular imaging in mice. Radiology. 2007;245:523–31. doi: 10.1148/radiol.2452061613. [DOI] [PubMed] [Google Scholar]
- 19.Tanaka E, Choi HS, Fujii H, Bawendi MG, Frangioni JV. Image-guided oncologic surgery using invisible light: completed pre-clinical development for sentinel lymph node mapping. Ann Surg Oncol. 2006;13:1671–81. doi: 10.1245/s10434-006-9194-6. [DOI] [PMC free article] [PubMed] [Google Scholar]
Associated Data
This section collects any data citations, data availability statements, or supplementary materials included in this article.


