Abstract
In vivo molecular cancer imaging with monoclonal antibodies has great potential not only for cancer detection but also for cancer characterization. However, the prolonged retention of intravenously injected antibody in the blood causes low target tumor-to-background ratio (TBR). Avidin has been used as a “chase” to clear the unbound, circulating biotinylated antibody and decrease the background signal. Here, we utilize a combined approach of a Fluorescence Resonance Energy Transfer (FRET) quenched antibody with an “avidin chase” to increase TBR. Trastuzumab, a humanized monoclonal antibody against human epidermal growth factor receptor type 2 (HER2), was biotinylated and conjugated with the near-infrared (NIR) fluorophore Alexa680 to synthesize Tra-Alexa680-biotin. Next, the FRET quencher, QSY-21, was conjugated to avidin, neutravidin (nAv) or streptavidin (sAv), thus creating Av-QSY21, nAv-QSY21 or sAv-QSY21 as “chasers”. The fluorescence was quenched in vitro by binding Tra-Alexa680-biotin to Av-QSY21, nAv-QSY21 or sAv-QSY21. To evaluate if the injection of quencher-conjugated avidin-derivatives can improve target TBR by using a dual “quench and chase” strategy, both target (3T3/HER2+) and non-target (Balb3T3/ZsGreen) tumor bearing mice were employed. The “FRET quench” effect induced by all the QSY21 avidin-based conjugates reduced but did not totally eliminate background signal from the blood pool. The addition of nAv-QSY21 administration increased target TBR mainly due to the “chase” effect where unbound conjugated antibody was preferentially cleared to the liver. The relatively slow clearance of unbound nAv-QSY21 leads to further reductions in background signal by leaking out of the vascular space and binding to unbound antibodies in the extravascular space of tumors resulting in decreased non-target tumor-to-background ratios but increased target TBR due to the “FRET quench” effect because target-bound antibodies were internalized and could not bind to nAv-QSY21. In conclusion, the proposed “quench-and-chase” system combines two strategies, fluorescent quenching and avidin chasing to improve target TBR and reduce non target TBR which should result in both improved tumor sensitivity and specificity.
INTRODUCTION
In vivo molecular cancer imaging with monoclonal antibodies has great potential for cancer detection and characterization. However, a high target tumor signal is required to overcome the high background signal arising from the slow blood clearance of antibodies. “Avidin chase” is a classic method to increase TBR in immunoscintigraphy by reducing background signal arising from circulating unbound antibodies by accelerating hepatic clearance (1-5). In this method, radiolabeled biotinylated antibodies circulating in the blood are “chased” from the circulation after avidin injection since the avidin-biotin-antibody complex is rapidly removed from circulation in the liver. This “chase” paradigm has recently been applied to dendrimer- and albumin-based MRI contrast agents and optical imaging agents (6-8).
Activation of optical probes at the target can further increase TBR. The fluorescence signal from optical imaging probes can be deactivated and activated (or “quenched and dequenched”) by changing the surrounding environment. FRET is one mechanism of quenching whereby fluorescence energy is transfered from an electronically excited donor molecule to a ground-state acceptor molecule (9). Activation can also be achieved with other modalities. For instance, MRI signal from contrast agents can be deactivated and activated (10,11). However, the percentage change in signal between the activated and deactivated state is substantially higher for optical imaging. If the acceptor molecule is a quencher, which does not emit light when it returns to the ground state, the fluorescence from the donor molecule is absorbed and the molecular probe is quenched. FRET is observed only when the distance between the donor and the acceptor is less than 100 Å, the so-called Förster radius (9). The avidin-biotin linkage allows a FRET interaction to occur between the fluorophore and its quencher, a phenomenon that has been exploited in in vitro assays for many years (12-14). Thus, when the appropriate pair of fluorophore-quencher molecules is linked via avidin-biotin binding to a carrier molecule, such as an antibody, the fluorescent signal from the donor fluorophore is quenched by the acceptor quencher molecule.
In this study, we combined two strategies to improve target TBR: “FRET quenching” and an avidin “chase”. Trastuzumab, a humanized monoclonal IgG1 antibody to human epidermal growth factor receptor type 2 (HER2), was biotinylated and conjugated with a near-infrared (NIR) fluorophore, AlexaFluor680 (Alexa680). To implement this dual “quench and chase” strategy, QSY-21 (quencher) was conjugated to avidin or to one its derivatives, neutravidin or streptavidin, resulting in simultaneous tumor specific activation (or dequenching) and improved background clearance. This “quench-and-chase” system was evaluated in vivo, using both HER2 positive and negative tumor bearing mice to demonstrate improved target TBR and reduced non-target TBR.
EXPERIMENTAL PROCEDURES
Reagents
Trastuzumab (Tra), an FDA-approved humanized anti-HER-2 antibody, was purchased from Genentech Inc. (South San Francisco, CA). Alexa680-NHS ester and QSY21-NHS ester were purchased from Invitrogen Corporation (Carlsbad, CA). Amine reactive biotin, sulfosuccinimidyl-6-(biotin-amido)hexanoate (Sulfo-NHS-LC-Biotin) was purchased from Pierce Chemical Co. (Rockford, IL). ZsGreen plasmid was purchased from Clontech Laboratories, Inc. (Mountain View, CA). All other chemicals used were of reagent grade.
Synthesis of Alexa680 conjugated biotinylated antibody (Tra-Alexa680-biotin)
Trastuzumab (6.8 nmol) was incubated with Alexa680-NHS (55 nmol, 5 mM in DMSO) in 0.1M Na2HPO4 (pH 8.5) at room temperature for 30 min. The mixture was purified with a Sephadex G50 column (PD-10; GE Healthcare, Piscataway, NJ). The protein concentration was determined with the Coomassie Plus protein assay kit (Pierce Biotechnology, Rockford, IL) by measuring the absorption at 595 nm with a UV-Vis system (8453 Value UV-Visible Value System; Agilent Technologies, Santa Clara, CA). The concentration of Alexa680 was measured by absorption with the UV-Vis system to confirm the number of fluorophore molecules conjugated to each trastuzumab molecule. The number of Alexa680 per antibody was ~4 to5. The resulting conjugate (Tra-Alexa680) was concentrated using a centrifugal filter device (Centricon YM-30, Millipore, Bedford, MA) to 37 μM. Then, NHS-LC-biotin (195 nmol, 5 mM in DMSO) was added to this solution and reacted in 0.1M Na2HPO4 (pH 8.5) at room temperature for 30 min. Unreacted biotin was separated from antibody by Sephadex G50 column and the Tra-Alexa680-biotin was purified. The biotin labeling ratio was determined by the HABA method (15). The number of biotin molecules conjugated to trastuzumab was ~11.
Synthesis of QSY21 conjugated avidin, neutravidin and streptavidin (Av-QSY21, nAv-QSY21, sAv-QSY21)
Avidin, neutravidin or streptavidin (14 nmol) were incubated with QSY21-NHS (42 nmol, 12 mM in DMSO) in 0.1M Na2HPO4 (pH 8.5) at room temperature for 30 min. Each mixture was purified with a Sephadex G50 column. The concentrations of protein and QSY21 were measured as described above. The number of QSY21 per avidin or avidin derivative was approximately 1.
Determination of FRET quench effect with complexes of Tra-Alexa680-biotin and Av-QSY21, nAv-QSY21 or sAv-QSY21 in vitro
Tra-Alexa680-biotin (0.034 nmol in 100 μL PBS) was mixed with Av-QSY21, nAv-QSY21 or sAv-QSY21 (0.171 nmol in 100 μL PBS). For control, Av-QSY21, nAv-QSY21 or sAv-QSY21 was mixed with Tra-Alexa680. The change in fluorescence intensity was investigated with the Maestro In Vivo Imaging System (CRi Inc., Woburn, MA) using 671 to 705 nm excitation and 750 nm long-pass emission filters.
Determination of FRET quench effect before and after cell binding of Tra-Alexa680-biotin
3T3/HER2+ (1 × 10⁴) were plated on a cover glass–bottomed culture well and incubated for 16 h. Then, Tra-Alexa680-biotin was added to the medium (10 μg/mL), and the cells were incubated for 6 hr. Then, to check the quench effect, nAv-QSY21 was added to the medium (50 μg/mL) and the cells were incubated for an additional 30 min. As a control, the cells were incubated with Tra-Alexa680-biotin for 6.5 hr without nAv-QSY21 or incubated for 6.5hr with both Tra-Alexa680-biotin and nAv-QSY21. Cells were washed once with PBS, and fluorescence microscopy was performed using an Olympus BX51 microscope (Olympus America, Inc., Melville, NY) equipped with the following filters: excitation wavelength 590 to 650nm, emission wavelength 662.5 to 747.5 nm. Transmitted light differential interference contrast (DIC) images were also acquired.
Mouse tumor model
All procedures were carried out in compliance with the Guide for the Care and Use of Laboratory Animal Resources (1996), National Research Council, and approved by the local Animal Care and Use Committee.
The HER2 gene transfected NIH3T3 (3T3/HER2+) cell line was the positive control and, green fluorescence protein transfected Balb/3T3 cell line (Balb/3T3/ZsGreen) was used as a negative control since the Balb/3T3/ZsGreen cell line does not express HER2 receptor. The cell lines were grown in RPMI 1640 (Life Technologies, Gaithersburg, MD) containing 10% fetal bovine serum (Life Technologies), 0.03% L-glutamine, 100 units/mL penicillin, and 100 μg/mL streptomycin in 5% CO2 at 37°C.
Both receptor positive and negative tumor cell lines were implanted in the same mice. 3T3/HER2+ cells (2 × 10⁶ cells in PBS) were injected subcutaneously in the left dorsum, and Balb/3T3/ZsGreen cells (2 × 10⁶ cells in PBS) were injected subcutaneously into the right dorsum. The experiments were performed at 5 - 8 days after cell injection.
In vivo spectral imaging studies
Tra-Alexa680-biotin (50 μg) was injected via the tail vein into tumor bearing (3T3/HER2+ and Balb/3T3/ZsGreen HER2-) mice (n=4 in each group). One day after the Tra-Alexa680-biotin injection, the mice were anesthetized with intraperitoneally administered 10% sodium pentobarbital with 0.1% scopolamine butyl bromide, then spectral fluorescence images were obtained using the Maestro In Vivo Imaging System (CRi Inc., Woburn, MA) using two filter sets. The deep red filter sets were used to image Alexa680 fluorescence and the blue filter sets were used for ZsGreen fluorescence. The deep red filter sets use a band-pass filter from 642 to 680 nm (excitation) and a long-pass filter over 702 nm (emission), the blue filter sets use a band-pass filter from 437 to 476 nm (excitation) and a long-pass filter over 493 nm (emission). The tunable emission filter was automatically stepped in 10-nm increments from 650 to 950 nm for the deep red filter sets and from 500 to 800 nm for the blue filter sets while the camera captured images at each wavelength interval with constant exposure.
After taking the images, Av-QSY21, nAv-QSY21 or sAv-QSY21 (250 μg) were injected via tail vein into mice already injected with Tra-Alexa680-biotin. Then, fluorescence images were obtained in the same manner as described above at 5, 30, 60, 180, 360, 720 and 1440 min after the Av-QSY21, nAv-QSY21 or sAv-QSY21 injection. The spectral fluorescence images were then unmixed based on their spectral patterns using commercial software (Maestro software, CRi, Inc., Woburn, MA). Prone images were used for fluorescence intensity measurement. Regions of interest measurements were placed on the Alexa680 spectrum images with reference to the white light and ZsGreen spectrum images to measure the fluorescence intensities of the 3T3/HER2+ and Balb/3T3/ZsGreen HER2-tumor. For the background signal, regions of interest were placed between the tumors. Data are presented as the mean ± SD. Statistical analysis was carried out using the Mann-Whitney U-test.
RESULTS
Complexes of Tra-Alexa680-biotin and Av-QSY21, nAv-QSY21 or sAv-QSY21 are quenched
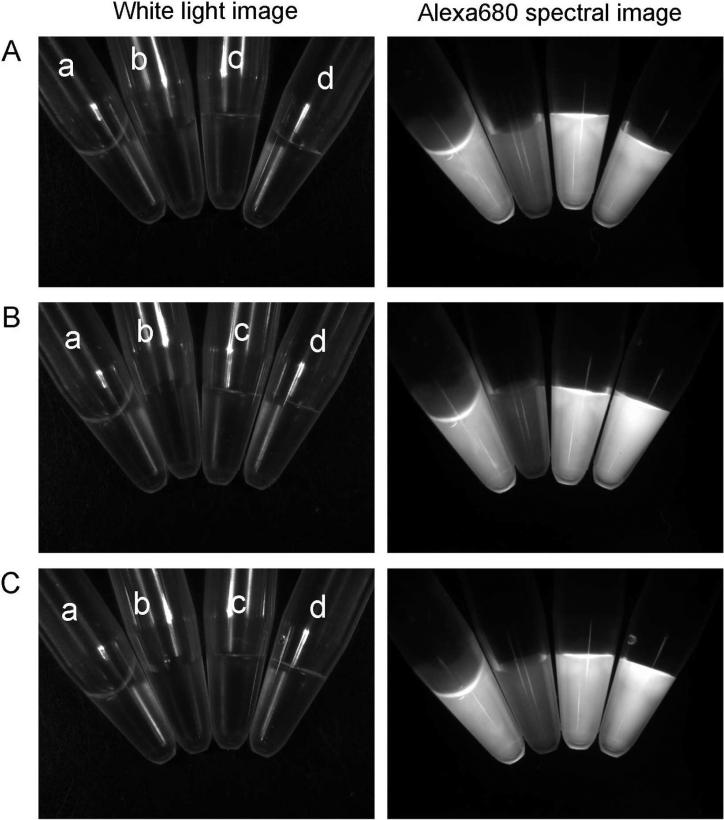
As shown in Figure 1, the fluorescence was quenched by adding Av-QSY21, nAv-QSY21 or sAv-QSY21 to the Tra-Alexa680-biotin solution. The quenching capacities were 2.4,- 4.4-and 3.2-fold for Av-QSY21, nAv-QSY21 or sAv-QSY21, respectively. On the other hand, there was no effect on non biotinylated probe, Tra-Alexa680.
Figure 1.
FRET quench by forming Tra-Alexa680-biotin and Av-QSY21 (A), nAv-QSY21 (B) or sAv-QSY21 (C) complexes in vitro. a; Tra-Alexa680-biotin + PBS, b; Tra-Alexa680-biotin + QSY21 conjugated avidin or derivatives, c; Tra-Alexa680 + PBS, d; Tra-Alexa680 + QSY21 conjugated avidin or derivatives. The fluorescence was quenched by forming Tra-Alexa680-biotin and Av-QSY21, nAv-QSY21 or sAv-QSY21 complexes. 150×166mm (300 × 300 DPI)
nAv-QSY21 quenched Tra-Alexa680-biotin on the cell surface but not internalized conjugates
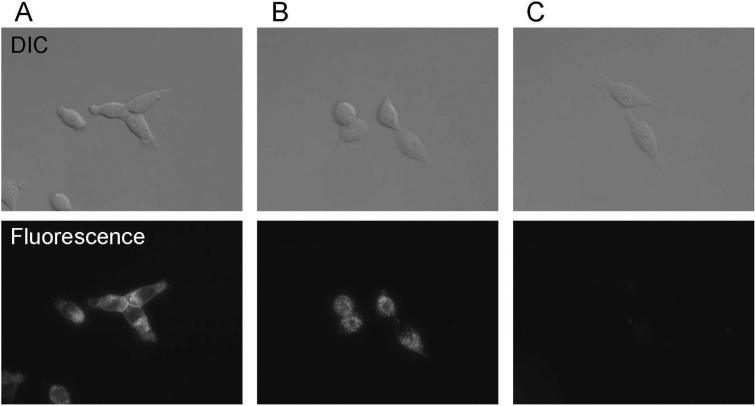
To investigate FRET quenching effects in vitro , fluorescence microscopy studies were carried out. High fluorescence signal was detected on the surface as well as inside of the cells with Tra-Alexa680-biotin incubation alone (Figure 2(A)). In contrast, after nAv-QSY21 was added quenching was observed at the cell surface (Figure 2(B)), but not from previously internalized Tra-Alexa680-biotin. When both Tra-Alexa680biotin and nAv-QSY21 were added at the same time, fluorescence signal could not be detected either on the surface or inside the cells even 6.5 hrs after incubation (Figure 2(C)).
Figure 2.
3T3/HER2+ cell images of (A) 6.5 hrs after incubation with Tra-Alexa680-biotin, (B) 6 hrs after incubation with Tra-Alexa680-biotin then added nAv-QSY21 30min before observation, (C) 6.5 hrs after incubation with both Tra-Alexa680-biotin and nAv-QSY21. The bright fluorescence signal was detected on the surface as well as inside of the cells with Tra-Alexa680-biotin incubation (A). In contrast, nAv-QSY21 only quenched the fluorescence on the cell surface (B), but not the fluorescence yielded from the internalized antibodies. 180×109mm (300 × 300 DPI)
Pharmacokinetic effect of adding Av-QSY21, nAv-QSY21 or sAv-QSY21 to Tra-Alexa680-biotin in vivo
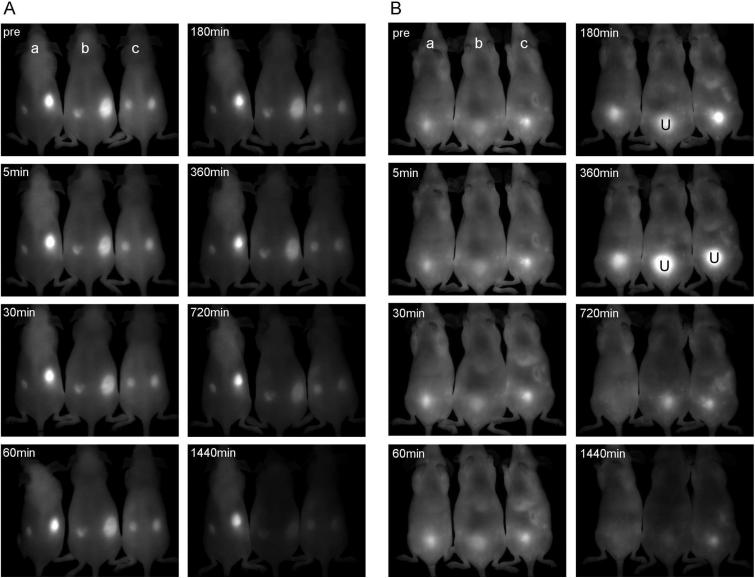
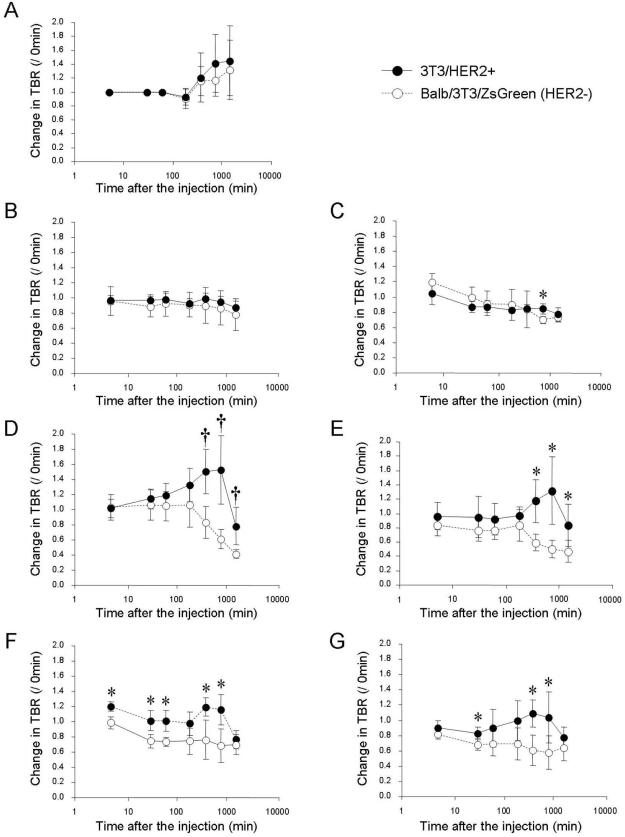
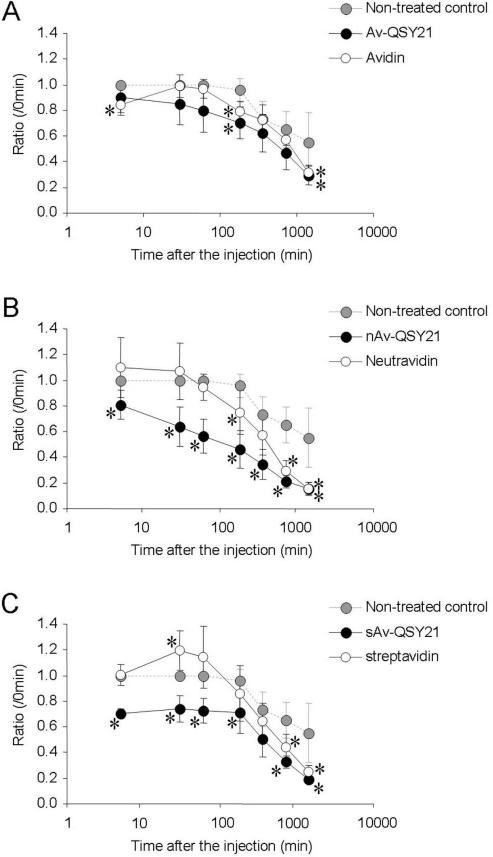
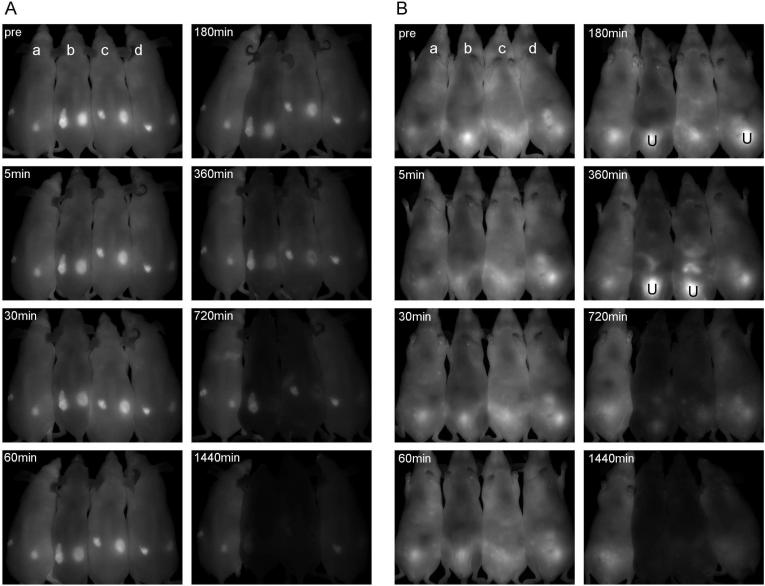
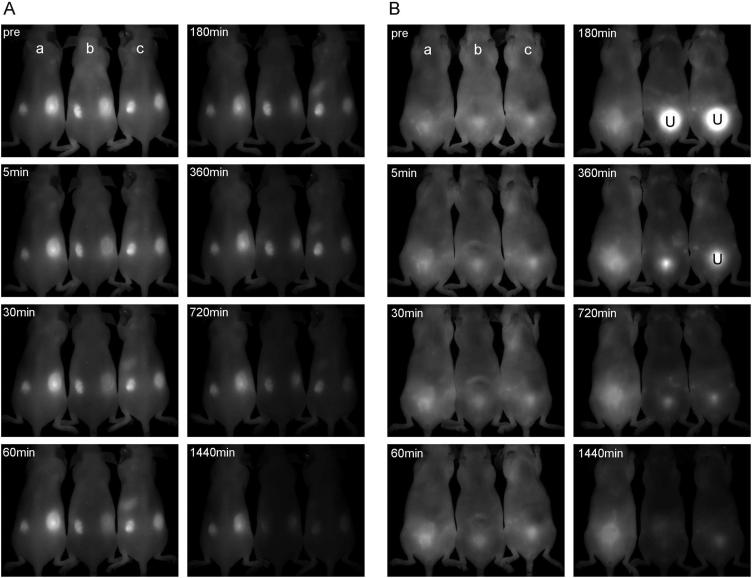
Figure 3 to 6 show the prone and supine images of tumor bearing mice with time, respectively. The measured fluorescence are represented by changes in TBR (= (TBR at each time point) / (TBR at 0min)) and summarized in Figure 7. The changes in background fluorescence intensity from the body are shown in Figure 8.
Figure 3.
Comparison of Alexa680 spectral images after b; Av-QSY21 (250 □Êg, iv) or c; avidin (250 □Êg, iv) injection into Tra-Alexa680-biotin treated mice at each time point. a; non-treated control. A; prone and B; supine images. Tra-Alexa680-biotin (50 □Êg, iv) was injected into tumor bearing mice (left dorsal; 3T3/HER2+, right dorsal; Balb/3T3/ZsGreen HER2- shown in A) one day before avidin treatments. The accumulation in the lower abdomen shown in B is the urine (U) in the bladder. 230×184mm (300 × 300 DPI)
Figure 6.
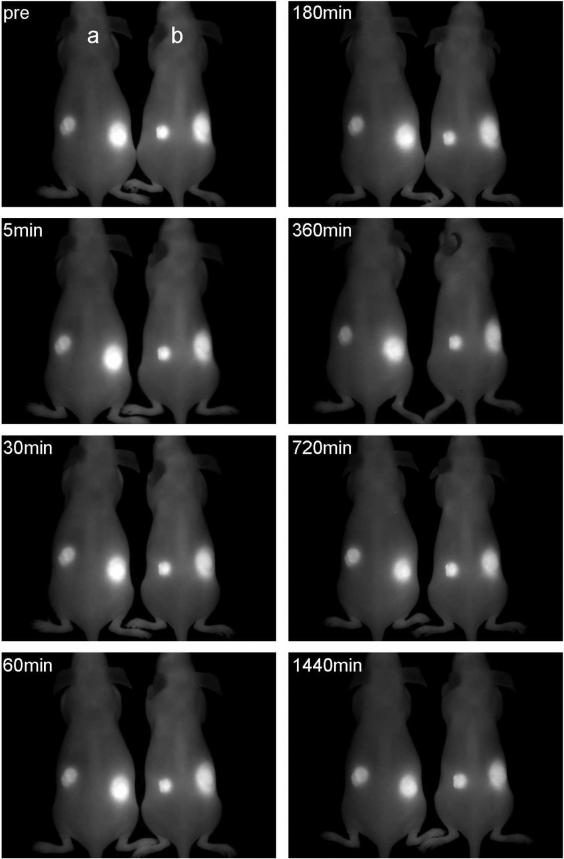
Alexa680 spectral images of non-biotinylated antibody, Tra-Alexa680 treated mice. a; non-treated control, b; nAv-QSY21 (250 □Êg, iv). No effect was observed by nAv-QSY21 treatment. 119×187mm (300 × 300 DPI)
Figure 7.
Time courses of changes in fluorescence TBR (TBR in each time point/ TBR at 0 min) in HER2 positive and HER2 negative tumors. A; non-treatment, B; Av-QSY21, C; avidin, D; nAv-QSY21, E; neutravidin, F; sAv-QSY21, G; streptavidin. *P < 0.05, □õP < 0.005 (Mann-Whitney U-test) vs. HER2 negative tumor in each treated condition. 160×207mm (300 × 300 DPI)
Figure 8.
Change in background fluorescence intensities after A; avidin or Av-QSY21, B; neutravidin or nAv-QSY21 or C; streptavidin or sAv-QSY21 treatments. *P < 0.05 (Mann-Whitney U-test) vs. non-treated control. 129×188mm (300 × 300 DPI)
The background fluorescence was immediately decreased by all QSY21 conjugated molecules, Av-QSY21, nAv-QSY21 and sAv-QSY21. The largest decrease was observed for nAv-QSY21 treatment. The background fluorescence was decreased only at 180 min post-injection of non-QSY21 conjugated neutravidin or later time points. The decreased level was not significant for avidin treated mice compared to non treated controls except for the 1440 min time point. For streptavidin treated mice, the background level was even higher than the control group at 30 min after the injection, and it was decreased at 180 min and later time points.
After nAv-QSY21 injection, fluorescence from the HER2 negative tumor decreased while the TBR in HER2 positive tumor increased with time. As a result, at 720+ minutes after injection of the nAv-QSY21 only the HER2 positive tumor was visualized. The unconjugated neutravidin resulted in decreased non-target tumor-to-background ratio, however, the effect was much weaker than with QSY21-conjugated neutravidin indicating the combined effects of the “quench and chase” strategy. The sAv-QSY21 complex resulted in decreased fluorescence in the HER2 negative tumor but the tumor was still barely visible. In addition, since streptavidin does not have a substantial “chase effect”, the TBR for HER2 positive tumors did not increase with streptavidin without QSY21 conjugation. The Av-QSY21 and avidin treatment did not result in a difference between targeted and non-targeted tumors indicating that the avidin or Av-QSY21 primarily affected the unbound antibodies in the circulation.
The liver fluorescence due to the chase effect was observed at 30 min+ post-injection with avidin and 360 min+ post-injection of neutravidin, but this liver signal was not observed for QSY21 conjugated avidin or neutravidin due to FRET quench effects.
DISCUSSION
To achieve target specific imaging with high tumor TBR, we combined “avidin chase” and “FRET quenching” methods, which reduce background signal by a combination of rapidly clearing unbound conjugate through the liver as well as photo-chemically quenching non internalized labeled and biotinylated antibody. As expected, the FRET quencher, QSY21 conjugated to avidin and its derivatives quenched the fluorescence of extracellular Tra-Alexa680-biotin in vitro (Figure 1). Among the three avidin derivatives, the quenching efficiency was strongest for nAv-QSY21, although the number of biotin binding sites and affinities for biotin are the same for avidin, neutravidin and streptavidin. Some structural differences including isoelectric points or hydrophilicity in each derivative might affect the steric distance between Alexa680 and QSY21 leading to differences in quenching efficiency. Quenching was only observed when the QSY21-avidin (or derivative) complex was mixed with biotinylated antibody, but not with non-biotinylated antibody. Therefore, quenching is due to the FRET effect between Alexa680 and QSY21 after forming the avidin-biotin bond.
To investigate this phenomenon in vivo both targeted (3T3/HER2+) and non-targeted (Balb3T3/ZsGreen) tumor bearing mice were employed. The “FRET quench” effect induced by all QSY21-avidin (and derivatives) reduced background signal from the blood pool just after the injection (Figure 3, 4, 5, 8). This rapid decline in signal represents the “FRET quench” effect in vivo; non-QSY21 conjugated avidin derivatives, with the exception of avidin, did not decrease background at the initial time point. The injected QSY21-avidin (and derivatives) conjugates rapidly distributed in the circulation and bound to circulating Tra-Alexa680-biotin in the blood forming an avidin-biotin bond, leading to “FRET quenching”. The background signal quenching effect was stronger for nAv-QSY21 and sAv-QSY21 than for Av-QSY21. This is likely because the blood clearance of avidin is much faster than streptavidin (16,17) or neutravidin, which are deglycosylated and neutralized avidins (18,19). The prolonged relative retention of nAv-QSY21 and sAv-QSY21 in circulation increased the likelihood of binding with Tra-Alexa680-biotin which was distributed both in the vascular and extravascular spaces. In contrast, unconjugated avidin reduced the background signal as a result of the “chase” effect. The “chase” effect of avidin is quicker than the other avidin derivatives (20). A consequence of this faster clearance was that avidin was less effective in “chasing” Tra-Alexa680-biotin that had entered the extravascular space due to the EPR effect, leading to a reduced target-to-non target tumor ratio.
Figure 4.
Comparison of Alexa680 spectral images after b; nAv-QSY21 (250 □Êg, iv), c; neutravidin (250 □Êg, iv) or d; Av-QSY21 (250 □Êg, iv) injection into Tra-Alexa680-biotin treated mice at each time point. a; non-treated control. A; prone and B; supine images. Tra-Alexa680-biotin (50 □Êg, iv) was injected into tumor bearing mice (left dorsal; 3T3/HER2+, right dorsal; Balb/3T3/ZsGreen HER2- shown in A) one day before neutravidin treatments. The accumulation in the lower abdomen shown in B is the urine (U) in the bladder. 230×185mm (300 × 300 DPI)
Figure 5.
Comparison of Alexa680 spectral images after b; sAv-QSY21 (250 □Êg, iv) or c; streptavidin (250 □Êg, iv) injection into Tra-Alexa680-biotin treated mice at each time point. a; non-treated control. A; prone and B; supine images. Tra-Alexa680-biotin (50 □Êg, iv) was injected into tumor bearing mice (left dorsal; 3T3/HER2+, right dorsal; Balb/3T3/ZsGreen HER2- shown in A) one day before streptavidin treatments. The accumulation in the lower abdomen shown in B is the urine (U) in the bladder. 230×184mm (300 × 300 DPI)
In comparison to avidin complexes, the complexes formed by neutravidin and streptavidin and the biotinylated antibody in circulation are more slowly formed and cleared (20).
At the initial points, the background signal was increased by non conjugated streptavidin compared to controls as shown in Figs 4 and 7. We hypothesize that streptavidin, which has minimal “chase” effects, leads to retention of the biotinylated antibody in the circulation by forming streptavidin-biotin-antibody complex that leads to a redistribution of Tra-Alexa680-biotin from the extravascular space to the circulation thus increasing the fluorescence signal of the background. This increase was not observed with sAv-QSY21, because the fluorescence from circulating streptavidin-biotin-antibody complex was quenched by the “FRET effect”.
With nAv-QSY21, the slower clearance of neutravidin compared to avidin and the faster clearance of neutravidin-biotin-antibody complex compared to streptavidin-biotin-antibody complex increased the target TBR because of the “chase” effect, where unbound conjugate was preferentially cleared by the liver. Relatively slow clearance of nAv-QSY21 allows leaking out and binding to the unbound antibodies in the extravascular space resulting in decreased non-target TBR but increased target TBR due to the “FRET quench” effect because target-bound antibodies were internalized and could not bind to nAv-QSY21. In this model, nAv-QSY21 remained in the circulation long enough to leak out and bind nonspecifically to Tra-Alexa680-biotin which had non-specifically entered the extravascular space of the non-target Balb3T3 (HER2-) tumor due to the Enhanced Permeability and Retention (EPR) effect. These nAv-QSY21-biotin-antibody complexes were quenched and gradually cleared to the liver. Therefore, the background level was continuously decreased after nAv-QSY21 administration due to the combined effects of “FRET quenching” and background “chasing”. On the other hand, neither “quench” nor “chase” effects were observed when non-biotinylated Tra-Alexa680 was used (Figure 6). These results support the dual functionality of nAv-QSY21 as both a “quencher and a chaser”.
In conclusion, the proposed “quench-and-chase” strategy using nAv-QSY21 allowed high TBR in target tumor and reduced TBR in the non-target tumor resulting in successful imaging with a fluorescently labeled antibody. This “quench-and-chase” system can distinguish the tumor specific targeted antibody fraction from the non-specific accumulation of the antibody in the tumor due to EPR effects. Recently, multiple pairs of fluorophore-quencher pairs have been developed and these pairs could be readily adapted for the “quench and chase” strategy. Furthermore, the principle of “quench-and-chase” can be applied to other carrier molecules, such as peptides, dendrimers and liposomes to achieve high TBR during in vivo molecular imaging. Thus, “quench and chase” is a generalizeable dual strategy to improve the target TBR of molecular optical probes.
Supplementary Material
SUPPORTING INFORMATION AVAILABLE
Supplemental figure 1.
Change in fluorescence signal in HER2 positive and HER2 negative tumors. One day after the Tra-Alexa680-biotin (50 μg, iv) injection, avidin (250 μg, iv) was injected to each mouse. Fluorescence images were obtained in the same manner as described above at 5, 30, 60, 180, 360, 720 and 1440 min after the avidin injection (A). The additional nAv-QSY21 injection (250 μg, iv) was performed 30min after the avidin injection to investigate the quenching effect, and images were obtained in the same manner at 5, 30, 60, 180, 360, 720 and 1440 min after the nAv-QSY21 injection (B). The additionally injected nAv-QSY21 decreased the fluorescence only from HER2 negative tumor. Because the chase effect is mostly performed by previous avidin treatment, these results show the quenching effect of nAv-QSY21.This information is available free of charge via the Internet at http://pubs.acs.org.
ACKNOWLEDGEMENTS
This research was supported by the Intramural Research Program of the NIH, National Cancer Institute, Center for Cancer Research.
LITERATURE CITED
- 1.Klibanov AL, Martynov AV, Slinkin MA, Sakharov I, Smirnov MD, Muzykantov VR, Danilov SM, Torchilin VP. Blood clearance of radiolabeled antibody: enhancement by lactosamination and treatment with biotin-avidin or anti-mouse IgG antibodies. J Nucl Med. 1988;29:1951–6. [PubMed] [Google Scholar]
- 2.Sinitsyn VV, Mamontova AG, Checkneva YY, Shnyra AA, Domogatsky SP. Rapid blood clearance of biotinylated IgG after infusion of avidin. J Nucl Med. 1989;30:66–9. [PubMed] [Google Scholar]
- 3.Kobayashi H, Sakahara H, Hosono M, Yao ZS, Toyama S, Endo K, Konishi J. Improved clearance of radiolabeled biotinylated monoclonal antibody following the infusion of avidin as a “chase” without decreased accumulation in the target tumor. J Nucl Med. 1994;35:1677–84. [PubMed] [Google Scholar]
- 4.Kobayashi H, Sakahara H, Endo K, Yao ZS, Konishi J. Inflammation-seeking scintigraphy with radiolabeled biotinylated polyclonal IgG followed by the injection of avidin chase. Nucl Med Biol. 1996;23:29–32. doi: 10.1016/0969-8051(95)02010-1. [DOI] [PubMed] [Google Scholar]
- 5.Sato N, Saga T, Sakahara H, Nakamoto Y, Zhao S, Kuroki M, Iida Y, Endo K, Konishi J. Avidin chase can reduce myelotoxicity associated with radioimmunotherapy of experimental liver micrometastases in mice. Jpn J Cancer Res. 2000;91:622–8. doi: 10.1111/j.1349-7006.2000.tb00991.x. [DOI] [PMC free article] [PubMed] [Google Scholar]
- 6.Dafni H, Gilead A, Nevo N, Eilam R, Harmelin A, Neeman M. Modulation of the pharmacokinetics of macromolecular contrast material by avidin chase: MRI, optical, and inductively coupled plasma mass spectrometry tracking of triply labeled albumin. Magn Reson Med. 2003;50:904–14. doi: 10.1002/mrm.10638. [DOI] [PubMed] [Google Scholar]
- 7.Kobayashi H, Kawamoto S, Star RA, Waldmann TA, Brechbiel MW, Choyke PL. Activated clearance of a biotinylated macromolecular MRI contrast agent from the blood pool using an avidin chase. Bioconjug Chem. 2003;14:1044–7. doi: 10.1021/bc034064l. [DOI] [PubMed] [Google Scholar]
- 8.Hama Y, Koyama Y, Choyke PL, Kobayashi H. Two-color in vivo dynamic contrast-enhanced pharmacokinetic imaging. J Biomed Opt. 2007;12:034016. doi: 10.1117/1.2745306. [DOI] [PubMed] [Google Scholar]
- 9.Vogel SS, Thaler C, Koushik SV. Fanciful FRET. Sci STKE. 20062006 doi: 10.1126/stke.3312006re2. re2. [DOI] [PubMed] [Google Scholar]
- 10.Querol M, Bogdanov A., Jr. Amplification strategies in MR imaging: activation and accumulation of sensing contrast agents (SCAs). J Magn Reson Imaging. 2006;24:971–82. doi: 10.1002/jmri.20724. [DOI] [PubMed] [Google Scholar]
- 11.Urbanczyk-Pearson LM, Femia FJ, Smith J, Parigi G, Duimstra JA, Eckermann AL, Luchinat C, Meade TJ. Mechanistic investigation of beta-galactosidase-activated MR contrast agents. Inorg Chem. 2008;47:56–68. doi: 10.1021/ic700888w. [DOI] [PubMed] [Google Scholar]
- 12.Grant SA, Xu J, Bergeron EJ, Mroz J. Development of dual receptor biosensors: an analysis of FRET pairs. Biosens Bioelectron. 2001;16:231–7. doi: 10.1016/s0956-5663(00)00147-0. [DOI] [PubMed] [Google Scholar]
- 13.Oh E, Hong MY, Lee D, Nam SH, Yoon HC, Kim HS. Inhibition assay of biomolecules based on fluorescence resonance energy transfer (FRET) between quantum dots and gold nanoparticles. J Am Chem Soc. 2005;127:3270–1. doi: 10.1021/ja0433323. [DOI] [PubMed] [Google Scholar]
- 14.Liu L, Wei G, Liu Z, He Z, Xiao S, Wang Q. Two-photon excitation fluorescence resonance energy transfer with small organic molecule as energy donor for bioassay. Bioconjug Chem. 2008;19:574–9. doi: 10.1021/bc700369q. [DOI] [PubMed] [Google Scholar]
- 15.Green NM. A Spectrophotometric Assay for Avidin and Biotin Based on Binding of Dyes by Avidin. Biochem J. 1965;94:23C–24C. doi: 10.1042/bj0940023c. [DOI] [PubMed] [Google Scholar]
- 16.Schechter B, Silberman R, Arnon R, Wilchek M. Tissue distribution of avidin and streptavidin injected to mice. Effect of avidin carbohydrate, streptavidin truncation and exogenous biotin. Eur J Biochem. 1990;189:327–31. doi: 10.1111/j.1432-1033.1990.tb15493.x. [DOI] [PubMed] [Google Scholar]
- 17.Rosebrough SF. Pharmacokinetics and biodistribution of radiolabeled avidin, streptavidin and biotin. Nucl Med Biol. 1993;20:663–8. doi: 10.1016/0969-8051(93)90037-u. [DOI] [PubMed] [Google Scholar]
- 18.Rosebrough SF, Hartley DF. Biochemical modification of streptavidin and avidin: in vitro and in vivo analysis. J Nucl Med. 1996;37:1380–4. [PubMed] [Google Scholar]
- 19.Yao Z, Zhang M, Sakahara H, Nakamoto Y, Higashi T, Zhao S, Sato N, Arano Y, Konishi J. The relationship of glycosylation and isoelectric point with tumor accumulation of avidin. J Nucl Med. 1999;40:479–83. [PubMed] [Google Scholar]
- 20.Kobayashi H, Sakahara H, Endo K, Hosono M, Yao ZS, Toyama S, Konishi J. Comparison of the chase effects of avidin, streptavidin, neutravidin, and avidin-ferritin on a radiolabeled biotinylated anti-tumor monoclonal antibody. Jpn J Cancer Res. 1995;86:310–4. doi: 10.1111/j.1349-7006.1995.tb03056.x. [DOI] [PMC free article] [PubMed] [Google Scholar]
Associated Data
This section collects any data citations, data availability statements, or supplementary materials included in this article.
Supplementary Materials
SUPPORTING INFORMATION AVAILABLE
Supplemental figure 1.
Change in fluorescence signal in HER2 positive and HER2 negative tumors. One day after the Tra-Alexa680-biotin (50 μg, iv) injection, avidin (250 μg, iv) was injected to each mouse. Fluorescence images were obtained in the same manner as described above at 5, 30, 60, 180, 360, 720 and 1440 min after the avidin injection (A). The additional nAv-QSY21 injection (250 μg, iv) was performed 30min after the avidin injection to investigate the quenching effect, and images were obtained in the same manner at 5, 30, 60, 180, 360, 720 and 1440 min after the nAv-QSY21 injection (B). The additionally injected nAv-QSY21 decreased the fluorescence only from HER2 negative tumor. Because the chase effect is mostly performed by previous avidin treatment, these results show the quenching effect of nAv-QSY21.This information is available free of charge via the Internet at http://pubs.acs.org.


