Abstract
Previous studies have postulated an important role for the inwardly rectifying potassium current (IK1) in controlling the dynamics of electrophysiological spiral waves responsible for ventricular tachycardia and fibrillation. In this study, we developed a novel tissue model of cultured neonatal rat ventricular myocytes (NRVMs) with uniform or heterogeneous Kir2.1 expression achieved by lentiviral transfer to elucidate the role of IK1 in cardiac arrhythmogenesis. Kir2.1-overexpressed NRVMs showed increased IK1 density, hyperpolarized resting membrane potential and increased action potential upstroke velocity compared with GFP-transduced NRVMs. Opposite results were observed in Kir2.1-suppressed NRVMs. Optical mapping of uniformly Kir2.1 gene-modified monolayers showed altered conduction velocity (CV) and action potential duration (APD) compared with non-transduced and empty vector-transduced monolayers, but functional reentrant waves could not be induced. In monolayers with an island of altered Kir2.1 expression, CV and APD of the locally transduced and non-transduced regions were similar to those of the uniformly transduced and non-transduced monolayers, respectively, and functional reentrant waves could be induced. The waves were anchored to islands of Kir2.1 overexpression and remained stable, but dropped in frequency and meandered away from islands of Kir2.1 suppression. In monolayers with an inverse pattern of IK1 heterogeneity, stable high frequency spiral waves were present with IK1 overexpression, whereas lower frequency, meandering spiral waves were observed with IK1 suppression. Our study provides direct evidence for the contribution of IK1 heterogeneity and level to the genesis and stability of spiral waves and highlights the potential importance of IK1 as an anti-arrhythmia target.
Keywords: Kir2.1, inwardly rectifying potassium current, reentry, spiral waves, ventricular tachycardia, ventricular fibrillation
Introduction
Ventricular fibrillation (VF) is the leading cause of cardiac arrest and sudden cardiac death in the industrialized world.1 Studies in the 1970s suggested that the heart could sustain electrical activity that rotated around a functional obstacle.2,3 These reentrant waves are believed to be the unitary components of fibrillation. Several other studies that focused on understanding the mechanisms of initiation and maintenance of VF concluded that the stability of spiral waves (functional form of reentrant waves) depends on the abbreviation of action potential duration as well as the reduction of wavefront-wavetail interactions at fibrillation frequencies.4-6 In addition, ionic heterogeneity may be a key factor in the initiation of spiral waves and their transition to the irregular spatiotemporal pattern seen in VF.7-9 Numerous studies pioneered mainly by Jalife and coworkers have indicated that IK1 plays an important role in determining cardiac excitability and arrhythmogenesis and that IK1 block has a significant effect on VF dynamics.4,5,10-13 Also, genetic mutations in Kir2.1, the molecular correlate of IK1, can cause short QT syndrome SQT3,14 and Andersen syndrome15 with accompanying ventricular arrhythmias. While previous studies in transgenic mice concluded that IK1 up-regulation stabilizes high frequency rotors (organizing center of spiral waves),11,13 Kir2.1 expression in such transgenic hearts can be heterogeneous,16 and the effects of such heterogeneity on arrhythmogenesis have not been explored. We therefore investigated the effects of altered Kir2.1 expression on spiral wave dynamics in a novel, in vitro model of cultured neonatal rat ventricular myocytes (NRVMs) in which regional variations of Kir2.1 were engineered by tissue engineering and somatic gene transfer approaches. In NRVM monolayers with distinct regions of Kir2.1 overexpression or dominant-negative suppression, the role of IK1 heterogeneity in initiating and maintaining a high-frequency spiral wave was studied. Also, the secondary effects of IK1 modulation on cardiac single-cell and tissue electrophysiological properties, such as resting membrane potential (RMP), action potential (AP) phenotype, maximum upstroke velocity (dV/dtmax), action potential duration (APD), conduction velocity (CV) and maximum capture rate (MCR) were studied. The results of our study demonstrate that uniform up-regulation of IK1 does not necessarily create a medium that is prone to arrhythmogenesis, and suggest that CV and APD differences arising from heterogeneous overexpression of Kir2.1 contribute to the genesis and stability of reentrant spiral waves that can underlie life-threatening cardiac arrhythmias.
Materials and Methods
Details on Materials and Methods are given in the Online Supplement Material. In brief, freshly isolated, non-transduced NRVMs and NRVMs transduced by empty lentiviral vectors (LV-Empty) or lentiviral vectors (LVs) encoding Kir2.1 (LV-Kir2.1) or Kir2.1AAA (LV-Kir2.1AAA) were plated on 12 mm fibronectin-coated glass (for patch clamping) or 21 mm fibronectin-coated plastic (for optical mapping) coverslips as previously described.17 A modified form of a stenciling technique,18 involving polydimethylsiloxane (PDMS) stamps, was used to spatially localize transduced NRVMs in a co-culture model with non-transduced NRVMs. Six-day old monolayers were characterized by immunostaining for cardiac troponin I (cTnI), actin, Kir2.1 and connexin43 (Cx43). The levels of Kir2.1 and Cx43 were also characterized by Western blot. The electrophysiological single-cell properties of Kir2.1 gene-modified NRVMs were characterized by standard microelectrode whole-cell patch clamp techniques. Optical mapping over a 17 mm diameter field of view was performed on 6-day old, 21 mm diameter isotropic monolayers and monolayers with heterogeneous Kir2.1 expression to study the electrophysiological tissue properties. Bipolar line stimulation via platinum electrodes was applied just above one edge of the monolayer, and cells were stimulated with monophasic, 10 ms pulses at 2 Hz to determine CV and APD at 80% repolarization (APD80). In monolayers with IK1 heterogeneity, reentrant spiral waves were initiated by rapid pacing, and their inducibility, stability and frequency were determined. All data are expressed as mean±SD and compared using the paired Student's t test. A p-value of <0.05 was considered statistically significant.
Results
Characterization of non-transduced and Kir2.1 gene-modified cultures
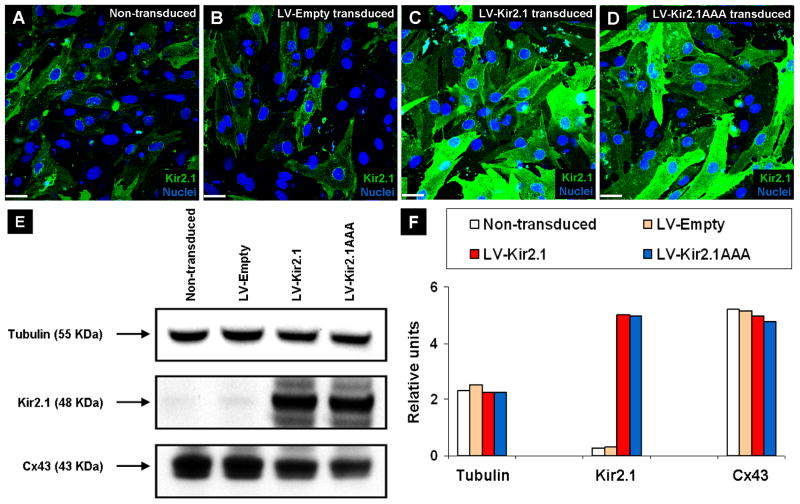
Immunohistochemistry against Kir2.1, cTnI, actin and Cx43 and Hoechst nuclear staining were performed to characterize the morphology, composition and levels of Kir2.1 and Cx43 expression in 6-day old non-transduced, LV-Empty transduced, LV-Kir2.1 transduced and LV-Kir2.1AAA transduced monolayers. Immunohistochemistry against Kir2.1 showed that while non-transduced (Figure 1A) and LV-Empty transduced (Figure 1B) NRVMs had low levels of native Kir2.1 protein, Kir2.1-transduced (Figure 1C) and Kir2.1AAA-transduced (Figure 1D) NRVMs had increased levels of wild type Kir2.1 and dominant-negative mutant, Kir2.1AAA, respectively. Immunostain images of cTnI, actin and Cx43 in non-transduced and transduced monolayers (Online Figure I) confirmed that in a given field of view both non-transduced and transduced cultures were morphologically similar and had similar levels and distributions of gap junctional protein expression. Western blot (Figure 1E) and integrated pixel density analysis (Figure 1F) showed similar levels of tubulin and Cx43 expression in all groups and greatly increased (up to 17-fold) levels of Kir2.1 (wild type and dominant-negative mutant in LV-Kir2.1 and LV-Kir2.1AAA, respectively) expression in Kir2.1 gene-modified groups compared with the non-transduced and LV-Empty transduced groups.
Figure 1.
Characterization of non-transduced and Kir2.1 gene-modified NRVM monolayers. Immunostain images of Kir2.1 in non-transduced (A), LV-Empty transduced (B), LV-Kir2.1 transduced (C) and LV-Kir2.1AAA transduced (D) monolayers. Hoechst (blue) was used to label the nuclei. (E) Western blot analysis of Kir2.1, Cx43 and tubulin. (F) Integrated pixel density analysis of the Western blot shown in (E). All scale bars, 50 μm.
Characterization of single-cell electrophysiological properties of Kir2.1-transduced NRVMs
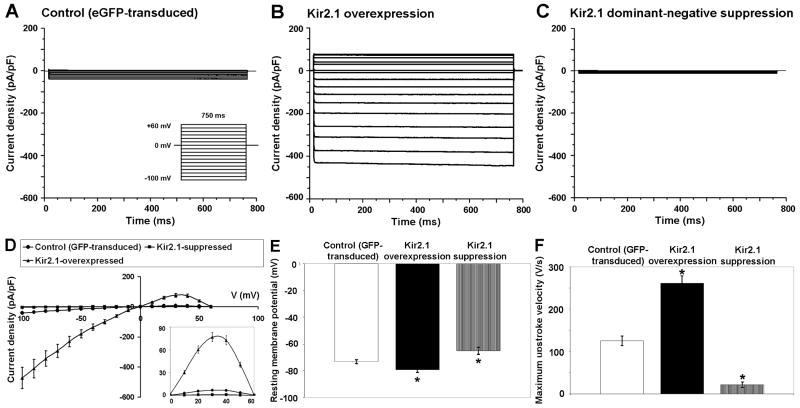
We performed whole-cell patch clamp on 6-day old eGFP-transduced and Kir2.1 gene-modified NRVMs to assess their single-cell electrophysiological properties. Transduced NRVMs exhibited enhancement or suppression of IK1 with overexpression or suppression of Kir2.1, respectively. When compared with eGFP-transduced NRVMs (-41.7±2.6 pA/pF; n=6; Figure 2A), the average IK1 density at -100 mV was significantly larger in Kir2.1-overexpressed NRVMs (-432.5±12.7 pA/pF; n=6; p=8.2×10⁻¹¹; Figure 2B) and significantly smaller in Kir2.1-suppressed NRVMs (-5±1.4 pA/pF; n=6; p=2.3×10⁻⁹; Figure 2C). Spontaneous APs were absent in Kir2.1-overexpressed NRVMs, and single APs could be triggered by a short depolarizing current stimulus. As reported by previous studies,19,20 with a greater and almost complete suppression of IK1, Kir2.1AAA-transduced NRVMs fired spontaneous APs resembling those of genuine pacemaker cells. Spontaneous APs were also observed in eGFP-transduced NRVMs. Representative APs observed in eGFP-transduced, Kir2.1-transduced and Kir2.1AAA-transduced NRVMs are shown in Online Figure II. Changes in IK1 also significantly shortened APD at 90% repolarization (APD90) in the Kir2.1-overexpressed group (29.9±9.1 ms; n=6; p=1.2×10⁻⁸) and significantly prolonged APD90 in the Kir2.1-suppressed group (183.9±7.2 ms; n=6; p=1.2×10⁻⁸) compared with the eGFP-transduced control group (116.3±6.8 ms; n=6). The I-V relationship of Kir2.1 gene-modified and eGFP-transduced NRVMs is shown in Figure 2D. As shown in the inset, overexpression of Kir2.1 also boosted outward IK1, whereas suppression of Kir2.1 reduced outward IK1 when compared with the eGFP-transduced control group (at +30 mV, 76.4±5.3 pA/pF; p=1.2×10⁻⁷; n=6 vs. 0.8±0.3 pA/pF; p=1.2×10⁻⁶; n=6 vs. 6.8±0.9 pA/pF; n=6, in overexpressed, suppressed, and control groups, respectively). As expected, Kir2.1-overexpressed NRVMs showed a significantly hyperpolarized RMP (-79.3±0.7 mV; n=3; p=0.0013; Figure 2E) whereas Kir2.1AAA-overexpressed NRVMs had a depolarized maximum diastolic potential (-65±2.9 mV; n=3; p=0.0381) compared with eGFP–transduced NRVMs (-73.2±0.3 mV; n=3). The dV/dtmax for APs of Kir2.1-overexpressed NRVMs was significantly higher (260±27 V/s; n=3; p=0.001) and that of Kir2.1-suppressed NRVMs was significantly lower (23.5±9 V/s; n=3; p=0.003) when compared with control NRVMs (123±18 V/s; n=3; Figure 2F).
Figure 2.
Altered single-cell electrophysiological properties of Kir2.1-transduced NRVMs. Average IK1 density for eGFP-transduced (A), Kir2.1-transduced (B), and Kir2.1AAA-transduced NRVMs (C) determined with square, 800 ms long, test pulses from -100 to +60 mV, applied from a holding potential of 0 mV, at 10 mV increments. (D) I-V relationship for each group determined with square test pulses from -100 to +60 mV with the magnified outward component of IK1 shown in the bottom right corner. RMPs (E) and maximum upstroke velocity of APs (F) recorded for each group.
Characterization of tissue electrophysiological properties of Kir2.1-transduced monolayers
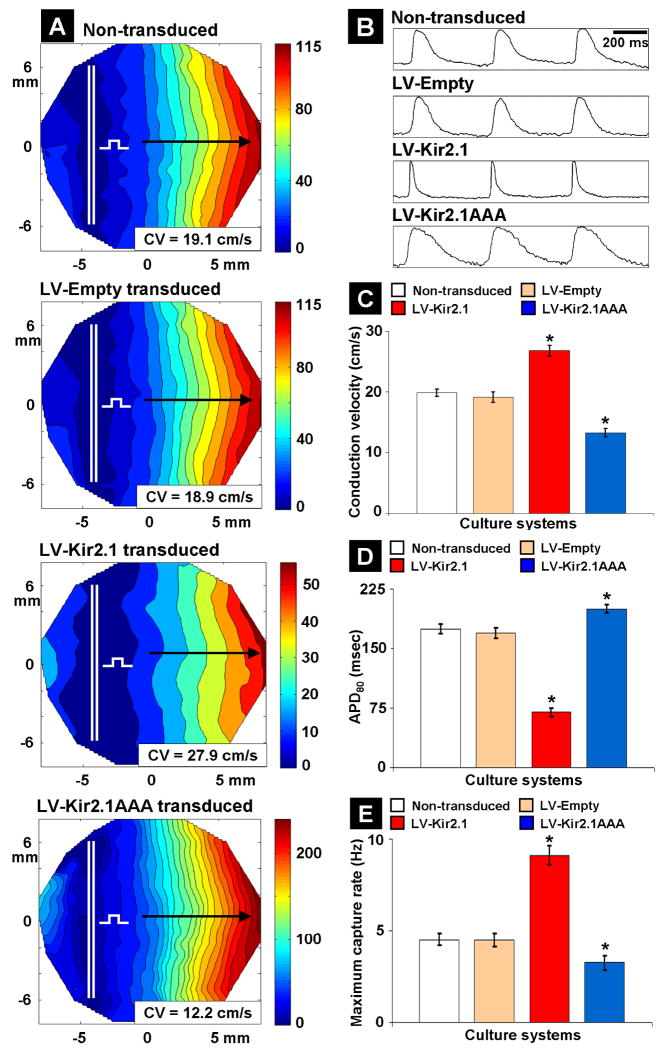
The tissue electrophysiological properties of uniformly Kir2.1 gene-modified monolayers significantly differed from those of non-transduced and LV-Empty transduced monolayers. Representative isochrone maps for impulse propagation at 2 Hz pacing rate (Figure 3A) showed that APs propagated through non-transduced and LV-Empty transduced monolayers with similar CV values of 19.1±0.5 cm/sec (n=7) and 18.9±0.7 cm/sec (n=7; p=0.07 compared with non-transduced control), respectively. However, APs propagated with increased CV (27.9±1.1 cm/sec; n=7; p=2×10⁻⁵ compared with non-transduced control) in Kir2.1-overexpressed monolayers and decreased CV (12.2±0.7 cm/sec; n=7; p=5×10⁻⁶ compared with non-transduced control) in Kir2.1-suppressed monolayers. Our findings of CV in Kir2.1-modified NRVM monolayers are consistent with our previous study17 and with our findings of increased dV/dtmax with Kir2.1 overexpression (Figure 2F). The suggestion of increased sodium channel availability and enhanced excitability with IK1 up-regulation has also been previously reported.13 AP waveforms obtained from mapping (Figure 3B) showed normal APD80 values in non-transduced (174±6 ms; n=7) and LV-Empty transduced (169±7 ms; n=7; p=0.27 compared with non-transduced control) monolayers, significantly abbreviated APD80 values in LV-Kir2.1 transduced monolayers (70±5 ms; n=7; p=9×10⁻⁷ compared with non-transduced control) and significantly prolonged APD80 values in LV-Kir2.1AAA transduced monolayers (200±9 ms; n=7; p=2.8×10⁻⁴ compared with non-transduced control). Our findings of APD80 changes in Kir2.1-modified NRVM monolayers are consistent with previous findings20 and confirm that IK1 regulates the duration of the ventricular AP. Average CV and APD80 values for each group are summarized in Figures 3C and 3D. The average normalized upstroke velocity of propagating APs at a 2 Hz pacing rate in LV-Empty transduced, Kir2.1-overexpressed, and Kir2.1-suppressed monolayers (n=7 each) were 3.23±0.42 (p=0.72), 5.36±0.43 (p=2.1×10⁻⁸), and 1.93±0.47 (p=2.4×10⁻⁷), respectively, when compared with that of non-transduced monolayers (3.11±0.62; n=7). Finally, in non-transduced and LV-Empty transduced monolayers, successful 1:1 capture occurred up to a pacing rate of 4.5±0.3 Hz (n=7), while Kir2.1-overexpressed and Kir2.1-suppressed monolayers had a MCR of 9±0.5 Hz (n=7) and 3±0.3 Hz (n=7), respectively (Figure 3E). Importantly, reentry could not be induced in non-transduced and uniformly transduced monolayers even at a very high pacing rate (for example, 9 Hz for Kir2.1-overexpressed monolayers).
Figure 3.
Altered tissue electrophysiological properties of Kir2.1-transduced NRVM monolayers. (A) Representative isochrone maps for AP propagation in non-transduced, LV-Empty transduced, Kir2.1-overexpressed and Kir2.1-suppressed monolayers. The monolayers and mapping region are 21 mm and 17 mm in diameter, respectively. Selected paths of wavefront propagation along which CV values were calculated are shown by black arrows, and the bipolar line electrode is indicated by double white line with a square test pulse symbol. (B) Representative AP waveforms for each monolayer. Bar graph summarizing the average CV (C), APD80 (D) and MCR (E) for different monolayers (n=7 each) that were studied. * indicates significant difference when compared with non-transduced NRVMs.
Development of an in vitro tissue model of NRVMs with heterogeneous IK1 expression
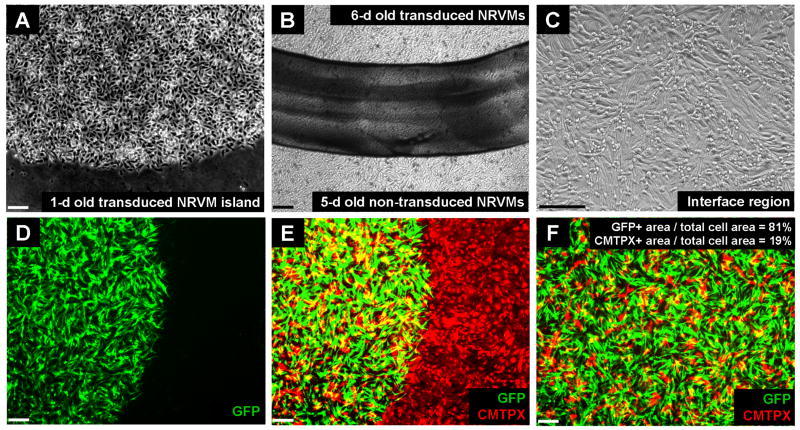
Transduced NRVMs from a first day of cell isolation were spatially localized within a clear boundary defined by the stenciling technique (Figure 4A). Non-transduced NRVMs from a successive day of cell isolation were added to the whole coverslip and grown under normal culture conditions for an additional 5-day period (total of 6 days for original NRVMs) to develop an in vitro model of cardiac myocytes with a spatially-localized functional heterogeneity (Figure 4B). Over a prolonged culture period of 6 days and beyond, non-transduced and transduced NRVMs microscopically coupled well without any discernible structural heterogeneities (Figure 4C). To assess the percentage of non-transduced NRVMs in the transduced central region, we transduced NRVMs from the first day of isolation with LV-eGFP and labeled non-transduced NRVMs from the second day of isolation with CellTracker Red CMTPX. Fluorescent images of the interface region showed that eGFP-transduced NRVMs were sharply confined within the circular boundary initially set by the stenciling procedure (Figure 4D). The non-transduced NRVMs attached to the outside of the gene-modified region and formed a monolayer, although some could be found in the transduced region. Collectively, the green and red-channel images of the interface region confirmed the ability of the stenciling technique to create a confluent monolayer of non-transduced NRVMs with a central region of transduced heterogeneity (Figure 4E). Images from inside the gene-modified region (Figure 4F) showed that the central island consisted mostly of transduced NRVMs (80.9±1.8% of cell-covered area as measured from 3 monolayers with one field of view per monolayer).
Figure 4.
Microscopic images of monolayers with patterned and gene-modified NRVM islands. (A) One-day old transduced NRVMs localized in a 6 mm diameter circular island. (B) Confluent monolayer of 6-day old non-transduced NRVMs with a central island of transduced NRVMs. Island boundary is indicated by black ink line drawn on the back of the coverslip. (C) Magnified image of an interface region from (B) shows uniformity of cell arrangement and structural homogeneity. (D) Fluorescent image of a confluent monolayer containing a central island of eGFP-transduced NRVMs. (E) Merge of eGFP-transduced NRVM island and CMTPX-stained, non-transduced NRVMs. (F) Fluorescent image of a region from inside the central island indicates that the majority of the total cell area was occupied by transduced NRVMs. All scale bars, 50 μm.
Impulse propagation in monolayers with regions of Kir2.1 gene-modification
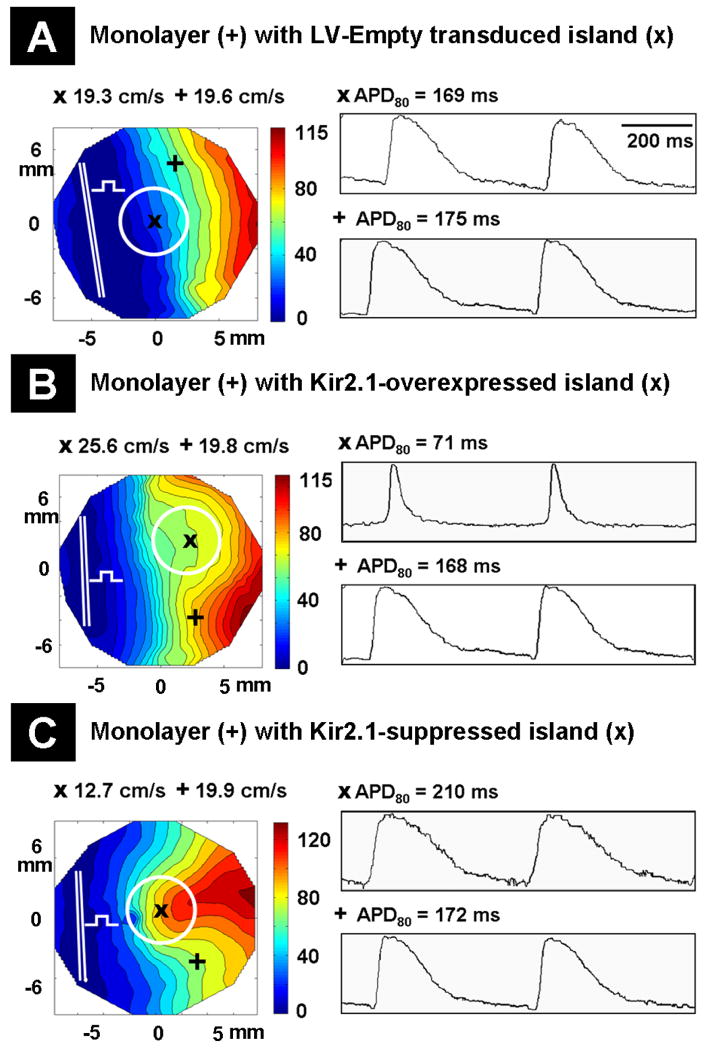
In monolayers with LV-Empty transduced islands, at 2 Hz pacing rate APs propagated through the islands with CV values similar to those of the rest of the monolayer (19.3±0.5 cm/sec in islands; n=9; p=0.32 and 19.6±0.4 cm/sec in the surrounding non-transduced region; n=9) as seen with an unperturbed linear wavefront in the direction of impulse propagation (Figure 5A, left column). As expected, APs propagated with increased CV (25.6±1.8 cm/sec; n=9; p=5.3×10⁻¹⁰ compared with 19.4±0.4 cm/sec in the non-transduced region; n=9) in Kir2.1-overexpressed islands and decreased CV (12.7±2.3 cm/sec; n=9; p=4.3×10⁻¹⁰ compared with 19.3±0.6 cm/sec in the non-transduced region; n=9) in Kir2.1-suppressed islands, as seen with the respective convex and concave curvature of the propagating wavefronts (Figure 5B and 5C, left column). Representative isopotential maps of AP propagation in monolayers with LV-Empty transduced or Kir2.1 gene-modified islands are shown in Online Figure III. In LV-Empty transduced islands, the APD80 values were similar to those of non-transduced regions (169±8 ms; n=9; p=0.12 and 175±8 ms; n=9, respectively). However, abbreviated APD80 (71±6 ms; n=9; p=6.6×10⁻¹⁴ compared with 168±7 ms in the non-transduced region; n=9) and prolonged APD80 (210±7 ms; n=9; p=4.1×10⁻⁶ compared with 172±4 ms in the non-transduced region; n=9) were seen in Kir2.1-overexpressed and Kir2.1-suppressed islands, respectively (Figure 5A-5C, right column). The CV and APD80 values of LV-Empty, Kir2.1-overexpressed, Kir2.1-suppressed and non-transduced regions were not statistically different (p>0.05 for all cases) to those observed for these groups in uniformly transduced monolayers.
Figure 5.
Impulse propagation in 21 mm diameter monolayers with LV-Empty transduced or Kir2.1 gene-modified NRVM islands. The mapping region is 17 mm in diameter. Isochrone maps for AP propagation (left column) in monolayers with LV-Empty transduced (A), Kir2.1-overexpressed (B) and Kir2.1-suppressed (C) NRVM islands. Representative sites in the transduced and non-transduced regions of the monolayer are indicated by “x” and “+” symbols, respectively. The bipolar line electrode is indicated by the double white line with a square test pulse symbol, and islands are shown by white circles. CV values corresponding to “x” and “+” regions of the monolayer are displayed above the isochrone map. (A-C, right column) Representative AP waveforms from the transduced (upper trace) and non-transduced (bottom trace) regions of the monolayer with their APD80 values displayed above.
Dynamics of induced reentrant spiral waves in monolayers with heterogeneous IK1 expression
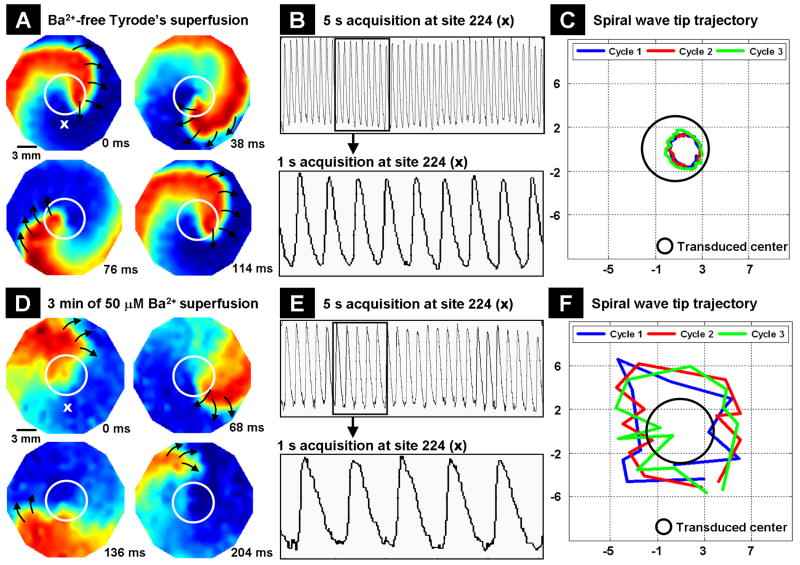
We next studied the dynamics of an induced spiral wave in monolayers with altered IK1. Rapid pacing failed to induce reentrant waves in monolayers with non-transduced and LV-Empty transduced NRVM islands (n=9 each). However, reentry was successfully initiated in the two groups of monolayers with islands of heterogeneous expression of IK1. But the dynamics of reentry varied greatly between the two groups. Reentrant waves were anchored to islands of Kir2.1 overexpression (Figure 6A), remained stable for a prolonged period of time (more than 2 h) and had a frequency of 9±1 Hz (n=9) as shown by the optical recordings from a representative recording site (Figure 6B). When the tip of the induced spiral wave was tracked over three successive cycles, it maintained an almost circular trajectory inside the region of Kir2.1 overexpression (Figure 6C). The reentrant wave propagated with a CV of 6.4±0.2 cm/sec (n=9) in the transduced region at a distance of 2 mm from the wave tip and a CV of 16.3±0.4 cm/sec (n=9) in the non-transduced region at a distance of 6 mm from the wave tip. After 1 minute of superfusion (includes wash-in time and time allowed for the concentration to equilibrate in the chamber) with Tyrode's solution containing 50 μM Ba2+, which selectively blocks IK1 currents, the frequency of reentry gradually decreased to 7±1 Hz (n=9). The stability of the spiral wave was also disturbed as reflected by a transition from a circular wavetip pattern to a meandering pattern of almost the same size. The previously measured reentry CVs in the transduced and non-transduced regions of the monolayer decreased to 5.1±0.2 cm/sec (n=9) and 14.1±0.5 cm/sec (n=9), respectively. The changes in the dynamics of the reentry after 1 minute of Ba2+ superfusion are summarized as Online Figure IV. After 3 minutes of Ba2+ superfusion, the stability of the reentry was heavily lost (Figure 6D), and the rotation frequency decreased further to 5±1 Hz (n=9; Figure 6E). The trajectory of the spiral wave tip also followed a meandering pattern much larger in size than before (Figure 6F). The reentry CV in the transduced and non-transduced regions decreased further to 3.2±0.2 cm/sec (n=9) and 11.7±0.2 cm/sec (n=9), respectively. Upon continued Ba2+ superfusion, the reentry terminated within the next 2-4 minutes.
Figure 6.
Dynamics of induced reentrant spiral waves in 21 mm diameter monolayers with a central island of Kir2.1 overexpression. The mapping region is 17 mm in diameter. (A) The induced spiral wave anchored to region of Kir2.1 overexpression (indicated by white circles) and was stable. Black arrows represent the direction of wavefront propagation. (B) The optical recording obtained over a 5 sec (upper panel) interval at site 224 is magnified to show the frequency of the reentry (bottom panel). (C) Trajectory of the tip of an induced spiral wave is shown over three successive cycles (blue, red and green traces) with respect to the region of Kir2.1 overexpression (black circle). The X- and Y- axes are position on monolayers in mm. (D) Unstable spiral wave after 3 min of Ba2+ superfusion. (E) Five sec and 1 sec acquisitions of the spiral wave shown in (D) from site 224. (F) Meandering pattern of the spiral wave tip trajectory after 3 min of Ba2+ superfusion.
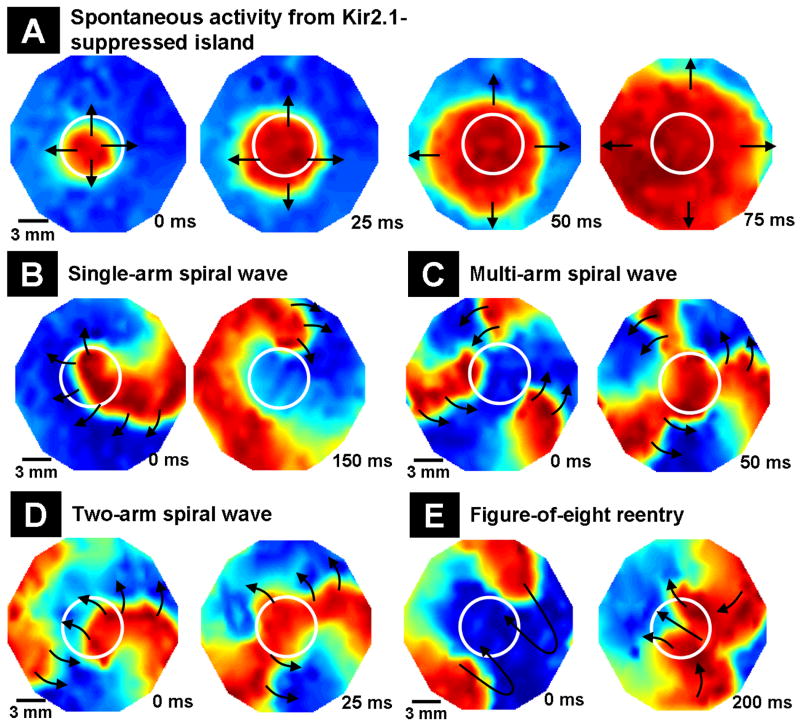
Similar to a previous report,19 dominant-negative suppression of Kir2.1 gave rise to spontaneous activity (6 of 9 monolayers). This activity emerged from inside the transduced region to the rest of the monolayer (Figure 7A) at a frequency of 1.5±0.5 Hz (n=6). Rapid pacing of monolayers with islands of Kir2.1-suppression successfully initiated reentrant waves (Figure 7B), which were not stable. The spiral wave moved around the island with a frequency of 3±1 Hz (n=9). Shortly after initiation (within 3-5 mins), it detached from the island and terminated (3 of 9 monolayers), transitioned into a sustained complex of coupled spiral waves (4 of 9 monolayers; Figure 7C), or transitioned into a two-armed spiral wave (2 of 9 monolayers; Figure 7D) that rearranged itself into a figure-of-eight reentry (Figure 7E), which drifted away from the island and terminated. Thus, Kir2.1-suppressed NRVM islands stabilized reentry, but with a lower frequency and shorter duration compared with Kir2.1-overexpressed NRVM islands.
Figure 7.
Dynamics of induced reentrant spiral waves in 21 mm diameter monolayers with a central island of Kir2.1 suppression. The mapping region is 17 mm in diameter. (A) Island of Kir2.1-suppressed NRVMs (indicated by white circles) acting as a source of spontaneous activity, as seen by the spread of spontaneous cardiac impulses (shown by black arrows) from an interior region of the island. (B) An induced spiral wave anchored momentarily to the region of IK1 suppression (shown by white circle). (C) Transition of initial spiral wave into a multi-armed spiral wave. (D) Transition of initial spiral wave into a two-armed spiral wave. (E) Transition of the two-armed spiral wave of (D) into a figure-of-eight reentry that later drifted to the edge of the monolayer and terminated.
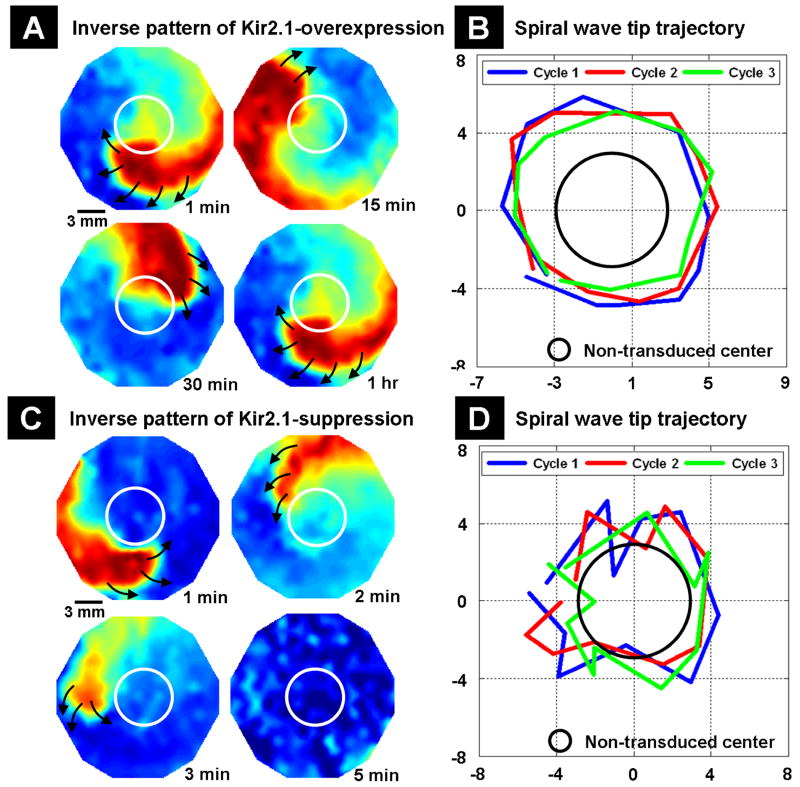
In a final set of experiments, monolayers with an inverse pattern of IK1 heterogeneity were developed with non-transduced NRVM islands in the center and Kir2.1 gene-modified NRVMs on the outside. Non-transduced NRVM islands with LV-Empty transduced NRVMs on the outside were used as controls. Although reentry could not be induced in control cultures, it was successfully initiated in monolayers with an inverse pattern of Kir2.1 overexpression or suppression. However, the dynamics of the reentry varied greatly between the two groups. With Kir2.1 overexpression, reentrant spiral waves were stable and persisted for more than 2 h (Figure 8A) and had a frequency of 7±0.5 Hz (n=9). The frequency of the reentry was slower than the 9±1 Hz seen in monolayers with central islands of Kir2.1 overexpression. The tip of the spiral wave followed an almost circular pattern in the region of Kir2.1 overexpression over the course of three successive cycles (Figure 8B). In an opposite fashion, with Kir2.1 suppression, the induced spiral wave was unstable and terminated within 5 minutes after initiation (Figure 8C). The reentry had a frequency of 3±0.5 Hz (n=9) similar to the 3±1 Hz seen in monolayers with central islands of Kir2.1 suppression, and its tip followed a meandering pattern (Figure 8D). Thus, in the case of inverse heterogeneity, altered IK1 expression also enhanced the genesis of spiral waves compared with uniformly transduced monolayers, with greater stability for IK1 overexpression compared with IK1 suppression.
Figure 8.
Dynamics of induced reentrant spiral waves in 21 mm diameter monolayers with inverse pattern of IK1 heterogeneity. The mapping region is 17 mm in diameter. (A) An induced spiral wave remained stable in the region of Kir2.1 overexpression for a prolonged period of time. The central non-transduced NRVM island is shown by the white circle. (B) The tip of the spiral wave followed an almost circular pattern in the region of Kir2.1 overexpression over the course of three successive cycles. The region of non-transduced NRVMs is shown with the black circle. The X- and Y- axes are position on monolayers in mm. (C) With Kir2.1 suppression, the induced spiral wave was unstable and terminated within 5 minutes after initiation. (D) The tip of the spiral wave followed a meandering pattern over the course of three successive cycles.
Thus, with heterogeneous Kir2.1 expression, spiral waves are consistently observed to be more stable with Kir2.1 overexpression than with Kir2.1 suppression, whether altered Kir2.1 expression occurs in the island or in the surrounding region (for the inverse pattern). These observations support the notion that decreased head-tail interaction secondary to shortened APD contributes to the stability of reentrant waves.
Discussion
Studies have previously suggested the importance of IK1 in VF dynamics by relating the stability of high-frequency rotors to the levels of outward component of IK1.12 Increased IK1 during atrial fibrillation at hyperpolarizing potentials is also considered to be an important factor for the maintenance of the arrhythmia.21 In transgenic animals, the role of IK1 upregulation in the frequency and stability of rotors have been studied.13 However, in such transgenic hearts, there was reported to be cell-to-cell variability in the expression of IK1,16 and the effects of such heterogeneities on arrhythmia dynamics are unknown. Hence, in the present study, using a combination of tissue engineering, somatic gene transfer, immunohistochemistry, Western blot, whole-cell patch clamp and optical voltage-mapping techniques, we developed a novel, in vitro model of cardiac tissue with a spatially-localized IK1 heterogeneity and characterized the electrophysiology and dynamics of reentrant spiral waves in this tissue model. In comparing such a tissue model against transgenic animals, there is the advantage (and disadvantage) of not having compensatory mechanisms coming into play for the gain or loss of function of proteins of interest. Our study demonstrates the capacity of IK1, when heterogeneously expressed, to initiate and maintain a high-frequency spiral wave in cultured NRVM monolayers. Hence, it may not be simply the increase in IK1 that contributes to increased stability of spiral waves13 but also the heterogeneity in IK1 expression and the subsequently large IK1 differences. The faster rotation rates and persistence of the rotor have been previously attributed to the increased outward component of IK1.5 Our study provides new insight on how spiral wave anchoring by IK1 can predispose the heart to fatal cardiac arrhythmias. Hence, altering Kir2.1 expression levels and modulating IK1 currents may lead to alternative and potentially effective antiarrhythmic approaches.
IK1 regulates excitability and electrophysiological properties of cardiac tissue
In this study, we demonstrated that overexpression of Kir2.1 significantly increased IK1 density, whereas dominant-negative suppression of Kir2.1 significantly decreased IK1. Also, upregulation of IK1 significantly hyperpolarized RMP, increased dV/dtmax and shortened duration of the AP. These findings are consistent with IK1's role in regulating sodium channel availability and excitability of cardiac tissue.13 As expected, suppression of IK1 significantly depolarized RMP, decreased dV/dtmax and prolonged duration of the AP, indicative of reduced channel availability.
The secondary effects of modulation of IK1 on cardiac electrophysiological tissue properties, namely APD and CV, were then characterized. We chose bipolar line stimulation because with flat excitation wavefronts, the effects of wavefront curvature on CV can be eliminated. Furthermore, the bipolar electrodes concentrate the stimulation current in the gap between the electrodes and hence avoid distant stimulation. In contrast, the convex excitation wavefronts produced by a point stimulus propagate slower than flat excitation wavefronts and facilitate the formation of reentrant waves.
We observed increased CV in monolayers with uniform Kir2.1 overexpression and decreased CV in monolayers with Kir2.1 suppression. Because CV depends on gap junction coupling and excitability, the absence of changes in Cx43 levels between non-transduced, LV-Empty transduced and Kir2.1 gene-modified monolayers together with the observed changes in dV/dtmax support the notion that CV changes following Kir2.1 gene-modification are mediated by associated changes in RMP and sodium channel availability. Another factor that may alter upstroke velocity and CV in the case of IK1 suppression is suppression or exaggeration of phase IV pacemaker depolarization as a consequence of altered outward currents in the threshold voltage range. As expected, Kir2.1 overexpression abbreviated APD80, whereas Kir2.1 suppression prolonged APD80. Similar to a previous report,20 IK1 suppression resulted in prolonged APD and spontaneous activity in islands of Kir2.1AAA-transduced NRVMs. In Kir2.1AAA-transduced monolayers, APD and thus the effective refractory period is significantly prolonged with a much shorter excitable gap, suggesting there could be incomplete recovery of the sodium channel at high stimulation rates, in addition to the reduction in sodium channel availability owing to the reduction of RMP.
IK1 regulates cardiac reentry dynamics
Sustained arrhythmias have been previously induced in cultured monolayers of NRVMs using a rapid pacing protocol that relies on preexisting heterogeneity in cellular or tissue properties (e.g., excitability, refractory period, or anisotropy) to cause the formation of a wave break. In this study, the uniformity of tissue properties was such that rapid pacing failed to induce stable reentry in non-transduced monolayers. Furthermore, rapid pacing failed to induce reentry in uniformly transduced monolayers and in monolayers with islands of non-transduced or LV-Empty transduced NRVMs. On the other hand, the presence of sharp CV and APD differences in monolayers with islands of Kir2.1 overexpression or suppression, or with the inverse patterns, promoted reentry initiation. Interestingly, while reentry could be induced at pacing rates of around 5 Hz in monolayers with islands of Kir2.1 overexpression, and at 5.6 Hz in monolayers with the inverse pattern, no reentry could be induced even at 9 Hz in monolayers with uniform overexpression of Kir2.1. Similarly, reentry could be induced in monolayers with heterogeneous but not uniform Kir2.1 suppression, although the reentrant waves were less stable than those observed with heterogeneous Kir2.1 overexpression. The findings of our study demonstrate that the uniform overexpression of Kir2.1 does not necessarily create a medium that is prone to reentry formation, and that it is IK1 heterogeneity that enhances the genesis of stable spiral waves. Following Ba2+ perfusion of monolayers containing islands of heterogeneous Kir2.1 expression, IK1 is blocked in both the transduced and non-transduced regions of the monolayer, lowering the level of IK1, abolishing IK1 heterogeneity, and transforming the monolayer into a homogeneous medium. Hence, the spiral wave meanders, loses stability, and eventually terminates by drifting off the edge of the monolayer.
In our study, both the differences and level of IK1 density seem sufficient to account for many aspects of VF dynamics. Nevertheless, we cannot discount the involvement of other outward currents in the manifestation of cardiac arrhythmias. Recently, increased IKs has been shown to enhance conduction block and wavebreak formation by means of postpolarization refractoriness.22 However, simulations have predicted that IK1 has a greater effect on rotor frequency than other potassium currents such as Iss, Ito and IKslow.13 Thus, IK1 is an important regulator of spiral wave frequency and stability because of its role in governing the excitation threshold as well as the terminal phase of repolarization.13
Our results from perturbations of IK1 in the central island indicate that changes in rotation rate of the spiral wave can occur from perturbations in IK1 expression solely near the spiral tip without changes in the arms of the spiral wave, unlike the case with transgenic animal experiments.13 Also, more stable spiral waves are consistently observed with Kir2.1 overexpression than with Kir2.1 suppression, whether altered Kir2.1 expression occurs in the island or in the surrounding region. In conclusion, our study provides new experimental evidence for the contribution of IK1 to cardiac arrhythmogenesis and emphasizes the potential importance of IK1 as an antiarrhythmic target.
Supplementary Material
Acknowledgments
We thank Peihong Dong and Seth Weinberg for their assistance with molecular biology and mapping data analysis, respectively.
Sources of Funding: This work was supported by American Heart Association Predoctoral Fellowship 0715212U (R.B.S.), National Institute of Heart, Lung, and Blood Grant PO-1 HL77180 (G.G.H., D.A. Kass, PI), Fondation Leducq (E.M.) and National Institutes of Health grant HL66239 (L.T.).
Footnotes
Disclosures: None.
References
- 1.Zipes DP, Wellens HJ. Sudden cardiac death. Circulation. 1998;(98):2334–2351. doi: 10.1161/01.cir.98.21.2334. [DOI] [PubMed] [Google Scholar]
- 2.Winfree AT. Suppressing Drosophila circadian rhythm with dim light. Science. 1974;183:970–972. doi: 10.1126/science.183.4128.970. [DOI] [PubMed] [Google Scholar]
- 3.Allessie MA, Bonke FI, Schopman FJ. Circus movement in rabbit atrial muscle as a mechanism of tachycardia. III. The “leading circle” concept: a new model of circus movement in cardiac tissue without the involvement of an anatomical obstacle. Circ Res. 1977;41:9–18. doi: 10.1161/01.res.41.1.9. [DOI] [PubMed] [Google Scholar]
- 4.Beaumont J, Davidenko N, Davidenko JM, Jalife J. Spiral waves in two-dimensional models of ventricular muscle: formation of a stationary core. Biophys J. 1998;75:1–14. doi: 10.1016/S0006-3495(98)77490-9. [DOI] [PMC free article] [PubMed] [Google Scholar]
- 5.Samie FH, Berenfeld O, Anumonwo J, Mironov SF, Udassi S, Beaumont J, Taffet S, Pertsov AM, Jalife J. Rectification of the background potassium current: a determinant of rotor dynamics in ventricular fibrillation. Circ Res. 2001;89:1216–1223. doi: 10.1161/hh2401.100818. [DOI] [PubMed] [Google Scholar]
- 6.Starmer CF, Romashko DN, Reddy RS, Zilberter YI, Starobin J, Grant AO, Krinsky VI. Proarrhythmic response to potassium channel blockade. Numerical studies of polymorphic tachyarrhythmias. Circulation. 1995;92:595–605. doi: 10.1161/01.cir.92.3.595. [DOI] [PubMed] [Google Scholar]
- 7.Ten Tusscher KHWJ, Panfilov AV. Reentry in heterogeneous cardiac tissue described by the Luo-Rudy ventricular action potential model. Am J Physiol Heart Circ Physiol. 2003;284:542–548. doi: 10.1152/ajpheart.00608.2002. [DOI] [PubMed] [Google Scholar]
- 8.Jalife J. Ventricular fibrillation: mechanisms of initiation and maintenance. Annu Rev Physiol. 2000;62:25–50. doi: 10.1146/annurev.physiol.62.1.25. [DOI] [PubMed] [Google Scholar]
- 9.Krinsky VI. Spread of excitation in an inhomogeneous medium (state similar to cardiac fibrillation) Biophysics. 1966;11:776–784. [Google Scholar]
- 10.Dhamoon AS, Jalife J. The inward rectifier current (IK1) controls cardiac excitability and is involved in arrhythmogenesis. Heart Rhythm. 2005;2:316–324. doi: 10.1016/j.hrthm.2004.11.012. [DOI] [PubMed] [Google Scholar]
- 11.Piao L, Li J, McLerie M, Lopatin AN. Transgenic upregulation of IK1 in the mouse heart is proarrhythmic. Basic Res Cardiol. 2007;102:416–428. doi: 10.1007/s00395-007-0659-y. [DOI] [PubMed] [Google Scholar]
- 12.Warren M, Guha PK, Berenfeld O, Zaitsev A, Anumonwo JM, Dhamoon AS, Bagwe S, Taffet SM, Jalife J. Blockade of the inward rectifying potassium current terminates ventricular fibrillation in the guinea pig heart. J Cardiovasc Electrophysiol. 2003;14:621–631. doi: 10.1046/j.1540-8167.2003.03006.x. [DOI] [PubMed] [Google Scholar]
- 13.Noujaim SF, Pandit SV, Berenfeld O, Vikstrom K, Cerrone M, Mironov S, Zugermayr M, Lopatin AN, Jalife J. Up-regulation of the inward rectifier K+ current (IK1) in the mouse heart accelerates and stabilizes rotors. J Physiol. 2007;578:315–326. doi: 10.1113/jphysiol.2006.121475. [DOI] [PMC free article] [PubMed] [Google Scholar]
- 14.Priori SG, Pandit SV, Rivolta I, Berenfeld O, Ronchetti E, Dhamoon A, Napolitano C, Anumonwo J, di Barletta MR, Gudapakkam S, Bosi G, Stramba-Badiale M, Jalife J. A novel form of short QT syndrome (SQT3) is caused by a mutation in the KCNJ2 gene. Circ Res. 2005;96:800–807. doi: 10.1161/01.RES.0000162101.76263.8c. [DOI] [PubMed] [Google Scholar]
- 15.Tristani-Firouzi M, Jensen JL, Donaldson MR, Sansone V, Meola G, Hahn A, Bendahhou S, Kwiecinski H, Fidzianska A, Plaster N, Fu YH, Ptacek LJ, Tawil R. Functional and clinical characterization of KCNJ2 mutations associated with LQT7 (Andersen syndrome) J Clin Invest. 2002;110:381–388. doi: 10.1172/JCI15183. [DOI] [PMC free article] [PubMed] [Google Scholar]
- 16.Li J, McLerie M, Lopatin AN. Transgenic upregulation of IK1 in the mouse heart leads to multiple abnormalities of cardiac excitability. Am J Physiol Heart Circ Physiol. 2004;287:2790–2802. doi: 10.1152/ajpheart.00114.2004. [DOI] [PubMed] [Google Scholar]
- 17.Sekar RB, Kizana E, Smith RR, Barth AS, Zhang Y, Marbán E, Tung L. Lentiviral vector-mediated expression of GFP or Kir2.1 alters the electrophysiology of neonatal rat ventricular myocytes without inducing cytotoxicity. Am J Physiol Heart Circ Physiol. 2007;293:2757–2770. doi: 10.1152/ajpheart.00477.2007. [DOI] [PubMed] [Google Scholar]
- 18.Folch A, Jo BH, Hurtado O, Beebe DJ, Toner M. Microfabricated elastomeric stencils for micropatterning cell cultures. J Biomed Mater Res. 2000;52:346–353. doi: 10.1002/1097-4636(200011)52:2<346::aid-jbm14>3.0.co;2-h. [DOI] [PubMed] [Google Scholar]
- 19.Miake J, Marbán E, Nuss HB. Biological pacemaker created by gene transfer. Nature. 2002;419:132–133. doi: 10.1038/419132b. [DOI] [PubMed] [Google Scholar]
- 20.Miake J, Marbán E, Nuss HB. Functional role of inward rectifier current in heart probed by Kir2.1 overexpression and dominant-negative suppression. J Clin Invest. 2003;111:1529–1536. doi: 10.1172/JCI17959. [DOI] [PMC free article] [PubMed] [Google Scholar]
- 21.Bosch RF, Zeng X, Grammer JB, Popovic K, Mewis C, Kühlkamp V. Ionic mechanisms of electrical remodeling in human atrial fibrillation. Cardiovasc Res. 1999;44:121–131. doi: 10.1016/s0008-6363(99)00178-9. [DOI] [PubMed] [Google Scholar]
- 22.Muñoz V, Grzeda KR, Desplantez T, Pandit SV, Mironov S, Taffet SM, Rohr S, Kléber AG, Jalife J. Adenoviral expression of IKs contributes to wavebreak and fibrillatory conduction in neonatal rat ventricular cardiomyocyte monolayers. Circ Res. 2007;101:475–483. doi: 10.1161/CIRCRESAHA.107.149617. [DOI] [PubMed] [Google Scholar]
Associated Data
This section collects any data citations, data availability statements, or supplementary materials included in this article.


