

Abstract
Discovery of tissue-specific biomarkers for human cancer is crucial for early diagnosis and molecular understanding of the disease. To overcome the limitations posed by the large dynamic concentration range and compositional complexity of tissue biomacromolecules, we applied heparin affinity fractionation for proteomic enrichment. Comparing the proteomes of five paired samples of normal lung and pulmonary adenocarcinoma tissue by 2-D difference gel electrophoresis, 14 spots were found to be differentially expressed. From these candidate spots, three proteins overexpressed in cancer were identified by mass spectrometry as transgelin (TAGLN, SM22-α, WS3-10), transgelin-2 (TAGLN2), and cyclophilin A (PPIA). Quantitative RT-PCR indicated that both TAGLN2 and PPIA were upregulated at transcriptional level. Differential protein expression levels were validated by Western blot analysis using an independent set of 10 paired lung adenocarcinoma samples. Using immunohistochemistry on human tissue sections, we discovered that overexpression of TAGLN was strictly localized to the tumor-induced reactive myofibroblastic stromal tissue compartment, whereas overexpression of TAGLN2 was exclusively localized to the neoplastic glandular compartment. Thus, the highly homologous protein pair TAGLN and TAGLN2 displayed mutually exclusive, compartment-specific cell type expression regulation in tumor stroma vs. neoplastic epithelial cells. Our data further suggest that TGLN may be a marker of active stromal remodeling in the vicinity of invasive carcinomas. It may shed light on mechanisms of tumor-stroma interaction and could be useful for early diagnosis, treatment guidance, and treatment response monitoring.
Keywords: Lung cancer, tissue proteomics, heparin affinity enrichment, tandem mass spectrometry, TAGLN, TAGLN2, PPIA
INTRODUCTION
Lung cancer is the leading cause of cancer deaths in the Western World, accounting for more deaths than breast, prostate, and colorectal cancers combined. Adenocarcinoma is the most common type of lung cancer, accounting for 30–40% of all cases (1). The prognosis for lung cancer is poor, with an overall five-year survival rate of approximately 16%, and only the most localized carcinomas can be treated with any hope for long-term cure. Early detection of lung cancer is, therefore, of utmost importance. Yet, at early stages, lung cancer remains generally clinically asymptomatic and is, at best, incidentally discovered on routine radiologic imaging obtained for unrelated reasons. To date, only very few diagnostic or prognostic biomarkers have been proposed for clinical use (2). Discovery of new sensitive biomarkers for lung cancer is thus a significant task.
Cancer is a disease involving multiple tissue compartments, particularly the epithelial, bona fide neoplastic tumor cells and their surrounding reactive stroma. The stroma, composed of connective tissue, mesenchymal cells, blood vessels, muscle and nerve tissue, and many other components, is often thought to provide a favorable in vivo microenviroment that is pivotal for cancer initiation, growth, and propagation. Extracellular matrix elements, a defining feature of connective tissue, constitute a dynamic interface and can serve a variety of functions, such as providing support and anchorage for cells, regulating cell-cell communication, sequestering cellular growth factors and other effector molecules, or establishing a molecular platform for signaling (3). Cancer progression can ultimately be viewed as the dynamic molecular interplay within a tumor cell-stroma network. All components of this network need to engage in regulated reciprocal dialogues to promote propagation of malignancy. Discovery of molecules that are integral to either the malignant cells or their surrounding stroma may advance our understanding of the biology of a neoplastic milieu and yield novel biomakers and targets for anticancer therapies.
We have been focusing on identifying glycosaminoglycan (GAG)-interacting proteins as potential cancer markers (4). GAGs are a major component of extracellular matrix and cancer stroma. GAGs are highly anionic polysaccharides, consisting of repeating disaccharides formed by N-acetylhexosamine and hexose or hexuronic acid. GAGs and their interacting proteins play numerous important roles in cancer (5, 6). The architecture of tumor-associated stroma is known to be fundamentally different from that of preexisting normal stroma (3). We hypothesized that GAG-binding proteins may be quantitatively or qualitatively altered in cancer tissue, providing a starting point for discovery of new markers and for understanding basic molecular and cellular mechanisms of oncogenesis (4). In this study, we used heparin affinity fractionation to enrich for GAG-binding proteins from human lung adenocarcinoma tissue.
MATERIALS AND METHODS
Clinical tissue specimen collection
Matched pairs of human lung carcinoma and adjacent normal lung parenchyma were collected at the Department of Pathology, Massachusetts General Hospital (Boston, MA). The study was conducted according to human subject research guidelines including Institutional Review Board approval. Fresh tissue samples were dissected in the Frozen Section Laboratory immediately after surgical removal of the specimen from the patient and carefully snap-frozen in liquid nitrogen. The frozen samples were stored at −80 °C until further analysis. Routine diagnostic tissue was fixed in formalin and embedded in paraffin. Estimation of tumor heterogeneity was based on microscopic analysis of a tissue sample taken immediately adjacent to the fresh-frozen specimen. The specimen for microscopic evaluation was fixed in formalin, embedded in paraffin, sectioned, and stained with hematoxylin and eosin. All histology was examined and quantified by an experienced anatomic pathologist at Massachusetts General Hospital. Based on histological evaluation, the fraction of neoplastic tumor cells per unit volume of sample tissue was estimated to be ~70% (with the remainder comprising primarily stroma and small blood vessels) and samples were chosen to be comparable in terms of tumor content and overall histological appearance. A summary of the adenocarcinoma samples is shown in Table 1.
Table 1.
Clinical data of the lung adenocarcinoma samples included in this study (LA1-5, discovery set; LA6-17, validation set).
| Patient | Gender | Age | Tumor Stage | DIGE | RT-PCR | WB | IHC |
|---|---|---|---|---|---|---|---|
| LA1 | M | 70 | pT1N0 | X | |||
| LA2 | M | 77 | pT2N2 | X | |||
| LA3 | M | 52 | pT1N1 | X | |||
| LA4 | F | 80 | pT1N0 | X | |||
| LA5 | M | 78 | pT3N2 | X | |||
| LA6 | F | 71 | pT1N2 | X | X | ||
| LA7 | M | 51 | pT2N0 | X | X | ||
| LA8 | F | 75 | pT2N0 | X | |||
| LA9 | M | 65 | pT2N0 | X | |||
| LA10 | F | 81 | pT1N0 | X | X | X | |
| LA11 | F | 51 | pT2N1 | X | X | X | |
| LA12 | F | 85 | pT1N0 | X | X | ||
| LA13 | F | 62 | pT3N1 | X | X | ||
| LA14 | M | 86 | pT2N0 | X | X | X | |
| LA15 | F | 87 | pT2N0 | X | X | ||
| LA16 | F | 64 | pT1N0 | X | |||
| LA17 | F | 60 | pT2N0 | X |
Pathologic/clinical tumor stage according to the pTNM/cTNM staging system (27). All neoplasms showed predominantly moderate histopathologic differentiation (G2) and acinar growth pattern. At time of surgery, none of the patients had clinically known distant metastatic disease (cM0). All surgical procedures were microscopically complete (R0). Samples examined by 2-D DIGE, Western blot (WB), RT-PCT, or immunohistochemistry (IHC) are indicated by “X” in the respective column.
Protein extraction
Samples of 100–200 mg of tissue were immersed at a concentration of 200 mg/ml in a protein extraction solution containing 50 mM sodium phosphate buffer (pH 7.4) and Roche Complete Mini Protease Inhibitor Cocktail (Roche Applied Science, Indianapolis, IN). Tissue samples were homogenized on ice with a motor-driven tissue homogenizer, followed by sonication on ice 10 times for 10 s each. The homogenates were centrifuged at 14,000 rpm in a benchtop centrifuge at 4 °C for 30 min, and the supernatants were filtered through 0.45-μm syringe filters. The filtrates (total soluble proteins) were used for subsequent heparin affinity chromatography and 2-D DIGE analysis. Protein concentrations were measured with the Bradford method using the Bio-Rad Protein Assay Kit (Bio-Rad, Hercules, CA). All samples were stored at −80 °C until analysis.
Heparin affinity chromatography
Soluble protein extracts (cancerous and normal lung tissue) from patients LA1-5 (Table 1) were fractionated on 5-ml HiTrap Heparin HP columns (GE Healthcare, Piscataway, NJ) using a GradiFrac system (GE Healthcare) as described (4). Typically, 12-mg protein samples were diluted with 50 ml of 10 mM sodium phosphate buffer at pH 7.4 (buffer A) and loaded onto the heparin column at a rate of 2 ml/min. Non-binding proteins were eluted with 75 ml of buffer A containing 20 mM NaCl. Weakly and strongly heparin-binding proteins were eluted with 75 ml of 200 mM NaCl and 50 ml of 1 M NaCl, respectively. As a result, four protein pools were obtained from each tissue sample, namely, total unfractionated extract (no heparin column), non-binding, weakly binding, and strongly binding. For 2-D DIGE analysis, specimens were concentrated to 200 μl each at 4 °C using 10-kDa cut-off Amicon centrifugal filters (Millipore, Bedford, MA).
For Western blot analysis, weakly heparin-binding fractions were obtained by batch purification. Heparin Sepharose (GE Healthcare) resin (0.2 ml) was equilibrated with buffer A containing 20 mM NaCl and mixed with tissue protein extract (1 mg tissue in 1 ml equilibration buffer) in a microcentrifuge tube. After 10 min, the sample-resin mixture was centrifuged at 3,000 rpm for 1 min. The supernatant was removed and 1 ml of equilibration buffer was added to the resin. The resuspended resin was centrifuged and the supernatant was removed. The resin was then mixed for 10 min with 1 ml of buffer A containing 200 mM NaCl. The resin was centrifuged and the supernatant containing eluted weakly heparin-binding proteins was saved. The buffer of the eluate was exchanged to buffer A using a 10-kDa cut-off Amicon centrifugal filter and concentrated to 30 μl for further experiments.
2-D DIGE
Protein samples were cleaned with the ReadyPrep 2-D Cleanup Kit (Bio-Rad) and resuspended in 28 μl of sample lysis buffer (30 mM Tris, 7 M urea, 2 M thiourea, 4% (w/v) CHAPS, pH 8.5). The pH of the protein solutions was adjusted to 8.5. Paired protein samples (200 μg each) were labeled on ice for 30 min in the dark with 1 μl of 400 μM amine-reactive fluorescent CyDye (GE Healthcare), e.g., Cy3 (green) for normal tissue extract and Cy5 (red) for cancerous tissue extract. The labeling reactions were stopped by incubation with 1 μl of 10 mM lysine for 10 min on ice in the dark. To the stopped reaction solution, 30 μl of sample buffer (8 M urea, 130 mM DTT, 4% (w/v) CHAPS, 2% (v/v) Bio-Lyte 3/10 ampholyte (Bio-Rad)) was added. Pairs of labeled samples were combined and the sample volume was adjusted to 185 μl with ReadyPrep Rehydration/Sample Buffer (Bio-Rad). The samples were mixed with 4 μl of 2-D SDS-PAGE Standard (Bio-Rad) and separated by 2-D gel electrophoresis using 11-cm IPG strips (pH 3–10; Bio-Rad) and 8–16% (m/v) gradient polyacrylamide Tris-HCl gels (Bio-Rad) as previously described (4). Gel images were obtained on a Typhoon 9410 scanner (GE Healthcare). Image analysis was performed with PD Quest 7.4.0 software (Bio-Rad). The intensity of each spot on a gel was normalized with respect to the total integrated optical fluorescence for that gel at the respective excitation wavelength. The relative quantity of protein in a given spot was calculated as parts per million (ppm) of the total integrated optical fluorescence. The gel analysis was carried out in match set mode. One master gel was selected by the software to match spots in all the gels. The assigned spots in each gel were manually checked for accuracy. When necessary, the spot assignment was improved by manual landmark spot selection. For weakly heparin-binding samples, 12 gel images were used (10 gel images from 5 pairs of heparin-fractionated samples and 1 pair from an unfractionated sample). Pairwise normal and cancer comparisons were performed for each patient to identify quantitative spot intensity changes (either >2-fold intensity decrease or >2-fold increase in cancer). Qualitative changes (>8-fold change over background intensity) were also included. A Boolean test was then performed to select spots that changed consistently in ≥3 of 5 sample pairs. Next, the selected spots were compared with the unfractionated sample pair in the same match set. If a differential expression pattern was also detected in the unfractionated sample pair, a spot was excluded (to preferentially enrich for low-abundance biomarkers only visible after heparin affinity fractionation). Finally, among the differentially expressed protein spots, only those with >95% statistically significant changes were chosen (Student’s t-test). An analogous match set analysis was carried out for strongly heparin-binding proteins.
Protein sequencing by LC-MS/MS
Protein spots showing differential expression in cancer tissue by 2-D DIGE image analysis were selected for sequencing based on favorable positional separation on 2-D gels. Selected protein spots were manually excised from gels post-stained with Sypro Ruby dye (Bio-Rad) and cut into approximately 1-mm3 pieces. Gel pieces were then subjected to in-gel trypsin digestion as described (4, 7). Tryptic peptides were extracted from gel pieces with 50 mM NH4HCO3 solution and dried in a SpeedVac. Peptides were separated by HPLC with a nanoscale reverse phase C18 capillary column as described (4, 8). Eluting peptides were subjected to electrospray ionization and analyzed in an LTQ linear ion trap mass spectrometer (Thermo Fisher Scientific). Peak lists were generated with ExtractMS version 2 (rev. 11) (Thermo Fisher Scientific) using default parameters. Peptide sequences (and thus protein identities) were determined by matching the complete NCBI Human Protein Database (downloaded on 12/01/2006 from http://www.ncbi.nlm.nih.gov) without further restrictions containing 269,363 protein entries with the measured fragmentation pattern using the software program Sequest version 27 (rev. 12) (Thermo Fisher Scientific). For initial database searching and calculation of database match statistics, no enzyme cleavage specificity was considered to check independently whether database matches were indeed consistent with tryptic peptides. Cysteine S-carboxymethylation and methionine oxidation to methionine sulfoxide were accounted for as fixed and variable modifications, respectively. Mass tolerances for precursor and fragment ions were set to 2 and 1 Da, respectively. For acceptance of individual MS/MS spectra, peptides were required to be fully tryptic peptides with XCorr values of at least 1.5 (1+ ion), 2.5 (2+ ion), and 3.0 (3+ ion), respectively (4). All data were manually inspected by an experienced mass spectrometrist, and only proteins with multiple peptide matches were considered confidently identified. When relevant, different isoforms or individual members of a protein family were identified based on the presence of peptide fragments unique to a particular isoform or family member.
Quantitative RT-PCR
Frozen tissue (30 mg) was submerged at −20 °C in 300 μl of pre-chilled RNAlater-ICE (Applied Biosystems/Ambion, Austin, TX) overnight and homogenized on ice in 300 μl of TRIZOL reagent (Invitrogen, Carlsbad, CA). The homogenate was processed with chloroform, isopropanol, and ethanol. Extracted RNA was redissolved in 81 μl of DEPC-treated water and purified on an RNeasy column (QIAGEN, Valencia, CA). Samples were treated with on-column DNase I (QIAGEN) during the purification. Purified RNA was quantified by UV absorbance at 260 and 280 nm, and the quality of total RNA was analyzed using a denaturing 1% (m/v) agarose gel. Non-degraded total RNA was used for further cDNA synthesis and RT-PCR. First-strand cDNA was synthesized with SuperScript III Reverse Transcriptase (Invitrogen), followed by RNase H treatment. Specific gene fragments of interest were amplified in 25 μl reactions using 150 ng cDNA template and Platinum PCR SuperMix (Invitrogen). The number of PCR cycles for each amplicon was empirically selected to fall within the exponential amplification range. Amplified DNA fragments were examined in 2% (m/v) agarose gels and quantitatively analyzed using the Bio-Rad Quantity One software.
The RT-PCR primer sequences for TAGLN and TAGLN2 were designed de novo from their mRNA sequences. Primer sequences for PPIA were obtained from the Real Time PCR Primer and Probe Database (http://medgen.ugent.be/rtprimerdb/). The transcript for the human ribosomal protein L13A (RPL13A) was chosen as a reference control. Primer sequences for TAGLN (F, forward primer; R, reverse primer): JR33-F (5′-GATTCTGAGCAAGCTGGTGA-3′), JR34-R (5′-TCTGCTTGAAGACCATGGAG-3′). Primer sequences for TAGLN2: JR35-F (5′-ATCACCACCCAGTGCCGAAAG-3′), JR36-R (5′-CATGGTGGAGGCCTGGATCTT-3′). Primer sequences for PPIA: JR37-F (5′-CCCACCGTGTTCTTCGACAT-3′), JR38-R (5′-CCAGTGCTCAGAGCACGAAA-3′). Primer sequences RPL13A: RPL13A-F (5′-CCTGGAGGAGAAGAGGAAAGAGA-3′), RPL13A-R (5′-TTGAGGACCTCTGTGTATTTG TCAA-3′). The expected amplicon sizes for the TAGLN, TAGLN2, PPIA, and RPL13A primer sets are 92 bp, 156 bp, 116 bp, and 125 bp, respectively.
Western blotting
Unfractionated (30 μg) or weakly heparin-binding (10 μg) samples were separated on NuPAGE Novex 4–12% (m/v) Bis-Tris gels using MES running buffer and transferred to PVDF membranes as described (4). After blocking with 3% (m/v) BSA, the membranes were incubated with 0.15 μg/ml anti-TAGLN (mouse mAb clone 10H12; Leica Microsystems, Bannockburn, IL), 0.4 μg/ml anti-TAGLN2 (rabbit polyclonal Abs; ProteinTech, Chicago, IL), 0.5 μg/ml anti-PPIA (mouse mAb clone 1F4-1B5; Abnova, Taipei, Taiwan), or 0.4 μg/ml anti-β-actin (mouse mAb clone C4; Santa Cruz Biotechnology, Santa Cruz, CA) in blocking buffer for 1 h at 25 °C. Specific antibody reactions were detected with goat anti-mouse IgG conjugated with horseradish peroxidase (HRP) for TAGLN, PPIA, and β-actin detection or goat anti-rabbit IgG-HRP for TAGLN2 (Santa Cruz Biotechnology) and developed using ECL Western Blotting Substrate (Pierce, Rockford, IL). Bands were quantified using the Quantity One software (Bio-Rad). The calculated expression ratio (ER) between cancer and normal tissue was normalized with respect to β-actin expression levels for each pair of samples as ER = (IPC/IPN)/(IAC/IAN), where IPC and IPN denote the measured intensity integral of the specific protein band for cancer or normal tissue, respectively, and IAC and IAN denote the measured intensity integral of the β-actin band for cancer and normal tissue, respectively. Thus, ER>1, ER=1, or ER<1 characterize overexpression in cancer, no change of expression, or decreased expression in cancer, respectively.
Immunohistochemistry
5-μm microtome sections from formalin-fixed and paraffin-embedded tissue blocks were mounted onto poly-L-lysine-coated glass slides. Routine diagnostic slides were stained with hematoxylin and eosin. Specific proteins were detected by peroxidase-DAB (diaminobenzidine) chemistry using the NovoLink Polymer Detection System (Vision BioSystems, Norwell, MA) after microwave boiling in 5% (m/v) urea in Tris-buffered saline. The same primary antibodies as those for Western blotting were used at 0.3 μg/ml (anti-TAGLN), 1 μg/ml (anti-TAGLN2), and 20 μg/ml (anti-PPIA).
RESULTS
Differentially expressed proteins in pulmonary adenocarcinomas
To examine differentially expressed proteins in human lung adenocarcinoma, we first selected five patient samples for which relatively abundant normal and cancer tissue was available (LA1-5; Table 1). Soluble proteins were extracted from both normal and cancer tissues and fractionated by heparin affinity into not heparin-binding, weakly heparin-binding (eluted with 200 mM NaCl), and tightly heparin-binding fractions (eluted with 1 M NaCl). For normal tissue, the average protein recovery from 12 mg of total protein input for each of the three fractions was 55.2% (6.6 ± 2.7 mg), 14.0% (1.7 ± 0.9 mg), and 3.7% (0.4 ± 0.1 mg), respectively. The corresponding recovery from 12-mg samples of lung adenocarcinoma tissue was 42.4 % (5.1 ± 1.0 mg), 9.2% (1.1 ± 0.5 mg), and 10.0% (1.2 ± 0.6 mg), respectively. While the overall recovery of proteins from normal and cancer tissues was comparable (73% vs. 62%), there was a relative increase of tightly heparin-binding proteins in cancer with concomitant decreases of not heparin-binding or weakly heparin-binding proteins.
We carried out 2-D difference gel electrophoresis (DIGE) experiments to visualize and identify proteins that were differentially expressed in normal vs. tumor tissue. Paired matched protein samples from normal and lung adenocarcinoma tissue (200 μg each) were labeled with fluorescent Cy3 or Cy5 dye, respectively. Samples were mixed and separated in the same gel by 2-D gel electrophoresis. The relative abundance change of a protein was reflected by the specific Cy3/Cy5 fluorescence intensity ratio of its spot on the gel. Protein spots showing concordant >2-fold abundance changes (decrease or increase) in the tumor vs. normal tissue in at least 4 of 5 patients and with >95% statistical significance (Student’s t-test) were considered significant.
In the weakly heparin-binding fractions, 7 differentially expressed protein spots were identified (spots 1–7; Figures 1A and 1B). Comparison of the tightly heparin-binding fractions yielded an additional set of 7 differentially expressed protein spots (spots 8–14; Figures 1A and 1B). It is of note that differential expression of 13 of the 14 protein spots (93%) was only detectable in heparin affinity-enriched fractions, because low abundance precluded their identification in total unfractionated protein extracts (Figure 1A, left gel).
Figure 1. Differentially expressed proteins in human lung adenocarcinoma tissues.

(A) Representative 2-D Difference Gel Electrophoresis (DIGE) images from patient LA5. Protein extracts from normal lung parenchyma and lung adenocarcinoma were labeled with amine-reactive Cy3 (green) and Cy5 (red), respectively. Top left, top right, bottom left, and bottom right gel images depict total unfractionated protein extract, not heparin-binding fraction, weakly heparin-binding fraction, and strongly heparin-binding fraction, respectively. Numbers indicate 14 spots fulfilling the Boolean selection criteria (>2-fold change in at least 3 patients and >95% statistical significance of overall mean value difference). Note the increase of weak spots in heparin-binding fractions over unfractionated extracts, indicating the efficiency of low-abundance proteome enrichment by heparin fractionation. Importantly, 13 of the 14 differentially expressed spots (93%) remained entirely undetectable in unfractionated 2-D DIGE gels. (B) Heat map representation of protein expression level changes (spots 1–14). The columns correspond to patients LA1-5. Each cell is color-coded by fold increase (shades of red) or fold decrease (shades of blue) in cancer relative to matched normal parenchyma. Grey cells indicate that the spot intensities in normal and cancer specimens were approximately equal. When a specific protein spot was present exclusively in either normal or cancer tissue, it was represented as >8-fold decrease or >8-fold increase, respectively. (C) Bar graph representations of spot intensities for spots 1, 3, and 5. Blue and red bars denote normal lung and cancer tissue, respectively. Abscissae are labeled by patient number (LA1-5). The ordinate expresses the relative amount of protein in a given spot as parts per million (PPM) of the total integrated gel fluorescence at the respective excitation wavelength. (D) Detail views of spots 1, 3, and 5 for all 5 matched sample pairs (LA1-5; N, normal; C, cancer). Open arrowheads indicate the spot locations.
Six protein spots showing clear spatial separation from surrounding spots, sufficient intensity, and consistent spot shape and size were chosen for identification by MS/MS sequencing (spots 1–5 and 14). Three spots yielded unambiguous protein identities: Spot 5 was identified as transgelin-2 (TAGLN2), spot 3 as cyclophilin A (PPIA), and spot 1 contained peptide fragments matching both transgelin (TAGLN) and TAGLN2 (Table 2 and Supplementary Table 1). Alternative names for transgelin are SM22-α and WS3-10. Expression levels of these three protein spots were upregulated in cancer tissue of all 5 patients (Figures 1C and 1D). Spot 3 (PPIA) showed a mean increase in cancer of 2.9-fold, whereas spots 1 (TAGLN, TAGLN2) and 5 (TAGLN2) were increased by averages of at least 6.4-fold and 7.0-fold, respectively.
Table 2.
Differentially expressed proteins in lung adenocarcinomas identified by MS/MS (tandem) mass spectrometry.
| Spot | SIR | Expt. MW/pI | Theor. MW/pI | MS/MS Coverage | Identity | UniProtKB Entry |
|---|---|---|---|---|---|---|
| 1 | >6.4 | 20.0/6.35 | 22.5/8.88 | 130/200 (65.0%) | Transgelin (TAGLN) | Q01995 |
| 22.3/8.45 | 130/198 (65.7%) | Transgelin-2 (TAGLN2) | P37802 | |||
| 3 | 2.9 | 19.0/6.62 | 18.0/7.68 | 96/165 (58.2 %) | Cyclophilin A (PPIA) | P62937 |
| 5 | >7.0 | 23.5/7.28 | 22.3/8.45 | 131/198 (66.2 %) | Transgelin-2 (TAGLN2) | P37802 |
SIR, mean cancer to normal spot intensity ratio (>1.0, increased expression in cancer; 1.0, unchanged expression; <1.0, decreased expression in cancer). The spots were identified in the weakly heparin-binding fractions. Experimental and theoretical molecular weights (MW in kDa) and isoelectric points (pI) were determined from referenced 2-D gel spot positions and database sequence entries, respectively. Note that the theoretical values do not account for potential posttranslational modification. MS/MS coverage denotes the number of amino acids in positive peptide mass matches relative to the total number of amino acids of the mature protein. 15, 11, 10, and 13 distinct tryptic peptide fragment matches could be assigned for TAGLN (spot 1), TAGLN2 (spot 1), PPIA (spot 3), and TAGLN2 (spot 5), respectively. Both transgelin and transgelin-2 were detected in spot 1, whereas only transgelin-2 was detected in spot 5. Some samples of normal lung tissue did not show visualizable amounts of protein at spot locations 1 and 5. Based on the magnitude of signal-free gel background intensity, a cancer to normal spot intensity ratio of 8.0 (conservative lower limit estimate) was used in these cases for calculation of the mean SIR. Alternative names for transgelin are SM22-α and WS3-10.
Correlation with mRNA expression
To examine whether overexpression of TAGLN, TAGLN2, and PPIA proteins in lung adenocarcinomas was attributable to transcriptional regulation, we extracted RNA from 8 matched tissue pairs and carried out RT-PCR analysis (Figure 2). The mRNA expression of TAGLN2 was significantly upregulated in 6 of the 8 tested lung adenocarcinoma tissues, whereas no significant change was detected in one patient and a decrease was detected in another. Upregulation of PPIA mRNA expression was found in 5 of 8 tested patients, two patients did not show a significant difference, and one patient showed a decreased PPIA mRNA level in cancer tissue. For TAGLN, significant increases in mRNA expression were detected in only 2 patients. In contrast, decreased mRNA levels were detected in three patients. Although the individual trend is not consistent for every patient, the mean tumor-to-normal mRNA expression ratios of these 8 patients were greater than 1.0 for all three transcripts (TAGLN, 1.7; TAGLN2, 14.3; and PPIA, 3.9).
Figure 2. Quantitative RT-PCR analysis of TAGLN, TAGLN2, and PPIA mRNA abundance.

mRNA abundance of TAGLN, TAGLN2, and PPIA was compared between matched paired normal and lung adenocarcinoma tissues samples. The normalized expression ratios (cancer:normal) are shown relative to the internal control gene RPL13A (ribosomal protein L13A) transcript.
Western blot analysis of protein expression
To independently examine the differential expression of TAGLN, TAGLN2, and PPIA proteins, we conducted Western blot experiments with an additional set of 10 patient samples (LA6-15; Table 1) distinct from the cohort used for initial 2-D DIGE and mass spectrometric experiments. Since all three proteins had been identified in weakly heparin-binding fractions (Figure 1), extracts prepared from the additional patient samples were similarly enriched by heparin affinity purification (Figure 3, right column).
Figure 3. Western blot analysis of TAGLN, TAGLN2, and PPIA expression.

TAGLN (A), TAGLN2 (B), and PPIA (C) expression in unfractionated and weakly heparin-binding tissue protein extracts. The expression ratio of β-actin was used for normalization of each matched sample pair. TAGLN and TAGLN2 blots showed two or three specific bands and the sums of individual band intensities were used for comparisons (9, 10).
Unfractionated protein extracts from all patients were also examined for comparison (Figure 3, left column). In unfractionated and weakly heparin-binding extracts, TAGLN protein was increased in cancer tissue by overall mean factors of 1.3 (range, 0.3–2.8) and 2.1 (range, 0.4–11.5), respectively (Figure 3A). On individual level, however, TAGLN abundance was variable, with 5 of 10 patients (unfractionated) and 6 of 10 patients (weakly heparin-binding) showing overexpression in cancer.
TAGLN2 protein was increased in cancer tissue by overall mean factors of 2.3 (range, 0.1–5.9) and 6.4 (range, 0.8–24.8) in unfractionated and weakly heparin-binding extracts, respectively (Figure 3B). On individual basis, TAGLN2 abundance was increased in cancer tissue of 7 of 10 patients (unfractionated) and 8 of 10 patients (weakly heparin-binding).
PPIA protein was increased in cancer tissue by overall mean factors of 3.2 (range, 0.1–11.9) and 1.2 (range, 0.1–3.1) in unfractionated and weakly heparin-binding extracts, respectively (Figure 3C). On individual basis, PPIA abundance was increased in cancer tissue of 8 of 10 patients (unfractionated) and 6 of 9 patients (weakly heparin-binding).
Differential protein expression in tissue sections
Human pulmonary adenocarcinoma tissue is typically very heterogeneous at cellular level, containing besides malignant epithelial glands a variety of components, such as reactive stroma, benign pneumocytes, inflammatory cells, blood vessels, nerve tissue, muscle, or cartilage. Thus, some of the variabilities observed in the above experiments using homogenized tissue extracts may be due to underlying variations in sample tissue composition. To address this issue, we performed immunohistochemical experiments on tissue sections of normal lung and lung adenocarcinoma from patients LA10-14 to investigate which spatial compartments of heterogeneous tumor tissue displayed altered expression of TAGLN, TAGLN2, or PPIA proteins (Figure 4 and Supplementary Figures 1–4).
Figure 4. Immunohistochemical analysis of TAGLN, TAGLN2, and PPIA expression in pulmonary adenocarcinoma.
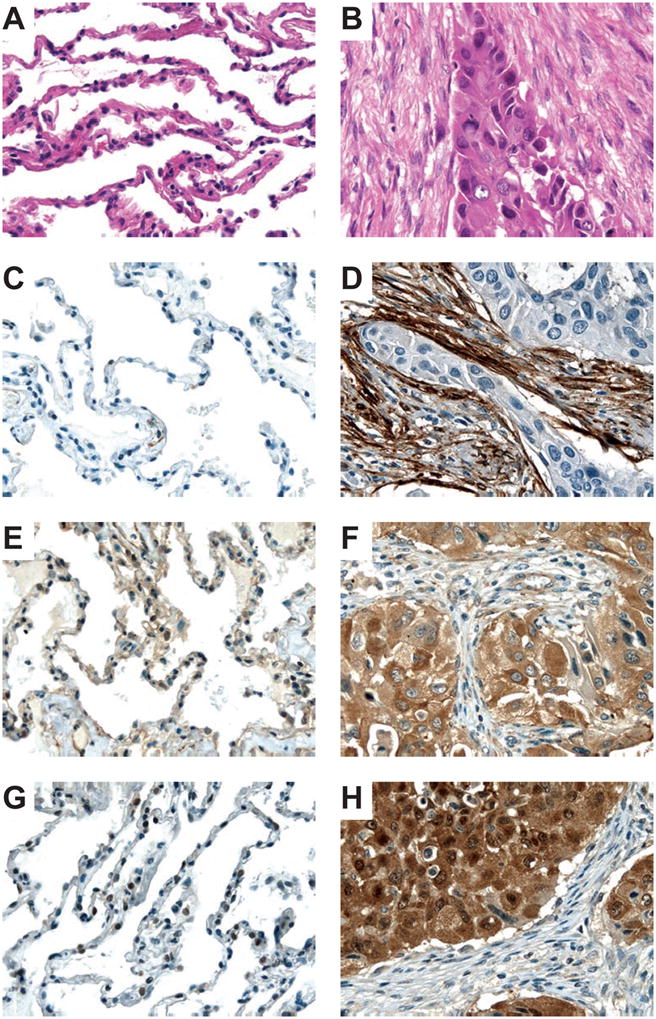
Photomicrographs of normal lung tissue (A) and lung adenocarcinoma (B) stained with hematoxylin-eosin. Protein expression of TAGLN (C, D), TAGLN2 (E, F), and PPIA (G, H) in lung tissue (left, normal; right, adenocarcinoma). Presence of the specific protein is indicated by the amount of brown staining. Nuclei were counterstained with hematoxylin (blue) for visualization purposes. The tissue shown is from patient LA13. Original magnifications: 400×.
TAGLN was strongly expressed in tumor-induced fibrous stroma compared to normal lung parenchyma or neoplastic glands where expression was low or undetectable (Figures 4C and 4D and Supplementary Figures 1–4). By contrast, TAGLN2 was very abundant in the neoplastic glands, while it was present at much lower concentrations in tumor stroma or normal lung
(Figures 4E and 4F and Supplementary Figures 1–4). Similarly, PPIA protein expression was elevated in pulmonary adenocarcinoma cells relative to tumor stroma or normal lung (Figures 4G and 4H and Supplementary Figures 1–4).
TAGLN2 expression in atypical adenomatous hyperplasia
Serendipitously, histologic tissue sections from one of the patients (LA11) revealed an isolated focus of premalignant atypical adenomatous hyperplasia (AAH) remote from the area affected by invasive carcinoma. Interestingly, TAGLN2 was increased in pneumocytes affected by AAH relative to normal epithelium (Figure 5), while no differences were detected for TAGLN or PPIA (not shown).
Figure 5. Immunohistochemical analysis TAGLN2 expression in atypical adenomatous hyperplasia (AAH).
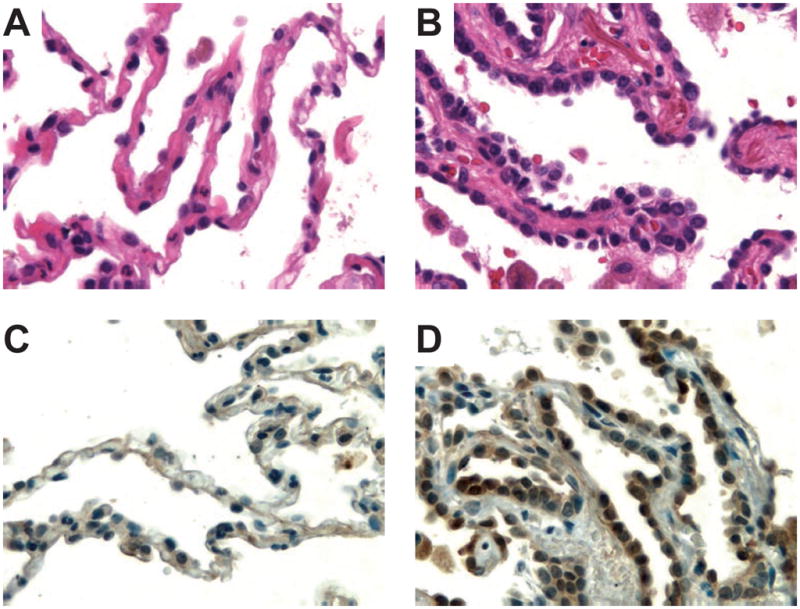
Photomicrographs of normal lung tissue (A) and a focus of AAH (B) stained with hematoxylin-eosin. Protein expression of TAGLN2 (C, D) in alveolar pneumocytes (left, normal; right, atypical adenomatous hyperplasia). Presence of the specific protein is indicated by the amount of brown staining. Nuclei were counterstained with hematoxylin (blue) for visualization purposes. Note the histopathologic features of AAH, such as slightly thickened alveolar walls and an increased number of alveolar lining cells with cytologic atypia. The tissue shown is from patient LA11. Original magnifications: 640×.
TAGLN expression in pulmonary squamous cell carcinomas
To test whether TAGLN may function as a more general marker of active stromal remodeling in the vicinity of invasive carcinoma, we investigated four cases of moderately differentiated pulmonary squamous cell carcinoma (Supplementary Figure 5). TAGLN expression was exclusively localized to tumor stroma (Supplementary Figures 5A and 5B) and markedly increased by Western blot analysis of tissue protein extracts in three of the four cases (Supplementary Figure 5C).
DISCUSSION
In this study, we extracted the total soluble tissue proteome and used heparin affinity fractionation enrichment (4). 2-D fluorescence difference gel electrophoresis (2-D DIGE) revealed 14 protein spots that were consistently differentially expressed between lung adenocarcinoma and normal tissue (Figure 1). Of note, 13 of these 14 spots (93%) were only detectable in heparin-enriched fractions, consistent with our previous observation that heparin affinity enrichment can enhance proteomic depth and the ability to interrogate low-abundance proteins that would otherwise evade discovery (4). We then focused on protein spots that showed good spot separation, consistent shape, and sufficient intensity for protein identification by tandem mass spectrometric (MS/MS) sequencing. We thus identified transgelin (TAGLN), transgelin-2 (TAGLN2), and cyclophilin A (PPIA) as tentatively differentially upregulated in human lung adenocarcinoma (Figure 1 and Table 2).
To test the validity of our finding, we then investigated an independent set of additional matched tissue pairs by quantitative RT-PCR (8 pairs; Table 1 and Figure 2) and Western blot analysis (10 pairs; Table 1 and Figure 3). TAGLN2 and PPIA mRNA levels were typically elevated in cancer tissue with mean 14.3-fold (range, 0.6–45.1) and 3.9-fold (range, 0.8–13.8) increases, respectively (Figure 2). While overall mean TAGLN mRNA abundance was also increased in cancer (1.7-fold), on individual patient basis, there was great variability and both increases and decreases were commonly observed (Figure 2). These findings suggest that there may be a positive correlation between protein and mRNA abundance for TAGLN2 and PPIA, while this may not hold true for TAGLN. Overexpression of TAGLN, TAGLN2, and PPIA was further investigated by Western blotting in 10 additional patient sample pairs distinct from the initial discovery set used for 2-D DIGE and mass spectrometric sequencing (Figure 3). Depending on whether unfractionated or weakly heparin-binding extracts were examined, 50–67% (TAGLN), 70–89% (TAGLN2), or 67–80% (PPIA) of cases showed increased expression in cancer vs. normal tissue. Importantly, qualitative comparisons of results without fractionation to those with heparin enrichment were predominantly concordant. Potential limitations of our study are a relatively small sample size and the fact that there is variability in gender composition of the subgroups analyzed by DIGE, Western blots, RT-PCR, and IHC, respectively. These and other possible contributors to sample heterogeneity will need to be addressed in future work.
It should be noted that the expression analysis of TAGLN is complicated by the fact that multiple bands were detected on the Western blots. Similar observations have been described and attributed to C-terminal proteolysis (9, 10). While the sum of band intensities was used for the analyses here, it is possible that TAGLN regulation is not a simple change in quantity of one defined species, but may, in fact, be subject to posttranslationally regulated events such as modification or degradation. TAGLN is an actin cross-linking/gelling protein that is involved in calcium interactions and regulates contractile properties. It may play a role in cell differentiation by stabilizing the cytoskeleton through actin binding (11, 12). Overexpression of TAGLN protein has been observed in carcinomas of the stomach, liver, and esophagus (13–15), while decreased levels of TAGLN mRNA have been observed in breast and colon cancer cell lines and primary tumors (16, 17). By immunohistochemical analysis of lung adenocarcinoma tissue sections, we found that TAGLN concentrations were markedly increased in tumor-induced myofibroblastic stroma surrounding the cancerous glands (Figure 4 and Supplementary Figures 1–4). This observation is consistent with the observation that TAGLN is normally expressed in fibroblasts and smooth muscle cells (18).
Alterations of TAGLN2 expression have, to the best of our knowledge, not previously been linked to pulmonary carcinomas. Our data now suggest that upregulation of TAGLN2 may occur in lung adenocarcinomas. While TAGLN2 and TAGLN differ in primary sequence length by only two amino acids and share 65% identity and 87% similarity in aligned primary sequence space, the precise cell biological functions of TAGLN2 remain currently unexplored. Interestingly, we found immunohistochemically that TAGLN2 expression was localized to epithelial elements with low expression in benign alveolar lining cells and high expression in neoplastic glands (Figure 4 and Supplementary Figures 1–4). Thus TAGLN (stromal origin) and TAGLN2 (epithelial origin) appear to constitute complementary expressional “mirror images” in lung adenocarcinoma (e.g., compare Figures 4D and 4F). Whether this observation bears functional significance will need to be addressed experimentally in the future. Additional spatial separation methods, such as tissue microdissection, could be used in combination with Western blotting to independently confirm the observed differences in TAGLN and TAGLN2 expression. The distinct immunohistochemical reactivity patterns (i.e., stromal vs. epithelial) of the anti-TAGLN and anti-TAGLN2 antibodies used in this study support good specificity and absence of cross-reactivity despite the sequence similarity.
By serendipity, we discovered that TAGLN2 expression was also increased in a focus of AAH present in a tissue block of one patient in our study (Figure 5). The lesion was distant from the patient’s invasive carcinoma and surrounded by morphologically normal lung parenchyma. AAH is considered to be an early, morphologically detectable, premalignant lesion in a pathogenetically continuous spectrum leading up to invasive pulmonary adenocarcinoma (19, 20). It is thus possible that increased synthesis of TAGLN2 parallels early steps of carcinogenesis, a hypothesis that will be interesting to study in more detail in the future.
The functional relationships between heparin and TAGLN or TAGLN2 are currently unknown but both protein sequences contain motifs similar to consensus heparin-binding sequences such as XBBXBX, XBBBXXBX, and TXXBXXTBXXXTBB (B: basic amino acid; X: hydrophobic residue; T: turn) (21). TAGLN possesses predicted heparin binding sites at 16KIEKK22 and 154KKAQEHKR161. TAGLN2 contains putative binding sites at 16KIEKQ22 and 153KKSKENPR160. Interestingly, the site 154KKAQEHKR161 of TAGLN has been characterized as an actin binding site (9). It is possible that the negative charges of actin and heparin play similar roles in the interaction.
Lastly, we found that PPIA (cyclophilin A) was also elevated in a majority of lung adenocarcinomas. This finding is consistent with previous reports of PPIA upregulation in lung, pancreatic, and colon cancers (22–24). Functionally, PPIA possesses peptidyl prolyl cis-trans isomerase activity that plays a role in protein folding and binds various immunosuppressive drugs such as cyclosporin A. Knock-down of PPIA in mice causes slowed growth, diminished fluorodeoxyglucose uptake, decreased proliferation, and increased apoptosis in cancer (25). Given that we identified PPIA in the heparin-binding fractions (Figure 1), it is interesting to point out that interactions between PPIA and heparin play a role in human immunodeficiency virus type-1 (HIV-1) infection (26). During HIV infection, host PPIA is incorporated into the HIV-1 viral membrane mediating viral attachment to target cells via direct interaction with heparan. Heparan derivatives such as heparin can competitively inhibit this interaction (26).
In sum, we describe TAGLN, TALGN2, and PPIA as three potential new protein biomarkers upregulated in pulmonary adenocarcinomas. The two homologs TAGLN and TAGLN2 showed striking, mutually exclusive overexpression localized either to tumor-induced stroma (TAGLN) or to invasive adenocarcinoma glands (TAGLN2), the functional significance of which awaits further experimental study. The discovery was made possible by using a heparin-based prefractionation approach for enhanced analysis of the low-abundance proteome of primary human surgical tissue specimens. The patient population examined in this study had tumors across a spectrum of stages from early to advanced (pT1, 7 patients; pT2, 8; pT3, 2; Table 1). It will thus be interesting to study in subsequent stage-controlled cohorts whether these biomarkers may be helpful for the early diagnosis of lung adenocarcinoma or the monitoring of treatment response and whether systemic abundance changes of these proteins can be detected outside the primary tumor tissue, e.g., in body fluids such as serum or urine.
In particular, TAGLN expression may be a more general biomarker of a proliferative stromal response to invasive carcinoma. This notion is supported by our observation that TAGLN is also overexpressed in the tumor stroma of pulmonary squamous cell carcinoma, another common aggressive histologic variant of lung cancer (Supplementary Figure 5). It is thus possible that intact TAGLN or its fragments (measured in tissue or biofluids such as serum or urine) could serve as an oncologic “fever thermometer” (i.e., sentinel diagnostic marker) for the presence of invasive malignant disease, analogous to the use of C-reactive protein (CRP) or the erythrocyte sedimentation rate (ESR) for the detection inflammatory states. Work along those lines is underway.
Supplementary Material
Acknowledgments
J.Y.W acknowledges R01 grant support from the NIAID/NIH. The authors thank the Taplin Biological Mass Spectrometry Center at Harvard Medical School for advice.
Footnotes
SUPPORTING INFORMATION AVAILABLE
This information is available free of charge via the Internet at http://pubs.acs.org.
References
- 1.Hoffman PC, Mauer AM, Vokes EE. Lung cancer. Lancet. 2000;355(9202):479–85. doi: 10.1016/S0140-6736(00)82038-3. [DOI] [PubMed] [Google Scholar]
- 2.Alaiya AA, Franzen B, Auer G, Linder S. Cancer proteomics: from identification of novel markers to creation of artifical learning models for tumor classification. Electrophoresis. 2000;21(6):1210–7. doi: 10.1002/(SICI)1522-2683(20000401)21:6<1210::AID-ELPS1210>3.0.CO;2-S. [DOI] [PubMed] [Google Scholar]
- 3.Tlsty TD, Coussens LM. Tumor stroma and regulation of cancer development. Annu Rev Pathol. 2006;1:119–50. doi: 10.1146/annurev.pathol.1.110304.100224. [DOI] [PubMed] [Google Scholar]
- 4.Rho JH, Qin S, Wang JY, Roehrl MH. Proteomic expression analysis of surgical human colorectal cancer tissues: up-regulation of PSB7, PRDX1, and SRP9 and hypoxic adaptation in cancer. J Proteome Res. 2008;7(7):2959–72. doi: 10.1021/pr8000892. [DOI] [PMC free article] [PubMed] [Google Scholar]
- 5.Wegrowski Y, Maquart FX. Involvement of stromal proteoglycans in tumour progression. Crit Rev Oncol Hematol. 2004;49(3):259–68. doi: 10.1016/j.critrevonc.2003.10.005. [DOI] [PubMed] [Google Scholar]
- 6.Tammi RH, Kultti A, Kosma VM, Pirinen R, Auvinen P, Tammi MI. Hyaluronan in human tumors: pathobiological and prognostic messages from cell-associated and stromal hyaluronan. Semin Cancer Biol. 2008;18(4):288–95. doi: 10.1016/j.semcancer.2008.03.005. [DOI] [PubMed] [Google Scholar]
- 7.Shevchenko A, Wilm M, Vorm O, Mann M. Mass spectrometric sequencing of proteins silver-stained polyacrylamide gels. Anal Chem. 1996;68(5):850–8. doi: 10.1021/ac950914h. [DOI] [PubMed] [Google Scholar]
- 8.Peng J, Gygi SP. Proteomics: the move to mixtures. J Mass Spectrom. 2001;36(10):1083–91. doi: 10.1002/jms.229. [DOI] [PubMed] [Google Scholar]
- 9.Fu Y, Liu HW, Forsythe SM, Kogut P, McConville JF, Halayko AJ, Camoretti-Mercado B, Solway J. Mutagenesis analysis of human SM22: characterization of actin binding. J Appl Physiol. 2000;89(5):1985–90. doi: 10.1152/jappl.2000.89.5.1985. [DOI] [PubMed] [Google Scholar]
- 10.Grigoriev VG, Thweatt R, Moerman EJ, Goldstein S. Expression of senescence-induced protein WS3-10 in vivo and in vitro. Exp Gerontol. 1996;31(1–2):145–57. doi: 10.1016/0531-5565(95)02015-2. [DOI] [PubMed] [Google Scholar]
- 11.Prinjha RK, Shapland CE, Hsuan JJ, Totty NF, Mason IJ, Lawson D. Cloning and sequencing of cDNAs encoding the actin cross-linking protein transgelin defines a new family of actin-associated proteins. Cell Motil Cytoskeleton. 1994;28(3):243–55. doi: 10.1002/cm.970280307. [DOI] [PubMed] [Google Scholar]
- 12.Shapland C, Hsuan JJ, Totty NF, Lawson D. Purification and properties of transgelin: a transformation and shape change sensitive actin-gelling protein. J Cell Biol. 1993;121(5):1065–73. doi: 10.1083/jcb.121.5.1065. [DOI] [PMC free article] [PubMed] [Google Scholar]
- 13.Ryu JW, Kim HJ, Lee YS, Myong NH, Hwang CH, Lee GS, Yom HC. The proteomics approach to find biomarkers in gastric cancer. J Korean Med Sci. 2003;18(4):505–9. doi: 10.3346/jkms.2003.18.4.505. [DOI] [PMC free article] [PubMed] [Google Scholar]
- 14.Shi YY, Wang HC, Yin YH, Sun WS, Li Y, Zhang CQ, Wang Y, Wang S, Chen WF. Identification and analysis of tumour-associated antigens in hepatocellular carcinoma. Br J Cancer. 2005;92(5):929–34. doi: 10.1038/sj.bjc.6602460. [DOI] [PMC free article] [PubMed] [Google Scholar]
- 15.Qi Y, Chiu JF, Wang L, Kwong DL, He QY. Comparative proteomic analysis of esophageal squamous cell carcinoma. Proteomics. 2005;5(11):2960–71. doi: 10.1002/pmic.200401175. [DOI] [PubMed] [Google Scholar]
- 16.Shields JM, Rogers-Graham K, Der CJ. Loss of transgelin in breast and colon tumors and in RIE-1 cells by Ras deregulation of gene expression through Raf-independent pathways. J Biol Chem. 2002;277(12):9790–9. doi: 10.1074/jbc.M110086200. [DOI] [PubMed] [Google Scholar]
- 17.Assinder SJ, Stanton JA, Prasad PD. Transgelin: An actin-binding protein and tumour suppressor. Int J Biochem Cell Biol. 2009;41(3):482–6. doi: 10.1016/j.biocel.2008.02.011. [DOI] [PubMed] [Google Scholar]
- 18.Lawson D, Harrison M, Shapland C. Fibroblast transgelin and smooth muscle SM22alpha are the same protein, the expression of which is down-regulated in many cell lines. Cell Motil Cytoskeleton. 1997;38(3):250–7. doi: 10.1002/(SICI)1097-0169(1997)38:3<250::AID-CM3>3.0.CO;2-9. [DOI] [PubMed] [Google Scholar]
- 19.Dacic S. Pulmonary preneoplasia. Arch Pathol Lab Med. 2008;132(7):1073–8. doi: 10.5858/2008-132-1073-PP. [DOI] [PubMed] [Google Scholar]
- 20.Wistuba II, Gazdar AF. Lung cancer preneoplasia. Annu Rev Pathol. 2006;1:331–48. doi: 10.1146/annurev.pathol.1.110304.100103. [DOI] [PubMed] [Google Scholar]
- 21.Hileman RE, Fromm JR, Weiler JM, Linhardt RJ. Glycosaminoglycan-protein interactions: definition of consensus sites in glycosaminoglycan binding proteins. Bioessays. 1998;20(2):156–67. doi: 10.1002/(SICI)1521-1878(199802)20:2<156::AID-BIES8>3.0.CO;2-R. [DOI] [PubMed] [Google Scholar]
- 22.Campa MJ, Wang MZ, Howard B, Fitzgerald MC, Patz EF., Jr Protein expression profiling identifies macrophage migration inhibitory factor and cyclophilin a as potential molecular targets in non-small cell lung cancer. Cancer Res. 2003;63(7):1652–6. [PubMed] [Google Scholar]
- 23.Li M, Wang H, Li F, Fisher WE, Chen C, Yao Q. Effect of cyclophilin A on gene expression in human pancreatic cancer cells. Am J Surg. 2005;190(5):739–45. doi: 10.1016/j.amjsurg.2005.07.013. [DOI] [PubMed] [Google Scholar]
- 24.Obama K, Kato T, Hasegawa S, Satoh S, Nakamura Y, Furukawa Y. Overexpression of peptidyl-prolyl isomerase-like 1 is associated with the growth of colon cancer cells. Clin Cancer Res. 2006;12(1):70–6. doi: 10.1158/1078-0432.CCR-05-0588. [DOI] [PubMed] [Google Scholar]
- 25.Howard BA, Furumai R, Campa MJ, Rabbani ZN, Vujaskovic Z, Wang XF, Patz EF., Jr Stable RNA interference-mediated suppression of cyclophilin A diminishes non-small-cell lung tumor growth in vivo. Cancer Res. 2005;65(19):8853–60. doi: 10.1158/0008-5472.CAN-05-1219. [DOI] [PubMed] [Google Scholar]
- 26.Saphire AC, Bobardt MD, Gallay PA. Host cyclophilin A mediates HIV-1 attachment to target cells via heparans. Embo J. 1999;18(23):6771–85. doi: 10.1093/emboj/18.23.6771. [DOI] [PMC free article] [PubMed] [Google Scholar]
- 27.Detterbeck FC, Boffa DJ, Tanoue LT. The new lung cancer staging system. Chest. 2009;136(1):260–71. doi: 10.1378/chest.08-0978. [DOI] [PubMed] [Google Scholar]
Associated Data
This section collects any data citations, data availability statements, or supplementary materials included in this article.