Abstract
AIM: To investigate whether nicotinamide overload plays a role in type 2 diabetes.
METHODS: Nicotinamide metabolic patterns of 14 diabetic and 14 non-diabetic subjects were compared using HPLC. Cumulative effects of nicotinamide and N1-methylnicotinamide on glucose metabolism, plasma H2O2 levels and tissue nicotinamide adenine dinucleotide (NAD) contents of adult Sprague-Dawley rats were observed. The role of human sweat glands and rat skin in nicotinamide metabolism was investigated using sauna and burn injury, respectively.
RESULTS: Diabetic subjects had significantly higher plasma N1-methylnicotinamide levels 5 h after a 100-mg nicotinamide load than the non-diabetic subjects (0.89 ± 0.13 μmol/L vs 0.6 ± 0.13 μmol/L, P < 0.001). Cumulative doses of nicotinamide (2 g/kg) significantly increased rat plasma N1-methylnicotinamide concentrations associated with severe insulin resistance, which was mimicked by N1-methylnicotinamide. Moreover, cumulative exposure to N1-methylnicotinamide (2 g/kg) markedly reduced rat muscle and liver NAD contents and erythrocyte NAD/NADH ratio, and increased plasma H2O2 levels. Decrease in NAD/NADH ratio and increase in H2O2 generation were also observed in human erythrocytes after exposure to N1-methylnicotinamide in vitro. Sweating eliminated excessive nicotinamide (5.3-fold increase in sweat nicotinamide concentration 1 h after a 100-mg nicotinamide load). Skin damage or aldehyde oxidase inhibition with tamoxifen or olanzapine, both being notorious for impairing glucose tolerance, delayed N1-methylnicotinamide clearance.
CONCLUSION: These findings suggest that nicotinamide overload, which induced an increase in plasma N1-methylnicotinamide, associated with oxidative stress and insulin resistance, plays a role in type 2 diabetes.
Keywords: Type 2 diabetes, Nicotinamide, N1-methylnicotinamide, Insulin resistance, Oxidative stress, Liver, Sweat glands
INTRODUCTION
Type 2 diabetes, characterized by insulin resistance and oxidative stress[1,2], has reached epidemic proportions not only among adults, but also among adolescents in the past few decades, which has led to the hypothesis that type 2 diabetes is a result of gene-environment (diet) interactions, because the human genome has not changed markedly in such a short time[3-5]. However, what the environmental/dietary risk factors are and how they function remain unclear.
Nicotinamide, the amide of nicotinic acid, is the precursor for the coenzymes β-nicotinamide adenine dinucleotide (NAD) and nicotinamide adenine dinucleotide phosphate (NADP), which function in many enzyme-catalyzed oxidation and reduction reactions. Therefore, nicotinamide homeostasis is vitally important for the body[6]. In humans, excess nicotinamide is methylated, oxidized or hydroxylated to N1-methylnicotinamide, nicotinamide-N-oxide or 6-hydroxynicotinamide, respectively, and then N1-methylnicotinamide is further oxidized to the pyridones N1-methyl-2-pyridone-5-carboxamide (2Py) and N1-methyl-4-pyridone-3-carboxamide by aldehyde oxidase (AOX; EC 1.2.3.1). The major nicotinamide metabolites in human urine are 2Py and N1-methylnicotinamide[7]. Although the nicotinamide metabolism pathway is well understood, however, the influence of the catabolic efficiency of excess nicotinamide on the body is not fully understood.
Since pellagra was found to be related to vitamin B3 (niacin) deficiency in 1930s, more attention has been paid to the prevention of niacin deficiency. As a result, nicotinamide is used extensively as a food additive without having undergone full formal safety evaluation[8], and the chronic effects of nicotinamide overuse are far from understood[9]. Nicotinic acid and nicotinamide frequently are reported to impair glucose tolerance and induce insulin resistance[10-12]. Recent evidence suggests that N1-methylnicotinamide is involved in Parkinson’s disease[9]. More importantly, the abrupt increase in prevalence of type 2 diabetes in the United States in the latter half of the 20th century[13] occurred roughly in parallel with the increase in per capita niacin content[14]. A similar situation occurred in China, in which food enrichment with niacin began in 1980s, followed by a sharp increase in the incidence of diabetes from 1% in 1980 to 5.5% in 2001[15]. However, whether type 2 diabetes pathogenesis involves nicotinamide overload is undetermined.
The present study aimed to compare nicotinamide metabolic patterns between diabetic and non-diabetic subjects, and to investigate the relationship between nicotinamide overload and insulin resistance. We found that diabetic subjects exhibited slow N1-methylnicotinamide clearance, and that N1-methylnicotinamide could trigger oxidative stress and insulin resistance, which suggested that the association of nicotinamide overload with relatively slow N1-methylnicotinamide detoxification and excretion might be at least partially responsible for the development of type 2 diabetes.
MATERIALS AND METHODS
Chemicals
Nicotinamide was purchased from Sigma (St. Louis, MO, USA). Nicotinamide tablets (50 mg/tablet) were purchased from Lisheng Pharma (Tianjin, China). N1-methylnicotinamide was purchased from Takeda Chemical Industries (Osaka, Japan). Tamoxifen was from Kunshan Sanyou Pharmaceutical Adjuvant Factory (Kunshan, China). Olanzapine was obtained from Beijing Nordhuns Chemical Technology (Beijing, China). N1-ethylnicotinamide and 2-Py were synthesized according to the methods described respectively by Hirayama et al[16] and Holman et al[17].
Nicotinamide load test in humans
This study was approved by the relevant ethics committee, and all the Chinese participants gave informed consent. Fourteen type 2 diabetic patients from eight families with a positive history (eight men and six women, mean age, 55.3 ± 10.2; range, 36-75 years) and 14 age- and sex-matched healthy volunteers without a family history (mean age, 53.8 ± 10.8; range, 39-75 years) participated in this study. Type 2 diabetes was defined as a fasting glucose level ≥ 7.0 mmol/L or current receipt of hypoglycemic medication. All subjects refrained from drugs, alcohol and caffeinated products for at least 12 h before the study. After an overnight fast, urine was collected and quantitated 1 h before, and 2, 4 and 5 h after loading with 100 mg nicotinamide. Venous blood was collected into sodium citrate tubes before and 5 h after nicotinamide loading, and separated by centrifugation (1500 g, 10 min). Aliquots of each plasma and urine sample were placed directly in liquid nitrogen and then transferred to -80°C and -20°C, respectively.
Cumulative nicotinamide and N1-methylnicotinamide experiments
All animal experiments were conducted in accordance with institutional guidelines. Male Sprague-Dawley rats (180-220 g) were fed a standard rat chow. In nicotinamide experiment, rats were divided randomly into three groups (n = 6 each) and fasted for 14 h before the experiment. In the two nicotinamide-treated groups, nicotinamide (100 or 400 mg/kg) was administered (intraperitoneally, ip) and repeated every 2 h for five doses. Glucose tolerance test was performed by injection of glucose (2 g/kg, ip) 2 h after the final nicotinamide injection. Blood glucose was measured 1 h after glucose injection. Blood was collected by eye bleed into EDTA tubes under urethane anesthesia (1.5 g/kg, ip) 2 h after glucose administration. Plasma was separated by centrifugation (1500 g, 10 min). After plasma collection, the buffy coat and top fifth reticulocyte-rich layer of erythrocytes were discarded. Aliquots of plasma and erythrocytes, and harvested samples of liver and gastrocnemius muscle were plunged directly into liquid nitrogen and subsequently stored at -80°C until assay. The same protocol was used in the N1-methylnicotinamide experiment, except that the two treated groups repeatedly received 100 or 400 mg/kg N1-methylnicotinamide per injection and a total dosage of 0.5 or 2 g, respectively (each group, n = 6).
AOX inhibition
Rats in inhibitor-treated groups received subcutaneous tamoxifen (50 mg/kg) or olanzapine (20 mg/kg) twice daily for 4 d, and rats in each control group received vehicle only (each group, n = 6). After an overnight fast, all the rats received nicotinamide (100 mg/kg, ip). Plasma samples were collected 5 h after nicotinamide administration as described above.
Chronic AOX inhibition
Rats were divided initially into two groups: tamoxifen-treated (20 mg/kg per day, subcutaneously, n = 24) and vehicle-treated (control, n = 8). Eight control and eight tamoxifen-treated rats were sacrificed at the end of 7 wk. Liver samples were harvested and stored at -80°C for western blotting. The remainder of tamoxifen-treated rats was then divided into two groups treated with tamoxifen (20 mg/kg per day) with or without N1-methylnicotinamide (100 mg/kg per day, subcutaneously), respectively. Two weeks after the treatment, glucose tolerance test was performed by injection of glucose (2 g/kg, ip) after an overnight fast. Blood glucose was measured before (fasting) and 1 h after glucose injection. Samples of plasma, liver and gastrocnemius muscle were harvested under urethane anesthesia (1.5 g/kg, ip) 2 h after glucose injection.
Thermal injury
Rats in the burn group (n = 11) were given a 40% total body surface area, full-thickness scald burn under ether anesthesia by immersion of the back in 95°C water for 15 s, as previously described[18]. Sham rats (n = 7) were subjected to an identical procedure, except that they were immersed in 25°C water. All rats received glucose (2 g/kg, ip) 24 h after burning, with an overnight fast. Blood glucose was measured before (fasting) and 1 h after glucose dosing. Samples of plasma, liver and gastrocnemius muscle were harvested 2 h after glucose injection.
Sweat collection
Five healthy young male volunteers aged 20-24 years participated in this study. After an overnight fast, whole body sweat was collected before and 1, 2 and 3 h after a single oral dose of 100 mg nicotinamide, by having the volunteers stay in a plastic bag during sauna treatment (80°C, 15 min), with stringent precautions to minimize evaporative loss. Aliquots of sweat were placed in liquid nitrogen, and transferred to -80°C until analysis.
Assays of glucose, insulin and glycogen
Blood glucose was measured using a glucometer (OneTouch Ultra; LifeScan Inc.). Plasma insulin was measured by radioimmunoassay using commercial kits (Beijing North Institute of Biological Technology, China). Muscle and liver glycogen contents were determined with Glycogen Assay Kits (Nanjing Jiancheng Bioengineering Institute, Nanjing, China).
H2O2 assay
Blood from healthy adult male volunteers was collected in EDTA-containing tubes and centrifuged (1500 g, 10 min). The plasma, buffy coat, and top fifth reticulocyte-rich layer of erythrocytes were discarded, and the remaining cells were washed three times in isotonic saline, and centrifuged (1500 g, 10 min). After the supernatant was discarded, the packed erythrocytes were transferred to Earle’s Balanced Salt Solution presaturated with 95% O2 and 5% CO2 to make an erythrocyte suspension (20 μL packed erythrocytes/mL). Two hundred microliters of erythrocyte suspension was added to each well of a 96-well plate in the absence or presence of N1-methylnicotinamide or 2Py at concentrations of 10 nmol/L to 100 μmol/L, and incubated for 3 h at 37°C. H2O2 concentrations in the supernatant of cell cultures and in rat plasma were measured using an H2O2 Assay Kit (Beyotime Biotechnology, Jiangsu, China).
NAD/NADH assay
Human erythrocyte suspension (20 μL packed erythrocytes/mL Earle’s Balanced Salt Solution) was incubated in 1.5-mL Eppendorf tubes with a 1.5-mm hole in the cover, for 4 h at 37°C in the presence or absence of N1-methylnicotinamide (10 μmol/L). The tubes were centrifuged (1500 g, 15 min, 4°C) and the supernatant was discarded. Four hundred microliters of BioVision NAD/NADH Extraction Buffer (Mountain View, CA, USA) was added to each tube for 5 min to lyse the cells. The lysates were ultrafiltered using BioVision 10-kD cut-off filters (14 000 g, 30 min, 4°C). Assays were performed using the NAD+/NADH Quantification Kits according to the manufacturer’s instructions (BioVision). For rat tissue NAD/NADH assay, 20 mg frozen liver, 20 mg frozen muscle or 20 μL packed erythrocytes were homogenized in 400 μL BioVision NAD/NADH Extraction Buffer. The homogenate was ultrafiltered using BioVision 10-kD cut-off filters (14 000 g, 30 min, 4°C). The assay was conducted following the manufacturer’s instructions.
Western blotting
Western blotting analysis of AOX was performed according to standard protocols. Briefly, 100 μg rat liver proteins were separated on 5%-8% SDS polyacrylamide gels and transferred to polyvinyl difluoride membranes (Millipore, Bedford, MA, USA). The membranes were blocked in PBS that contained 0.1% Tween-20 and 5% non-fat dry milk for 30 min at room temperature, and incubated with antibody to AOX (1:250; BD Transduction Laboratories, Lexington, KY, USA) overnight at 4°C. Then, the membranes were washed by PBS-Tween followed by 1 h incubation at room temperature with horseradish peroxidase (HRP)-conjugated secondary antibody (1:5000; Santa Cruz Biotechnology, Santa Cruz, CA, USA) and detected using the enhanced chemiluminescence (ECL) (Amersham Life Science).
Determination of N1-methylnicotinamide, nicotinamide and 2Py
N1-methylnicotinamide, nicotinamide and 2Py were analyzed using an HPLC system that consisted of an LC-9A pump (Shimadzu, Kyoto, Japan), a Rheodyne 7725i sample injector with a 20-μL sample loop (Rheodyne LLC, Rohnert Park, CA, USA), a Hypersil ODS C18 column (Thermo, Bellefonte, PA, USA), a Waters 470 fluorescence detector (Milford, MA, USA) for N1-methylnicotinamide measurements, and a UV3000 detector (Thermo Separations Products, Fremont, CA, USA) for 2Py detection. N1-methylnicotinamide concentration was analyzed by detecting its fluorescent 1,6-naphthyridine derivatives according to the method of Musfeld et al[19], using 366 nm excitation and 418 nm emission wavelengths, with the mobile phase (10 mmol/L sodium heptanesulfonate, 50 mmol/L triethylamine and 22% acetonitrile in water, pH 3.2 with 85% H3PO4) at a flow rate of 1 mL/min. Nicotinamide was quantitated by the same procedure after quantitative conversion of nicotinamide to N1-methylnicotinamide using iodomethane, according to the method of Clark[20]. For analyzing urinary 2Py, 50 μL 85% H3PO4 and 0.45 mL water were added to each urine sample (0.5 mL). After brief vortex mixing, the samples were centrifuged (12 000 g, 10 min). The supernatant was filtered through a 0.45-μm filter for HPLC analysis. Standard solutions were prepared for calibration, which contained 0, 0.1, 1, 10 and 100 μg/mL of pure 2Py in normal urine. The mobile phase (5% methanol, 10 mmol/L KH2PO4, 10 mmol/L triethylamine, pH 3.0 adjusted with 85% H3PO4) was delivered at 1 mL/min. UV detection was performed at 260 nm.
Statistical analysis
The data are presented as means ± SD. Statistical differences in the data were evaluated by paired or unpaired Student’s t test, or ANOVA as appropriate, and were considered significant at P < 0.05.
RESULTS
Slow N1-methylnicotinamide clearance is a prominent feature of type 2 diabetes
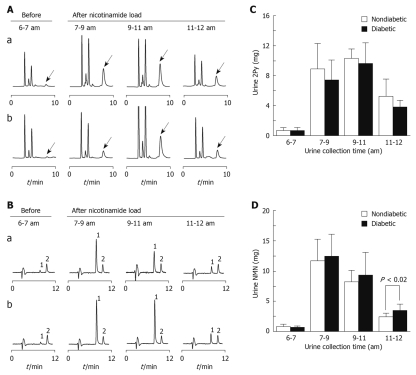
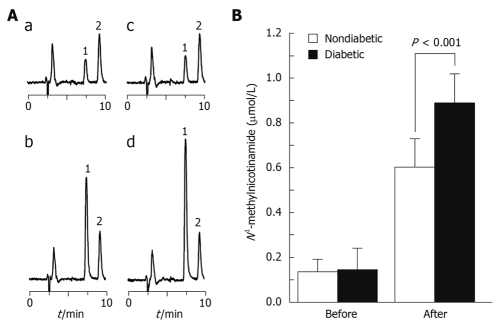
The 5-h total urinary 2Py excretion after 100 mg nicotinamide load in the diabetic group was significantly less than that in the non-diabetic group (20.9 ± 4.5 mg vs 24.3 ± 4.1 mg, P < 0.05, Figure 1A and C), but urinary N1-methylnicotinamide excretion increased in the diabetic group (Figure 1B and D). The plasma N1-methylnicotinamide level 5 h after nicotinamide load was significantly higher in the diabetic than non-diabetic group (Figure 2). It should be noted that there were no statistical differences in the basal urinary excretions of 2Py and N1-methylnicotinamide and the basal levels of plasma N1-methylnicotinamide between the two groups (Figures 1 and 2). These results suggest that slow plasma N1-methylnicotinamide clearance, which can be revealed by nicotinamide load test, may be a potential biomarker of type 2 diabetes.
Figure 1.
Urinary excretion patterns of 2Py and N1-methylnicotinamide in diabetic and non-diabetic subjects. A and B: Representative HPLC chromatograms of urinary excretions of 2Py (indicated by arrow) and N1-methylnicotinamide (NMN) of a non-diabetic (Aa and Ba) and a diabetic (Ab and Bb) subject, before and after 100 mg nicotinamide loading at 7:00 am Urine samples taken at given time were normalized to equal volumes before HPLC analysis; C and D: Summaries of the results from the measurements shown in A and B, respectively. Bar graphs indicate mean ± SD.
Figure 2.
Plasma N1-methylnicotinamide levels of diabetic and non-diabetic subjects after nicotinamide loading. A: Representative HPLC chromatograms of plasma N1-methylnicotinamide levels from a non-diabetic (a, b) and a diabetic (c, d) subject before (a, c) and 5 h after (b, d) 100 mg nicotinamide loading. 1: N1-methylnicotinamide; 2: Internal standard: N1-methylnicotinamide; B: Summary of the results from the measurements shown in A. Bar graph indicates mean ± SD.
High plasma N1-methylnicotinamide induces insulin resistance
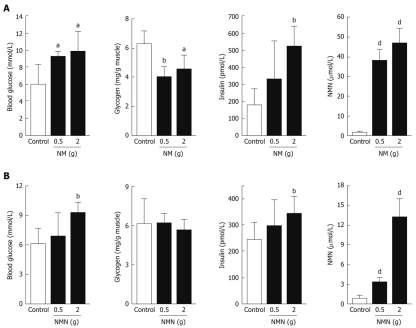
We examined the effect of nicotinamide overload on rat glucose metabolism. Rats treated with cumulative doses of nicotinamide (2 g/kg) exhibited significantly higher levels of blood glucose and plasma insulin, but significantly lower muscle glycogen content than control rats after glucose load (Figure 3A). Another notable change after nicotinamide administration was that there was a marked increase in plasma N1-methylnicotinamide (Figure 3A), so we examined the effects of N1-methylnicotinamide. Cumulative doses of N1-methylnicotinamide (2 g/kg) had comparable effects to nicotinamide (Figure 3B), which suggested that the effects of nicotinamide overload might have been mediated by N1-methylnicotinamide.
Figure 3.
Effects of nicotinamide and N1-methylnicotinamide on glucose metabolism of rats. A: Changes in blood glucose, muscle glycogen, plasma insulin and plasma N1-methylnicotinamide in rats treated with or without cumulative nicotinamide (0.5 or 2 g/kg) after glucose loading; B: Comparable effects of cumulative N1-methylnicotinamide (0.5 or 2 g/kg). NM: Nicotinamide; NMN: N1-methylnicotinamide. aP < 0.05 vs control, bP < 0.01 vs control, dP < 0.001 vs control. Bar graphs show mean ± SD.
N1-methylnicotinamide triggers oxidative stress
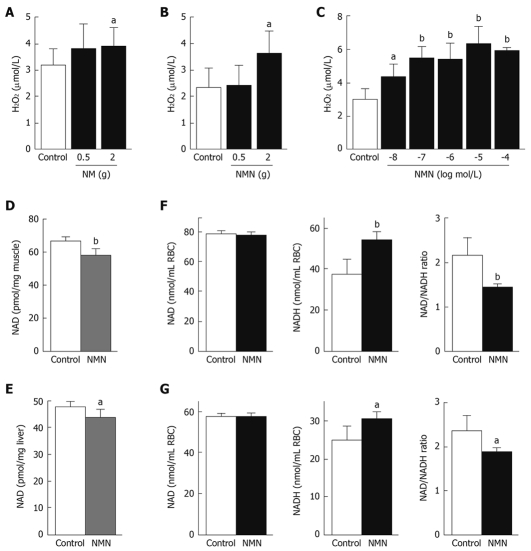
Type 2 diabetes is associated with oxidative stress[1,2]. We therefore examined whether nicotinamide overload and high N1-methylnicotinamide levels were implicated in oxidative stress. The results showed that cumulative effects of nicotinamide (2 g/kg) or N1-methylnicotinamide (2 g/kg) led to a significant increase in rat plasma levels of H2O2 (Figure 4A and B), a major reactive oxygen species (ROS) and common indicator of oxidative stress[2]. Such an enhancing effect was also observed in human erythrocytes in vitro at physiological concentrations of N1-methylnicotinamide (Figure 4C), whereas 2Py, the end product of nicotinamide, did not have an enhancing effect at the observed concentrations (10 nmol/L to 100 μmol/L) (data not shown). These results indicate that high plasma N1-methylnicotinamide may induce systemic oxidative stress.
Figure 4.
Effects of N1-methylnicotinamide on H2O2 generation and NAD levels. A, B: Cumulative effects of nicotinamide (NM, 0.5 or 2 g/kg) and N1-methylnicotinamide (NMN, 0.5 or 2 g/kg) on rat plasma H2O2 levels; C: H2O2 concentrations in the supernatant of cultured human erythrocytes with or without 3 h exposure to different concentrations of NMN. For each concentration, n = 4; D, E: NAD (NAD+ and NADH) contents in muscle (D) and liver (E) of rats treated with saline (control) or a cumulative dose of 2 g/kg NMN; F: NAD and NADH contents and NAD/NADH ratio in the erythrocytes (RBCs) of rats with or without cumulative exposure to NMN; G: NAD and NADH contents, and NAD/NADH ratio in human RBCs with (n = 4) or without (control, n = 4) 4 h exposure to 10 μmol/L NMN in vitro. aP < 0.05 vs control, bP < 0.01 vs control. Bar graphs indicate mean ± SD.
Increasing evidence has indicated that type 2 diabetes has abnormalities in the NAD+/NADH redox couple[21]. We therefore investigated whether N1-methylnicotinamide affected tissue NAD levels. Cumulative exposure to N1-methylnicotinamide significantly reduced rat muscle and liver NAD (NAD+ + NADH) contents (Figure 4D and E). Notably, the erythrocytes of rats treated with cumulative doses of N1-methylnicotinamide (2 g/kg) exhibited a significant increase in NADH and decrease in NAD/NADH ratio (Figure 4F). A similar effect was observed in human erythrocytes in vitro (Figure 4G). These results suggest that N1-methylnicotinamide-induced oxidative stress may originate from imbalance in the NAD+/NADH redox couple.
AOX inhibition reduces N1-methylnicotinamide clearance
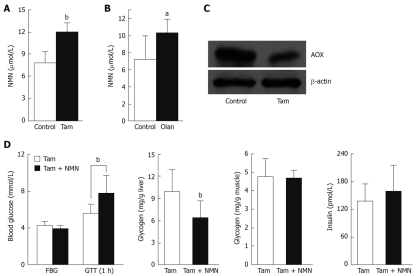
AOX is responsible for conversion of N1-methylnicotinamide-to-2Py[22]. We examined changes in N1-methylnicotinamide clearance after rat AOX inhibition by the putative inhibitors tamoxifen and olanzapine[23], both of which are known to impair glucose tolerance[24,25]. The rats treated with tamoxifen (100 mg/kg per day) or olanzapine (40 mg/kg per day) for 4 d exhibited significantly higher plasma N1-methylnicotinamide levels than control rats 5 h after 100 mg/kg nicotinamide loading (Figure 5A and B). Moreover, chronic tamoxifen treatment for 7 wk significantly reduced rat liver AOX protein expression (P < 0.05, Figure 5C). To further explore the role of nicotinamide overload in insulin resistance, we used tamoxifen plus N1-methylnicotinamide to mimic the conditions of relatively low AOX activity and excess nicotinamide intake. Rats treated with tamoxifen plus N1-methylnicotinamide exhibited significantly higher blood glucose and much lower liver glycogen content than those treated with tamoxifen alone after glucose loading (Figure 5D).
Figure 5.
Effects of aldehyde oxidase (AOX) inhibitors on plasma N1-methylnicotinamide levels and glucose metabolism in rats. A and B: Plasma N1-methylnicotinamide (NMN) levels 5 h after nicotinamide load (100 mg/kg, ip) in rats treated with or without AOX inhibitors tamoxifen (Tam, A) or olanzapine (Olan, B) (each group, n = 6). aP < 0.05 vs control, bP < 0.01 vs control; C: Liver AOX expression in rats with or without 7 wk tamoxifen treatment. The blot is representative of four independent experiments; D: Responses to a glucose tolerance test in rats after 9 wk treatment with tamoxifen with or without NMN (100 mg/kg per day) treatment in the last 2 wk. FBG: Fasting blood glucose; GTT (1 h): Blood glucose measured 1 h after glucose tolerance test. bP < 0.01 vs control. Bar graph indicates mean ± SD.
Skin involvement in N1-methylnicotinamide-mediated insulin resistance
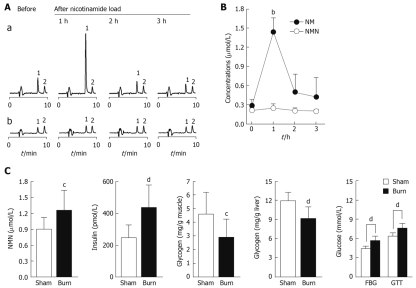
If N1-methylnicotinamide is indeed involved in insulin resistance, then any factors related to N1-methylnicotinamide detoxification and excretion may affect insulin sensitivity. Of the factors, skin may be of particular significance because it takes part in N1-methylnicotinamide detoxification and excretion, respectively, through skin AOX[26,27] and sweat glands[28]. We thus explored the role of skin by analyzing human sweat excretion of nicotinamide and N1-methylnicotinamide after nicotinamide loading, or by assessing changes in plasma N1-methylnicotinamide clearance of rats with severe skin damage. Importantly, we found that nicotinamide concentrations in the sweat 1 h after 100 mg nicotinamide loading was 5.3-fold higher than that in fasting sweat, whereas N1-methylnicotinamide concentrations were not significantly altered under such conditions (Figure 6A and B). This indicates that excess nicotinamide, without needing any conversion, is expelled through sweat. Moreover, this study found that rats with severe skin damage had a significant elevation in plasma N1-methylnicotinamide associated with high blood glucose and plasma insulin levels, but lower muscle glycogen content after glucose loading (Figure 6C).
Figure 6.
Role of skin in nicotinamide metabolism and insulin resistance. A: Representative HPLC chromatograms showing changes of sweat nicotinamide (NM) and N1-methylnicotinamide (NMN) concentrations in a subject before and 1, 2 and 3 h after 100 mg nicotinamide loading. 1 and 2 in Aa are NM and internal standard N1-ethylnicotinamide, respectively; 1 and 2 in Ab are NMN and internal standard N1-ethylnicotinamide, respectively; B: Summary of the measurements shown in A. bP < 0.0001 vs control; C: Comparison of plasma NMN and insulin levels, muscle and liver glycogen contents, and blood glucose between sham-burn (n = 7) and burn (n = 11) rats after glucose load. FBG: Fasting blood glucose; GTT: Blood glucose 1 h after glucose injection. Bar graphs show mean ± SD. cP < 0.05, dP < 0.01 vs control.
DISCUSSION
The main findings of this study were that: (1) nicotinamide overload elevates plasma levels of N1-methylnicotinamide associated with oxidative stress and insulin resistance; (2) the skin plays an important role in expelling excess nicotinamide and detoxifying N1-methylnicotinamide; and (3) diabetic subjects have slow plasma N1-methylnicotinamide clearance. These findings may contribute to explain the mechanism of oxidative stress and insulin resistance in a variety of clinical conditions.
N1-methylnicotinamide is a potent trigger of oxidative stress and insulin resistance
Insulin resistance and oxidative stress are the major hallmarks of type 2 diabetes[1,2], but the mechanisms underlying the development of systemic oxidative stress and insulin resistance are unclear. Both nicotinic acid and nicotinamide have been reported to induce insulin resistance, which may lead to elevation of plasma insulin due to β-cell compensation[10-12]. Coincidentally, our data showed that nicotinamide overload induced acute insulin resistance in rats associated with high plasma levels of N1-methylnicotinamide; the methylation product of nicotinamide being more toxic than nicotinamide (> 6-fold)[29]. Importantly, diabetic subjects exhibited significantly higher plasma N1-methylnicotinamide levels than non-diabetic subjects after nicotinamide loading, which suggests its involvement in the toxic effects of nicotinamide overload. Indeed, this study demonstrated that N1-methylnicotinamide mimicked the effect of nicotinamide overload, which suggested N1-methylnicotinamide mediation of the toxic effect.
Increasing evidence suggests that insulin resistance is due to an unfavorable internal environment because muscles resistant to insulin, when cultured in vitro, regain sensitivity to insulin[30-32]. Further evidence reveals that systemic oxidative stress may be responsible for triggering insulin resistance[1,33]. Consistent with previous research, this study found that N1-methylnicotinamide not only elevated plasma H2O2 levels in vivo, but also directly stimulated H2O2 generation of human erythrocytes in vitro at physiological concentrations, which indicates that N1-methylnicotinamide is a potent trigger of diabetic oxidative stress.
Oxidative stress may induce NAD depletion, a marker of cell injury[34,35]. Indeed, this study found that N1-methylnicotinamide-induced high plasma H2O2 level was associated with a significant reduction in NAD content in the muscle and liver of rats. Then came the vital question: where did the excess systemic ROS originate? NADH-dependent ROS generation is an important source of intracellular ROS[34]. Accumulating evidence has indicated that diabetes shows a decreased cytosolic NAD+/NADH ratio in a variety of tissues[21]. Importantly, this study demonstrates that N1-methylnicotinamide decreases NAD/NADH ratio in rat erythrocytes in vivo and human erythrocytes in vitro. Thus, it is likely that diabetic oxidative stress is initiated by high plasma N1-methylnicotinamide-induced imbalance in the NAD+/NADH redox couple. Many cellular processes are governed by the enzymes using NAD+/NADH as a cofactor[6,21,34], therefore, it is not difficult to understand why a set of metabolic abnormalities happen in type 2 diabetes.
Role of AOX in insulin resistance
Mammalian AOX is a molybdo-flavo enzyme involved in the detoxification of various endogenous and exogenous N-heterocyclic compounds[22,23]. N1-methylnicotinamide is one of the substrates of AOX by which N1-methylnicotinamide is oxidized to pyridones[7], and thus, detoxified. AOX is expressed predominantly in the liver. Therefore, severe liver disease might be expected to reduce plasma N1-methylnicotinamide clearance and subsequent insulin resistance. In fact, it is well known that liver cirrhosis is associated with high incidence of diabetes[36,37]. Pumpo et al[38] have found that cirrhotic patients have high serum N1-methylnicotinamide levels, both in basal values and after nicotinamide loading. Moreover, non-alcoholic steatohepatitis, the most prevalent liver disease in the western world, typically is associated with the metabolic syndrome that is characterized by insulin resistance, diabetes and hypertension[24]. Tamoxifen, a well-known inducer of non-alcoholic steatohepatitis[24], is found to inhibit strongly AOX activity[23] and its expression (Figure 5C). Collectively, it seems that the decrease in N1-methylnicotinamide detoxification may be involved in hepatogenic insulin resistance.
AOX is also expressed in the skin[26], which suggests skin involvement in N1-methylnicotinamide detoxification. Moreover, as found in this study, human sweat glands can excrete excess nicotinamide. Therefore, decreased skin function may be implicated in N1-methylnicotinamide-induced insulin resistance. In fact, severe burns may induce long-lasting insulin resistance, a well-documented but poorly understood phenomenon[31,39]. The present study demonstrated that severe burns significantly delayed N1-methylnicotinamide clearance, which suggests that long-lasting post-burn insulin resistance may involve a decrease in nicotinamide detoxification and excretion.
Relationship between lifestyle risk factors and nicotinamide overload
Environmental and lifestyle risk factors may trigger type 2 diabetes[3,4]. From our study, it emerges that the risk factors may involve nicotinamide overload. Firstly, excess nicotinamide may lead to high plasma N1-methylnicotinamide, with subsequent oxidative stress and insulin resistance. In response to insulin resistance, the pancreatic β cells have to increase insulin secretion (hyperinsulinemia) compensatorily, which may eventually lead to β-cell failure and blood sugar levels being out of control. The result that tamoxifen-induced AOX inhibition plus N1-methylnicotinamide impaired rat glucose tolerance (Figure 5D) implies that excess nicotinamide intake may be more harmful to those with a low N1-methylnicotinamide clearance.
Secondly, dietary risk factors may be related to nicotinamide contents in foods. For example, meat, which is rich in nicotinamide, increases the risk of type 2 diabetes[40,41]. Moreover, food fortification with niacin may play a role in nicotinamide overload. If comparing the epidemic of type 2 diabetes in the United States[13] with the history of food fortification[14], one can clearly see that the trend for rapid increase in the incidence of diabetes has occurred in parallel with the trend in mandatory niacin-fortification-induced increase in the per capita niacin consumption in the latter half of the 20th century. These facts may explain why the western dietary pattern, characterized by a high intake of meat and niacin-fortified foods, confers such a high risk of type 2 diabetes.
Thirdly, sedentary lifestyle risk factor may involve sweat gland inactivity. Sweat gland activity fluctuates according to ambient temperature; the most significant feature of the gland. Therefore, sweat gland inactivity is expected to slow nicotinamide catabolism and thereby increase the danger of developing insulin resistance. In fact, the cold season is known to worsen glucose metabolism[42,43], whereas exercising sufficiently to sweat may reduce diabetic incidence[44]. Therefore, it is likely that sedentary lifestyle risk factors may be at least partially due to sweat gland inactivity by air-conditioned working/living environments.
It should be noted that large doses of nicotinic acid and nicotinamide may induce liver damage[45,46], therefore, long-term investigation may be necessary to determine the relationship between chronic nicotinamide overload and non-alcoholic steatohepatitis. Historically, the epidemic of pellagra has been restricted mainly to those who have performed heavy industrial labor with poor nutrient supply[9]. Hence, the present study gives rise to an important social and public health issue as to whether foods need to be fortified with niacin (nicotinamide or nicotinic acid), when the people in developed countries have already been living in an age of over-nutrition and sweat gland inactivity.
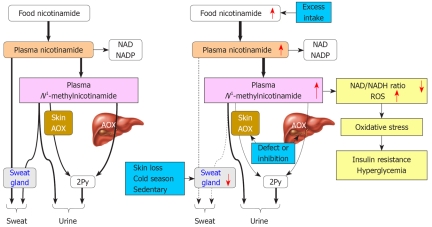
In summary, it appears that gene-environment (diet) interactions may be a reflection, to some extent, of the outcome of combination of nicotinamide overload and relatively low N1-methylnicotinamide detoxification and excretion. As summarized in Figure 7, the pathogenesis of type 2 diabetes may be at least partially due to long-term excess nicotinamide intake, and/or slowness in N1-methylnicotinamide detoxification, and/or decrease in excess nicotinamide and N1-methylnicotinamide excretion. This may lead to high plasma N1-methylnicotinamide levels, and subsequently oxidative stress and insulin resistance. Therefore, reducing nicotinamide intake and facilitating excretion of nicotinamide metabolites may be a useful preventive and therapeutic intervention in type 2 diabetes.
Figure 7.
Proposed model of the role of nicotinamide overload in the development of type 2 diabetes. Normally, if nicotinamide intake is slightly more than the body needs, excess nicotinamide will be detoxified rapidly and eliminated mainly via the N1-methylnicotinamide to 2Py pathway, which involves liver and skin functions (left). Frequent excess nicotinamide intake, low N1-methylnicotinamide detoxification, or sweat gland inactivity induces a substantial rise in plasma N1-methylnicotinamide concentrations and residence time after each meal, and consequently induces oxidative stress and insulin resistance (right). The change trends are indicated by red arrows or line thickness.
COMMENTS
Background
Type 2 diabetes generally is accepted to be a result of gene-environment interaction, although the underlying mechanism is not clear. Of the environmental factors, diet appears to play a major role. In fact, the sharp increases in the incidence of diabetes in the United States in the latter half of the 20th century and in China in the past two decades of the 20th century followed food fortification with niacin (i.e. nicotinamide and nicotinic acid) beginning in the early 1940s in the United States and in the early 1980s in China. Moreover, niacin is reported frequently to impair glucose metabolism and cause liver injury. Thus, there is the possibility that the high prevalence of type 2 diabetes in these countries in the past fewer decades may involve niacin toxicity.
Research frontiers
Type 2 diabetes is associated with increased systemic oxidative stress, a factor responsible for the development of insulin resistance. How the systemic oxidative stress occurs is a major issue in type 2 diabetes.
Innovations and breakthroughs
The present study demonstrated that the pathogenesis of type 2 diabetes may involve abnormal nicotinamide metabolism. Factors that induce nicotinamide overload and/or decrease in the detoxification and excretion of nicotinamide metabolites may lead to systemic oxidative stress and insulin resistance. The factors may include the frequent use of foods rich in nicotinamide and/or fortified with niacin, congenital enzymatic defects, liver diseases, and sweat gland loss or inactivity. The present study suggests that gene-environment interactions may reflect the outcome of increased nicotinamide intake and a decrease in its detoxification and excretion.
Applications
Reducing nicotinamide intake and facilitating the excretion of excess nicotinamide may be a useful preventive and therapeutic intervention in type 2 diabetes.
Peer review
This is an interesting study with human and experimental data, which investigated a clinically relevant issue, and gave an insight into the pathogenic mechanisms involved. The experiments were performed well and are presented well in the paper.
Footnotes
Supported by National Natural Science Foundation of China, No. 30570665; the Foundation of Dalian Technology Bureau, No. 2008E13SF182; and the Foundation of Key Laboratory of Education Department of Liaoning Province, No. 2009S005
Peer reviewer: Lu Cai, PhD, Associate Professor, Department of Pediatrics, University of Louisville School of Medicine, 570 South Preston Street, Suite 304F, Louisville, KY 40202, United States
S- Editor Cheng JX L- Editor Kerr C E- Editor Lin YP
References
- 1.Meigs JB, Larson MG, Fox CS, Keaney JF Jr, Vasan RS, Benjamin EJ. Association of oxidative stress, insulin resistance, and diabetes risk phenotypes: the Framingham Offspring Study. Diabetes Care. 2007;30:2529–2535. doi: 10.2337/dc07-0817. [DOI] [PubMed] [Google Scholar]
- 2.Paravicini TM, Touyz RM. NADPH oxidases, reactive oxygen species, and hypertension: clinical implications and therapeutic possibilities. Diabetes Care. 2008;31 Suppl 2:S170–S180. doi: 10.2337/dc08-s247. [DOI] [PubMed] [Google Scholar]
- 3.Andreassi MG. Metabolic syndrome, diabetes and atherosclerosis: influence of gene-environment interaction. Mutat Res. 2009;667:35–43. doi: 10.1016/j.mrfmmm.2008.10.018. [DOI] [PubMed] [Google Scholar]
- 4.Booth FW, Gordon SE, Carlson CJ, Hamilton MT. Waging war on modern chronic diseases: primary prevention through exercise biology. J Appl Physiol. 2000;88:774–787. doi: 10.1152/jappl.2000.88.2.774. [DOI] [PubMed] [Google Scholar]
- 5.Roche HM, Phillips C, Gibney MJ. The metabolic syndrome: the crossroads of diet and genetics. Proc Nutr Soc. 2005;64:371–377. doi: 10.1079/pns2005445. [DOI] [PubMed] [Google Scholar]
- 6.Li F, Chong ZZ, Maiese K. Cell Life versus cell longevity: the mysteries surrounding the NAD+ precursor nicotinamide. Curr Med Chem. 2006;13:883–895. doi: 10.2174/092986706776361058. [DOI] [PMC free article] [PubMed] [Google Scholar]
- 7.Kitamura S, Nitta K, Tayama Y, Tanoue C, Sugihara K, Inoue T, Horie T, Ohta S. Aldehyde oxidase-catalyzed metabolism of N1-methylnicotinamide in vivo and in vitro in chimeric mice with humanized liver. Drug Metab Dispos. 2008;36:1202–1205. doi: 10.1124/dmd.107.019075. [DOI] [PubMed] [Google Scholar]
- 8.Knip M, Douek IF, Moore WP, Gillmor HA, McLean AE, Bingley PJ, Gale EA. Safety of high-dose nicotinamide: a review. Diabetologia. 2000;43:1337–1345. doi: 10.1007/s001250051536. [DOI] [PubMed] [Google Scholar]
- 9.Williams A, Ramsden D. Nicotinamide: a double edged sword. Parkinsonism Relat Disord. 2005;11:413–420. doi: 10.1016/j.parkreldis.2005.05.011. [DOI] [PubMed] [Google Scholar]
- 10.Chang AM, Smith MJ, Galecki AT, Bloem CJ, Halter JB. Impaired beta-cell function in human aging: response to nicotinic acid-induced insulin resistance. J Clin Endocrinol Metab. 2006;91:3303–3309. doi: 10.1210/jc.2006-0913. [DOI] [PubMed] [Google Scholar]
- 11.Greenbaum CJ, Kahn SE, Palmer JP. Nicotinamide's effects on glucose metabolism in subjects at risk for IDDM. Diabetes. 1996;45:1631–1634. doi: 10.2337/diab.45.11.1631. [DOI] [PubMed] [Google Scholar]
- 12.Kahn SE, Beard JC, Schwartz MW, Ward WK, Ding HL, Bergman RN, Taborsky GJ Jr, Porte D Jr. Increased beta-cell secretory capacity as mechanism for islet adaptation to nicotinic acid-induced insulin resistance. Diabetes. 1989;38:562–568. doi: 10.2337/diab.38.5.562. [DOI] [PubMed] [Google Scholar]
- 13.Gross LS, Li L, Ford ES, Liu S. Increased consumption of refined carbohydrates and the epidemic of type 2 diabetes in the United States: an ecologic assessment. Am J Clin Nutr. 2004;79:774–779. doi: 10.1093/ajcn/79.5.774. [DOI] [PubMed] [Google Scholar]
- 14.Backstrand JR. The history and future of food fortification in the United States: a public health perspective. Nutr Rev. 2002;60:15–26. doi: 10.1301/002966402760240390. [DOI] [PubMed] [Google Scholar]
- 15.Gu D, Reynolds K, Duan X, Xin X, Chen J, Wu X, Mo J, Whelton PK, He J. Prevalence of diabetes and impaired fasting glucose in the Chinese adult population: International Collaborative Study of Cardiovascular Disease in Asia (InterASIA) Diabetologia. 2003;46:1190–1198. doi: 10.1007/s00125-003-1167-8. [DOI] [PubMed] [Google Scholar]
- 16.Hirayama T, Yoshida K, Uda K, Nohara M, Fukui S. High-performance liquid chromatographic determination of N1-alkylnicotinamide in urine. Anal Biochem. 1985;147:108–113. doi: 10.1016/0003-2697(85)90015-6. [DOI] [PubMed] [Google Scholar]
- 17.Holman WI, Wiegand C. The chemical conversion of nicotinic acid and nicotinamide to derivatives of N-methyl-2-pyridone by methylation and oxidation. Biochem J. 1948;43:423–426. doi: 10.1042/bj0430423. [DOI] [PMC free article] [PubMed] [Google Scholar]
- 18.Kasper SO, Castle SM, Daley BJ, Enderson BL, Karlstad MD. Blockade of the renin-angiotensin system improves insulin sensitivity in thermal injury. Shock. 2006;26:485–488. doi: 10.1097/01.shk.0000230302.24258.9f. [DOI] [PubMed] [Google Scholar]
- 19.Musfeld C, Biollaz J, Bélaz N, Kesselring UW, Decosterd LA. Validation of an HPLC method for the determination of urinary and plasma levels of N1-methylnicotinamide, an endogenous marker of renal cationic transport and plasma flow. J Pharm Biomed Anal. 2001;24:391–404. doi: 10.1016/s0731-7085(00)00425-8. [DOI] [PubMed] [Google Scholar]
- 20.Clark BR. Fluorometric quantitation of picomole amounts of 1-methylnicotinamide and nicotinamide in serum. Methods Enzymol. 1980;66:5–8. doi: 10.1016/0076-6879(80)66432-5. [DOI] [PubMed] [Google Scholar]
- 21.Ido Y. Pyridine nucleotide redox abnormalities in diabetes. Antioxid Redox Signal. 2007;9:931–942. doi: 10.1089/ars.2007.1630. [DOI] [PubMed] [Google Scholar]
- 22.Garattini E, Fratelli M, Terao M. Mammalian aldehyde oxidases: genetics, evolution and biochemistry. Cell Mol Life Sci. 2008;65:1019–1048. doi: 10.1007/s00018-007-7398-y. [DOI] [PMC free article] [PubMed] [Google Scholar]
- 23.Obach RS, Huynh P, Allen MC, Beedham C. Human liver aldehyde oxidase: inhibition by 239 drugs. J Clin Pharmacol. 2004;44:7–19. doi: 10.1177/0091270003260336. [DOI] [PubMed] [Google Scholar]
- 24.Ahmed MH, Osman KA. Tamoxifen induced-non-alcoholic steatohepatitis (NASH): has the time come for the oncologist to be diabetologist. Breast Cancer Res Treat. 2006;97:223–224. doi: 10.1007/s10549-005-9104-9. [DOI] [PubMed] [Google Scholar]
- 25.Newcomer JW. Antipsychotic medications: metabolic and cardiovascular risk. J Clin Psychiatry. 2007;68 Suppl 4:8–13. [PubMed] [Google Scholar]
- 26.Moriwaki Y, Yamamoto T, Yamaguchi K, Takahashi S, Higashino K. Immunohistochemical localization of aldehyde and xanthine oxidase in rat tissues using polyclonal antibodies. Histochem Cell Biol. 1996;105:71–79. doi: 10.1007/BF01450880. [DOI] [PubMed] [Google Scholar]
- 27.Ueda O, Sugihara K, Ohta S, Kitamura S. Involvement of molybdenum hydroxylases in reductive metabolism of nitro polycyclic aromatic hydrocarbons in mammalian skin. Drug Metab Dispos. 2005;33:1312–1318. doi: 10.1124/dmd.105.005306. [DOI] [PubMed] [Google Scholar]
- 28.Vankhanen VD, Shaptala AA, Zaĭtseva TA, Shaptala VA. [Elimination of water-soluble vitamins with the sweat and their body allowance in miners working at deep levels] Gig Tr Prof Zabol. 1973;17:46–48. [PubMed] [Google Scholar]
- 29.Beyer KH, Russo HF. Renal tubular elimination of N1-methylnicotinamide. Am J Physiol. 1950;160:311–320. doi: 10.1152/ajplegacy.1950.160.2.311. [DOI] [PubMed] [Google Scholar]
- 30.Krützfeldt J, Kausch C, Volk A, Klein HH, Rett K, Häring HU, Stumvoll M. Insulin signaling and action in cultured skeletal muscle cells from lean healthy humans with high and low insulin sensitivity. Diabetes. 2000;49:992–998. doi: 10.2337/diabetes.49.6.992. [DOI] [PubMed] [Google Scholar]
- 31.Turinsky J, Saba TM, Scovill WA, Chesnut T. Dynamics of insulin secretion and resistance after burns. J Trauma. 1977;17:344–350. doi: 10.1097/00005373-197705000-00002. [DOI] [PubMed] [Google Scholar]
- 32.Zierath JR, Galuska D, Nolte LA, Thörne A, Kristensen JS, Wallberg-Henriksson H. Effects of glycaemia on glucose transport in isolated skeletal muscle from patients with NIDDM: in vitro reversal of muscular insulin resistance. Diabetologia. 1994;37:270–277. doi: 10.1007/BF00398054. [DOI] [PubMed] [Google Scholar]
- 33.Houstis N, Rosen ED, Lander ES. Reactive oxygen species have a causal role in multiple forms of insulin resistance. Nature. 2006;440:944–948. doi: 10.1038/nature04634. [DOI] [PubMed] [Google Scholar]
- 34.Ying W. NAD+/NADH and NADP+/NADPH in cellular functions and cell death: regulation and biological consequences. Antioxid Redox Signal. 2008;10:179–206. doi: 10.1089/ars.2007.1672. [DOI] [PubMed] [Google Scholar]
- 35.Strosznajder RP, Jesko H, Zambrzycka A. Poly(ADP-ribose) polymerase: the nuclear target in signal transduction and its role in brain ischemia-reperfusion injury. Mol Neurobiol. 2005;31:149–167. doi: 10.1385/MN:31:1-3:149. [DOI] [PubMed] [Google Scholar]
- 36.Garcia-Compean D, Jaquez-Quintana JO, Gonzalez-Gonzalez JA, Maldonado-Garza H. Liver cirrhosis and diabetes: risk factors, pathophysiology, clinical implications and management. World J Gastroenterol. 2009;15:280–288. doi: 10.3748/wjg.15.280. [DOI] [PMC free article] [PubMed] [Google Scholar]
- 37.Watanabe S, Yaginuma R, Ikejima K, Miyazaki A. Liver diseases and metabolic syndrome. J Gastroenterol. 2008;43:509–518. doi: 10.1007/s00535-008-2193-6. [DOI] [PubMed] [Google Scholar]
- 38.Pumpo R, Sarnelli G, Spinella A, Budillon G, Cuomo R. The metabolism of nicotinamide in human liver cirrhosis: a study on N-methylnicotinamide and 2-pyridone-5-carboxamide production. Am J Gastroenterol. 2001;96:1183–1187. doi: 10.1111/j.1572-0241.2001.03698.x. [DOI] [PubMed] [Google Scholar]
- 39.Gauglitz GG, Herndon DN, Kulp GA, Meyer WJ 3rd, Jeschke MG. Abnormal insulin sensitivity persists up to three years in pediatric patients post-burn. J Clin Endocrinol Metab. 2009;94:1656–1664. doi: 10.1210/jc.2008-1947. [DOI] [PMC free article] [PubMed] [Google Scholar]
- 40.van Dam RM, Rimm EB, Willett WC, Stampfer MJ, Hu FB. Dietary patterns and risk for type 2 diabetes mellitus in U.S. men. Ann Intern Med. 2002;136:201–209. doi: 10.7326/0003-4819-136-3-200202050-00008. [DOI] [PubMed] [Google Scholar]
- 41.Heidemann C, Hoffmann K, Spranger J, Klipstein-Grobusch K, Möhlig M, Pfeiffer AF, Boeing H. A dietary pattern protective against type 2 diabetes in the European Prospective Investigation into Cancer and Nutrition (EPIC)--Potsdam Study cohort. Diabetologia. 2005;48:1126–1134. doi: 10.1007/s00125-005-1743-1. [DOI] [PubMed] [Google Scholar]
- 42.Doró P, Benko R, Matuz M, Soós G. Seasonality in the incidence of type 2 diabetes: a population-based study. Diabetes Care. 2006;29:173. [PubMed] [Google Scholar]
- 43.Liang WW. Seasonal changes in preprandial glucose, A1C, and blood pressure in diabetic patients. Diabetes Care. 2007;30:2501–2502. doi: 10.2337/dc07-0597. [DOI] [PubMed] [Google Scholar]
- 44.Manson JE, Nathan DM, Krolewski AS, Stampfer MJ, Willett WC, Hennekens CH. A prospective study of exercise and incidence of diabetes among US male physicians. JAMA. 1992;268:63–67. [PubMed] [Google Scholar]
- 45.Bhardwaj SS, Chalasani N. Lipid-lowering agents that cause drug-induced hepatotoxicity. Clin Liver Dis. 2007;11:597–613, vii. doi: 10.1016/j.cld.2007.06.010. [DOI] [PMC free article] [PubMed] [Google Scholar]
- 46.Jaus H, Sturm G, Grässle B, Romen W, Siebert G. Metabolic effects and liver damage after prolonged administration of high doses of nicotinamide to rats. Nutr Metab. 1977;21 Suppl 1:38–41. doi: 10.1159/000176101. [DOI] [PubMed] [Google Scholar]


