Abstract
We created a spatial probability atlas of schizophrenia to provide information about the neuroanatomic variability of brain regions of patients with the disorder. Probability maps of 16 regions of interest (ROIs) were constructed by taking manually parcellated ROIs from subjects’ magnetic resonance images (MRIs) and linearly transforming them into Talairach space using the Montreal Neurological Institute (MNI) template. ROIs included temporal, parietal, and prefrontal cortex subregions, with a principal focus on temporal lobe structures. Subject Ns ranged from 11 to 28 for the different ROIs. Our global measure of the spatial distribution of the transformed ROI was the sum of voxels with 50% overlap among subjects. The superior temporal gyrus (STG) and fusiform gyrus (FG) had lower values for schizophrenic subjects than for normal controls, suggestive of greater spatial variability for these ROIs in schizophrenic subjects. For the computation of statistical significance of group differences in portions of the ROI, we used voxel-wise comparisons and Fisher's exact test. First-episode schizophrenic patients compared with controls showed lower probability (P < 0.05) at dorso-posterior areas of planum temporale and Heschl's gyrus, lateral and anterior regions in the left hippocampus (HIPP), and dorsolateral regions of fusiform gyrus. Importantly, most ROIs of schizophrenic subjects showed a significantly lower spatial overlap than controls, even after nonlinear spatial normalization, suggesting a greater heterogeneity in the spatial distribution of ROIs. There is consequently a need for caution in neuroimaging studies where data from schizophrenic subjects are normalized to a particular stereotaxic coordinate system based on healthy controls. Apparent group differences in activation may simply reflect a greater heterogeneity of spatial distribution in schizophrenia.
Keywords: MRI, Schizophrenia, Brain
Introduction
Most structural and functional neuroimaging studies have been based on a stereotaxic coordinate system of Talairach and Tournoux (Talairach and Tournoux, 1988), which has provided an anatomical reference for intersubject or intergroup consistency, and makes it possible to integrate findings across laboratories. For functional neuroimaging studies, anatomical variations are regarded as confounding factors that should be removed. Hence, spatial normalization to a stereotaxic space using several nonlinear warping techniques is a common step for such an analysis. However, such spatial normalization also rejects information concerning the effect of idiosyncratic anatomical morphology on functional activation in each individual. In the study of pathological groups, where functional abnormalities cannot easily be separated from abnormal morphology, a better understanding of functional activation may require comprehensive knowledge of the anatomical variability in the population.
Studies on the spatial distribution of subregions in normal subjects’ brains have shown high interindividual variability (Amunts et al., 1999, 2000; Paus et al., 1996). Additionally, interindividual variability in certain anatomical landmarks (Hunton et al., 1996; Steinmetz et al., 1989; Van Essen and Drury, 1997) has been reported to be of the order of centimeters even after Talairach transformation, which normalizes global size, position, and orientation. Such variations in specific regions of interests (ROIs) may include differences in shape, location, and orientation, in addition to mean volume.
Probabilistic atlases are thought to provide information about the neuroanatomic complexity and interindividual variability within a specific population in a common stereotaxic coordinate system (Mazziotta et al., 1995, 2001a,b; Roland and Zilles, 1994; Toga et al., 2001). Accordingly, many groups have noted the importance of probabilistic atlases and have made probability maps using different modalities and different methodologies. Probability maps for subregions of normal brains have been reported (Amunts et al., 1999, 2000; Kennedy et al., 1998; Leonard et al., 1998; Loftus et al., 1995; Paus et al., 1996; Penhune et al., 1996; Rademacher et al., 2001a,b, 2002; Thompson et al., 1996a; Tomaiuolo et al., 1999; Varnavas and Grand, 1999; Westbury et al., 1999; White et al., 1997).
Probability maps may also reveal abnormalities in brain morphology specific to neurodevelopmental or neurodegenerative processes in distinct pathological populations (Toga et al., 2001). Thus, the investigation of anatomical distribution and variation according to pathology is one of the major aims for using a probabilistic atlas approach. However, relatively few pathology-specific probability maps have been created (Narr et al., 2001; Thompson et al., 1997, 2001). Instead of using probability maps, pathology-specific variations have been investigated using shape analysis of specific ROIs (Csernansky et al., 1998; Shenton et al., 2002), but shape analysis does not provide information on spatial distribution, especially the relative location of ROIs together with neighboring brain regions.
The probabilistic atlas approach provides a new way to examine the pathology of schizophrenia using magnetic resonance imaging (MRI). Most MRI studies investigating structural abnormalities in schizophrenia have been based on a comparison of the difference in volume in manually parcellated brain regions. Here, volumetric methods include the precise definition of ROIs for consistent research among laboratories and normalization of volumes by intracranial volume to remove subject-specific global variations (for an example of this approach in subregions of the temporal lobe, see Kim et al., 2000). However, volumetric methods, which provide group comparison in gross neuroanatomy, tend to oversimplify the pathology-related characteristics and interindividual variations that anatomical experts often detect. Considering that brain development is processed in three-dimensional space, the variability of the developmental process can be explored by the distribution of specific ROIs in such a space in relation with neighboring regions. Therefore, probability maps of schizophrenia can be a useful tool for understanding better disease-specific abnormalities.
In the present study, we created and compared probability maps for first-episode schizophrenic patients and normal controls using ROIs that had previously been manually delineated. ROIs included temporal and parietal lobe subregions, prefrontal and insula (INSL) gray matter, ventricles, and the caudate nucleus (CAUD). Though all of these ROIs may have importance for understanding schizophrenia, we mainly focused on the temporal lobe where primary and secondary association cortices mediate various sensory functions such as auditory and visual processing and where components of the limbic lobe mediate memory and emotion. We subdivided the temporal lobe into the superior temporal gyrus (STG), middle temporal gyrus (MTG), inferior temporal gyrus (ITG), fusiform gyrus (FG), parahippocampal gyrus (PHG), hippocampus (HIPP), and amygdala (AMYG). For subregions of the STG, we also created probability maps of Heschl's gyrus (HG), where the primary auditory cortex is located, and planum temporale (PT), which is thought to be a neurological substrate for language.
Due to the importance of the temporal lobe in sensory and cognitive processing, interindividual anatomical variability has previously been explored for parts of the temporal lobe in psychiatrically well individuals using probability maps. Probability maps of planum temporale and primary auditory cortex, using MRI parcellations (Penhune et al., 1996), and primary auditory cortex, using cytoarchitectonic parcellations (Rademacher et al., 2001b), have been published for normal control subjects. However, little is known of the anatomical and distributional abnormalities in these areas and, to our knowledge, no probability maps have been created based on manually delineated ROIs in first-episode schizophrenia.
The initial goal of this study was to investigate the spatial distribution and spatial variability specific to first-episode schizophrenic patients using probability maps. Because first-episode schizophrenic patients are relatively free of confounds such as the long-term effects of neuroleptic medications and illness chronicity, spatial distribution of ROIs in this group may indicate disease-specific abnormalities more directly than would be the case for a sample of chronic schizophrenic patients.
Additionally, we examined potential problems with spatial normalization, especially in functional neuroimaging studies of this pathological group in comparison with a control group. It has been noted that imperfect spatial normalization, for example, due to topological variability between groups, can cause spurious results such that the significance difference may reflect an anatomic difference rather than a functional group difference (Steinmetz and Seitz, 1991; Woods, 1996). Therefore, we believe it is important to understand the spatial extent of anatomical variability of ROIs in schizophrenia compared with normal controls after spatial normalization. For this purpose, we created probability maps using a widely used method of nonlinear spatial normalization and investigated how the extent of anatomical variability can vary according to ROI. We also examined how nonlinear registration differentially affects spatial normalization of ROIs in a pathological group compared to controls.
Materials and methods
Subjects and parcellations of region of interests
To create probability maps, we used ROIs from schizophrenic subjects and normal controls that had previously been manually parcellated by our group for different structural MRI studies of first-episode schizophrenia (Hirayasu et al., 1998, 1999, 2000a,b, 2001; Lee et al., 2002; Levitt et al., personal communication).
Patients were tested at their first hospitalization. Patients and control subjects were matched for age (18–55 years), gender, IQ (above 75), and right-handedness. Exclusion criteria were negative history of seizures, head trauma with loss of consciousness, neurologic disorder, and no history of alcohol or other drug dependence within the last 5 years. Control subjects neither had Axis I or II mental disorder (SCID NP, SCID II) nor did their first-degree relatives (self-report). Patients were diagnosed using the Structured Clinical Interview for DSM-III-R or IV (SCID), and review of hospital course and medical records. In terms of operationalizing the onset of psychosis, we selected the date of first psychiatric hospitalization. The Mini-Mental State Examination was used to rule out dementia or delirium. The definition of each ROI in the manual parcellation has been described in the original papers of our group (see Hirayasu et al., 1998, 1999, 2000a,b, 2001; Lee et al., 2002; Levitt et al. personal communication). Interrater reliability was computed for all ROIs by three independent raters who were blind to diagnosis. All intraclass correlation coefficients were higher than 0.9.
Image acquisition and processing
The MR images were acquired by using a 1.5-T General Electric scanner (GE Medical Systems, Milwaukee). A three-dimensional Fourier transform spoiled gradient-recalled acquisition sequence was used that yielded a coronal series of contiguous 1.5-mm images throughout the brain with the following parameters: echo time (TE) = 5 ms, repetition time (TR) = 35 ms, repetition = 1, nutation angle = 45°, field of view = 24 cm, acquisition matrix = 256 × 256 × 124, voxel dimensions = 0.9375 × 0.9375 × 1.5 mm. Some studies for ROIs were performed on the realigned-resampled MRIs that were realigned to AC–PC line and interhemispheric axis and resampled to be isocubic voxel (0.9375 × 0.9375 × 0.9375 mm), while others used non-realigned, non-resampled 1.5 mm thick slices. All MRI measurements were manually traced by expert tracers blind to the subjects’ diagnosis.
Statistical probability map and probability difference map
We linearly normalized all brain images to the Montreal Neurological Institute (MNI) template (known as ICBM152) created from 152 brains in Talairach coordinates (Talairach and Tournoux, 1988) using the affine transformation of SPM99 (Ashburner and Friston, 1999). Affine transformation, composed of translation, rotation, and scaling, was derived to minimize intensity differences between the template and each brain image. Each manually delineated ROI map containing 1 for voxels within the ROI extent and 0 for voxels outside the ROI extent was transformed to the Talairach space using the affine transformation of the corresponding brain image. A probability map at each voxel for a given ROI was created by averaging the normalized ROI maps across the subjects. The spatial resolution of the probability maps was 1 × 1 × 1 mm in the standard brain space. The probability at a given voxel describes the percentage of subjects in which this particular voxel was included in the ROI. For example, if a voxel with a coordinate (x, y, z) has been included in a given ROI for only 1 out of 10 subjects, its probability in belonging to this ROI is 10%.
Using the above method, a total of 16 probability maps for both normal control groups and schizophrenic groups were created including STG, HG, PT, MTG, ITG, FG, PHG, HIPP, AMYG, insula (INSL), angular gyrus (AG), postcentral gyrus (PCG), supramarginal gyrus (SMG), prefrontal gyrus (PF), caudate nucleus (CAUD), and lateral ventricle (LV).
One way to quantify interindividual spatial variability of an ROI using probability maps is to compare the 50% probability volume with the mean volume of that ROI (Amunts et al., 2000). The 50% probability volume was defined as the sum of all voxels that belong to a specific ROI in at least 50% of subjects. We defined the relative 50% probability volume, for a given ROI, as the 50% probability volume normalized by the mean volume of that ROI.
For visualization of probability maps for each group, the probability of each voxel was color coded for every 10% bin of probability and superimposed on an average template used as a background image. This template was created by averaging the 22 normal control brains normalized to the MNI template. The group difference of the spatial distribution for each ROI was visualized with the probability atlas difference map by subtracting the probability map of schizophrenics from the probability map of normal controls. The statistical group difference of the probability at each voxel of the ROI was calculated by Fisher's exact test with the hypothesis of no probabilistic difference between groups and was visualized by a significance map.
We also calculated the center of mass and the orientation of each ROI in both hemispheres to determine whether the variability of each ROI was mainly caused from the variability of location, orientation, or shape. The orientation of a given ROI of a subject was derived from the principal axis of the singular value decomposition of its voxel distribution.
Nonlinear spatial normalization was also applied to the same data set to investigate the extent of spatial variation of ROIs after nonlinear warping. We used the spatial normalization algorithm of SPM99 with the kernel size of 7 × 8 × 7 because this is a widely used tool for functional imaging studies. Probability maps using nonlinear normalization for each ROI were created in a similar way to that created using linear normalization.
Results
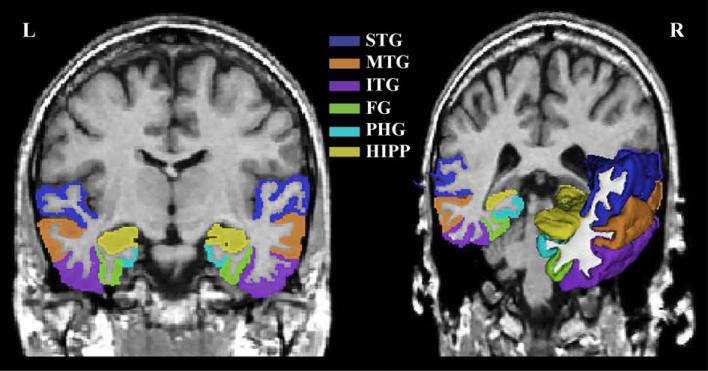
Sixteen ROIs of individual subjects were manually delineated by experts. To illustrate some of the ROIs, both a coronal slice and a three-dimensional rendering of the lateral and medial temporal lobe gyri are displayed in Fig. 1; this includes STG, MTG, ITG, FG, PHG, and HIPP ROI.
Fig. 1.
Parcellations of the temporal lobe. Superior temporal gyrus (STG), middle temporal gyrus (MTG), inferior temporal gyrus (ITG), fusiform gyrus (FG), parahippcampal gyrus (PHG), and hippocampus (HIPP) from one subject's temporal lobe show the spatial location, extent, and shape of ROIs including their interregional relationship.
Table 1 gives a summary of statistics for each ROI including the number of subjects in each group used for composing probability maps, the mean volume, and the mean center of gravity in Talairach space for each ROI. Significant left-lateralized differences in volume between schizophrenics and normal controls were found at STG, FG, and HIPP, and bilateral differences in volume were found at PT, ITG, and INSL. (We note that, because of the transformations used in this paper, these volumes differ slightly from those untransformed volumes reported by us in the literature.)
Table 1.
Summary for statistical distributions of brain regions in normal controls and schizophrenics
| ROI | Group | Number of subjects | Left hemisphere |
Right hemisphere |
Statistics (Left) |
Statistics (Right) |
||||||
|---|---|---|---|---|---|---|---|---|---|---|---|---|
| Volume | Center (x/y/z) | Volume | Center (x/y/z) | Volume | Center | Orient | Volume | Center | Orient | |||
| STG | NC | 18 | 10,937 | –54.1/–15.7/0.8 | 11,859 | 55.0/–15.7/1.3 | 0.003 | 0.48 | 0.33 | 0.34 | 0.13 | 0.91 |
| SZ | 18 | 9732 | –53.6/–15.7/0.3 | 11,349 | 55.7/–16.9/1.4 | |||||||
| HG | NC | 21 | 2166 | –47.9/–19.7/8.0 | 1811 | 47.5/–19.3/8.9 | 0.11 | 0.82 | 0.47 | 0.47 | 0.13 | 0.22 |
| SZ | 17 | 1909 | –47.5/–19.4/7.4 | 1682 | 47.3/–17.8/7.2 | |||||||
| PT | NC | 21 | 2976 | –58.5/–31.1/14.0 | 2204 | 58.1/–28.9/16.3 | 0.03 | 0.22 | 0.28 | 0.01 | 0.06 | 0.83 |
| SZ | 17 | 2517 | –58.6/–30.6/12.4 | 2686 | 58.8/–27.0/14.2 | |||||||
| MTG | NC | 17 | 13,713 | –61.1/–30.4/–9.2 | 15,236 | 59.7/–31.0/–7.9 | 0.46 | 0.14 | 0.48 | 0.034 | 0.07 | 0.97 |
| SZ | 20 | 13,259 | –60.1/–30.1/–9.2 | 14,270 | 58.9/–30.8/–9.2 | |||||||
| ITG | NC | 17 | 13,213 | –53.7/–34.8/–23.6 | 12,875 | 53.2/–36.4/–22.4 | 0.019 | 0.54 | 0.43 | 0.012 | 0.018 | 0.68 |
| SZ | 20 | 11,967 | –52.9/–34.0/–24.0 | 11,736 | 51.7/–33.7/–24.3 | |||||||
| FG | NC | 24 | 7508 | –35.1/–39.2/–22.4 | 8380 | 34.8/–40.3/–21.9 | 0.017 | 0.033 | 0.66 | 0.19 | 0.04 | 0.45 |
| SZ | 20 | 6984 | –34.1/–37.8/–23.1 | 8023 | 33.9/–39.2/–22.5 | |||||||
| PHG | NC | 11 | 2574 | –24.0/–20.4/–26.8 | 2712 | 24.1/–19.3/–27.1 | 0.07 | 0.15 | 0.07 | 0.32 | 0.17 | 0.29 |
| SZ | 14 | 2908 | –23.4/–21.2/–25.3 | 2897 | 23.3/–20.0/–25.8 | |||||||
| HIPP | NC | 18 | 4964 | –25.3/–19.1/–15.7 | 4980 | 26.4/–18.6/–15.9 | 0.001 | 0.011 | 0.39 | 0.86 | 0.12 | 0.78 |
| SZ | 18 | 4201 | –24.4/–20.3/–14.5 | 5029 | 26.3/–18.6/–15.1 | |||||||
| AMYG | NC | 18 | 2405 | –22.2/–2.8/–21.5 | 2879 | 23.2/–1.7/–22.1 | 0.23 | 0.12 | 0.33 | 0.14 | 0.66 | 0.03 |
| SZ | 18 | 2689 | –21.9/–3.8/–20.6 | 2560 | 23.2/–1.7/–21.4 | |||||||
| PCG | NC | 15 | 18,548 | –44.8/–21.2/41.0 | 18,043 | 42.9/–21.8/43.0 | 0.24 | 0.50 | 0.70 | 0.22 | 0.77 | 0.35 |
| SZ | 15 | 17,476 | –44.4/–22.1/40.4 | 17,087 | 43.3/–22.2/43.3 | |||||||
| SMG | NC | 15 | 21,426 | –54.4/–38.7/33.5 | 20,652 | 54.4/–37.2/36.7 | 0.86 | 0.50 | 0.31 | 0.58 | 0.55 | 0.46 |
| SZ | 15 | 21,661 | –54.2/–40.0/32.9 | 19,930 | 55.2/–36.5/34.6 | |||||||
| AG | NC | 15 | 11,955 | –45.2/–65.9/35.2 | 11,696 | 46.9/–62.3/37.2 | 0.20 | 0.23 | 0.25 | 0.47 | 0.88 | 0.49 |
| SZ | 15 | 10,733 | –44.6/–68.6/34.5 | 12,257 | 47.7/–61.8/36.4 | |||||||
| INSL | NC | 28 | 10,368 | –37.2/2.9/–0.2 | 10,153 | 37.0/2.4/0.1 | 0.000 | 0.96 | 0.24 | 0.004 | 0.52 | 0.94 |
| SZ | 22 | 9247 | –37.3/2.7/–0.3 | 9279 | 37.4/2.7/–0.3 | |||||||
| PF | NC | 18 | 108,749 | –25.1/38.2/12.4 | 105,797 | 24.9/38.8/12.5 | 0.71 | 0.70 | 0.78 | 0.49 | 0.42 | 0.16 |
| SZ | 11 | 110,047 | –25.4/37.9/12.3 | 108,430 | 25.4/38.7/12.4 | |||||||
| CAUD | NC | 14 | 5978 | –12.3/9.5/8.1 | 6106 | 13.8/10.1/8.5 | 0.84 | 0.26 | 0.64 | 0.86 | 0.11 | 0.79 |
| SZ | 14 | 6039 | –12.9/9.7/8.5 | 6154 | 14.5/10.5/9.3 | |||||||
| LV | NC | 25 | 10,049 | –13.8/–15.8/13.9 | 8750 | 14.7/–14.2/14.0 | 0.64 | 0.78 | 0.31 | 0.60 | 0.15 | 0.76 |
| SZ | 20 | 10,922 | –13.6/–15.4/14.3 | 9556 | 14.4/–13.7/14.8 | |||||||
Note. Probability maps in the temporal lobe for both normal controls (NC) and schizophrenia (SZ) include superior temporal gyrus (STG), Heschl's gyrus (HG), planum temporale (PT), middle temporal gyrus (MTG), inferior temporal gyrus (ITG), fusiform gyrus (FG), parahippocampal gyrus (PHG), hippocampus (HIPP), and amygdala (AMYG). Probability maps in the parietal lobe include postcentral gyrus (PCG), supramarginal gyrus (SMG), and angular gyrus (AG). Probability maps of insula (INSL), prefrontal gyrus (PF), caudate nucleus (CAUD), and lateral ventricle (LV) were also created. The mean volume is in the mm3 unit and the mean center of gravity is in the mm unit of the x (sagittal), y (coronal), and z (axial) direction from the origin of the anterior commissure (AC) in MNI-ICBM space. Statistics of Volume indicates P value (uncorrected) calculated from t test and statistics of Center (center of gravity) and Orient (orientation) indicates P values (uncorrected) calculated from Hotelling-T2 statistic. Bold characters indicate P < 0.05 showing a significant difference between normal controls and schizophrenia.
Number of women: 4 among 27 schizophrenia and 5 among 29 controls.
The FG of schizophrenics, bilaterally, was significantly more medially and anteriorly located than controls. The left HIPP in schizophrenics, compared with controls, was located more medially, posteriorly, and dorsally (P = 0.011). Orientation differences of principal direction of shape between schizophrenics and controls were found only in the right AMYG. Other ROIs did not show group differences in volume, location, or orientation. It should be noted that most of the volumetric differences were localized primarily in the temporal lobe ROI.
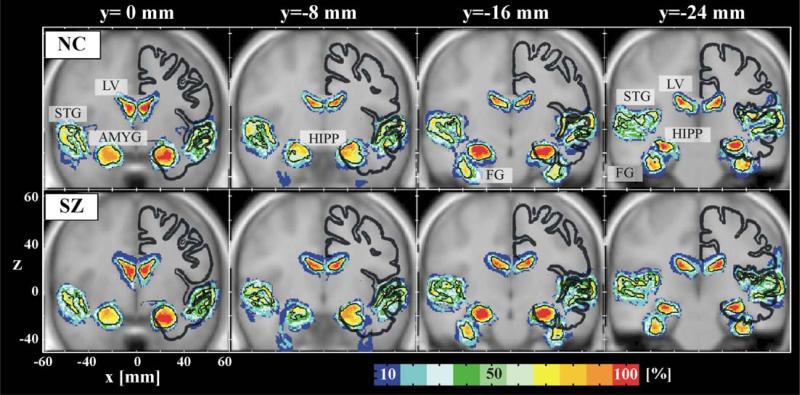
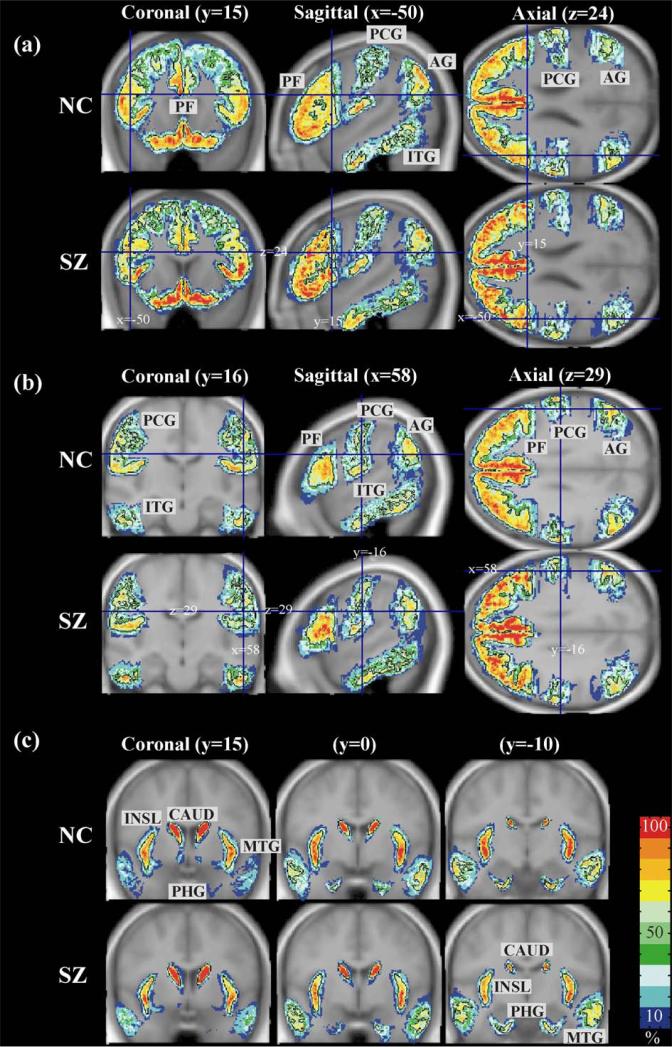
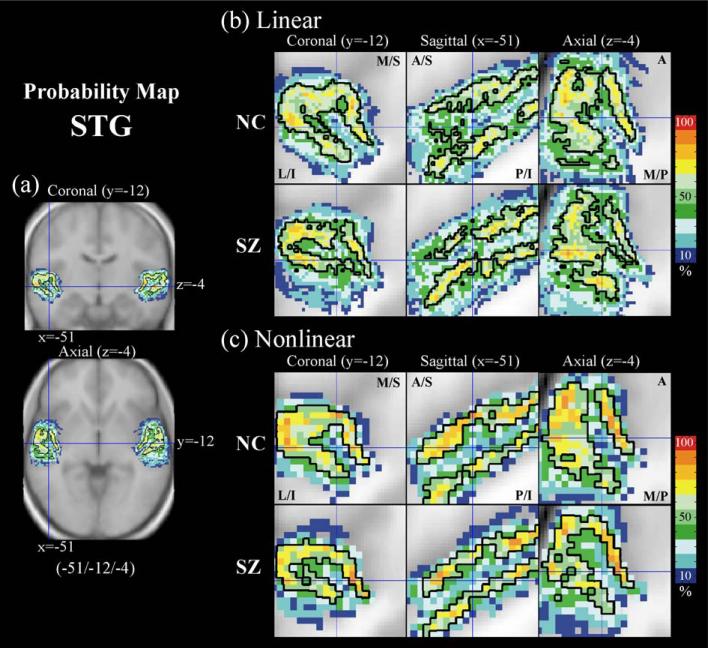
Selected slices of statistical probability maps of normal controls and schizophrenia are displayed in Figs. 2 and 3, and more detailed views of the STG are shown in Figs. 4 and 5.
Fig. 2.
Probability atlas maps of the superior temporal gyrus (STG), amygdala (AMYG), hippocampus (HIPP), fusiform gyrus (FG), and lateral ventricles (LV). The probability maps are color coded for every 10% bin of probability. The average brain of normal controls (NC) registered to MNI-ICBM152 brain is usedas a background image. The first row shows the maps of normal controls and the second row shows those of schizophrenics (SZ). The thick dark lines show the Talairach brain at the corresponding coronal plane. The black lines in the maps indicate 50% probability. Note the lesser variability of LV, AMYG, and HIPP compared with STG.
Fig. 3.
Probabilistic atlas maps of brain regions. Probability maps of prefrontal (PF), inferior temporal gyrus (ITG), postcentral gyrus (PCG), and angular gyrus (AG) are displayed in (a) for normal controls (NC) and schizophrenia (SZ) at (a) (x = –50/y = 15/z = 24) and b (x = 58/y = –16/z = 29). (c) shows probability maps of the insula (INSL), caudate nucleus (CAUD), middle temporal gyrus (MTG), and parahippocampal gyrus (PHG) at y = 5 mm, y = 0 mm, y = –10 mm in coronal plane. Each map has the black borderline of 50% probability overlain on the probability maps.
Fig. 4.
Probability atlas map of the superior temporal gyrus (STG). The enlarged maps show the difference of probability distribution between normal controls (NC) and schizophrenics (SZ) in the left STG at the MNI coordinate (–51/–12/–4). (a) shows the location of left STG in the full brain view, (b) and (c) show the probability maps created using linear normalization (b) and nonlinear normalization (c) of SPM99. The black lines in the maps indicate 50% probability. Nonlinear normalization reduced misalignment but different patterns of spatial variation exist across group. L: lateral, M: medial, S: superior, I: inferior, A: anterior, P: posterior.
Fig. 5.
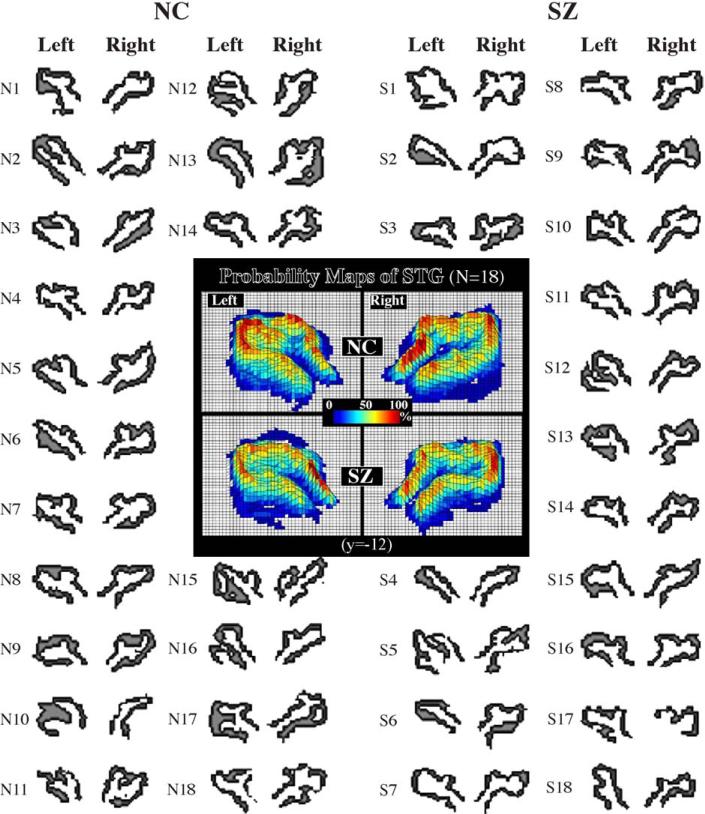
Interindividual anatomical variations and probability atlas map of superior temporal gyrus (STG) after nonlinear normalization. Spatially normalized STGs of both normal controls (NC) and schizophrenics (SZ) are displayed in coronal slice with MNI coordinate (y = –12 mm). N1–N18 are control subjects and S1–S18 are schizophrenic subjects.
Fig. 2 shows coronal plane probability maps of STG, AMYG, HIPP, and LV (y direction of MNI space; y = 0, –8, –16, –24 mm). The visual impression is that, compared with controls, schizophrenics appear to have larger LVs and reduced consistency of probability mapping in the STG. This figure also shows that the Talairach brain, whose outline is displayed with thick dark lines in the right hemisphere, is smaller than the MNI-ICBM template, consistent with Brett et al. (2002).
Figs. 3a and b show slices of probability maps for normal controls and schizophrenics for the prefrontal lobe (PF), inferior temporal gyrus (ITG), postcentral gyrus (PCG), and angular gyrus (AG), while Fig. 3c displays probability maps for the middle temporal gyrus (MTG), insula (INSL), parahippocampus (PHG), and caudate nucleus (CAUD). The visual impression is one of more variability for both groups in neocortical gyri than in the more central structures of the insula and the caudate.
In Fig. 4, an enlarged view is shown of STG probability maps at coronal (y = –12 mm), sagittal (x = –51 mm), and axial (z = –4 mm) planes. Fig. 4a shows a coronal view (y = –12) with the vertical and horizontal lines indicating the sagittal and axial planes, respectively, and an axial view (z = –4) with the vertical and horizontal lines indicating the sagittal and coronal views, respectively. Fig. 4b shows displays of STG probability maps of both normal controls and schizophrenics generated after applying a linear transformation to the individual cases. The visual impression from Fig. 4b is that there is greater spatial variability in the STG in the schizophrenic group, revealed by the smaller and more compressed, or shrunken, C-shaped pattern in the 50% probability line. Furthermore, this visual impression, at the same slice levels, did not change when the probability maps for the STG were generated after applying a nonlinear transformation to the individual cases suggesting that anatomical variation, especially in the schizophrenic group, cannot be eliminated completely even with the use of nonlinear transformation methods. In Fig. 5, the individual normal control and schizophrenic (nonlinear-transformed) STG ROIs used for creating Fig. 4c are listed, showing that even with the use of low dimensional nonlinear normalization anatomical variation is not fully eliminated, presumably because of its failure to remove topological variations between subjects.
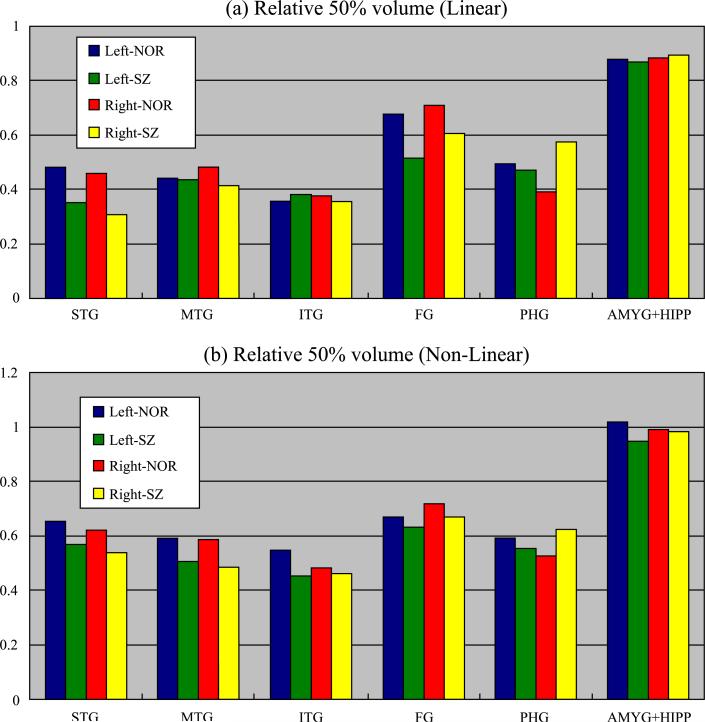
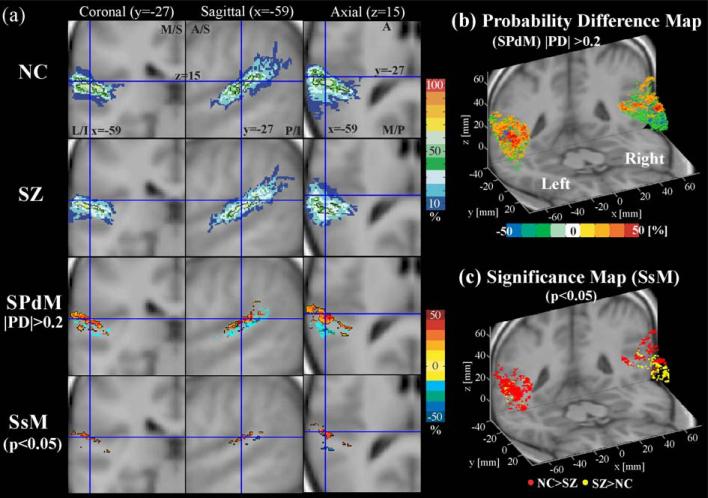
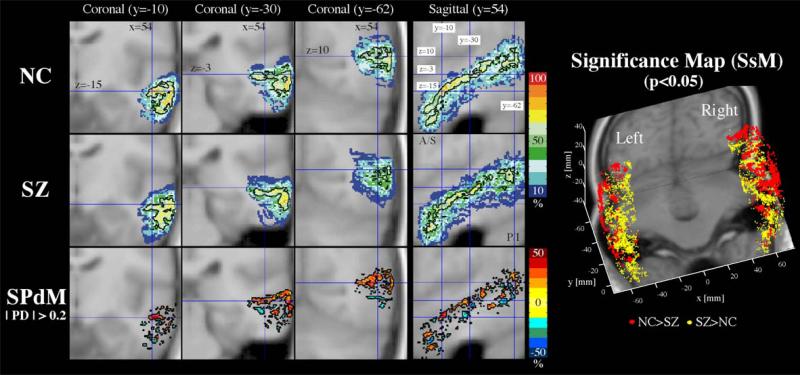
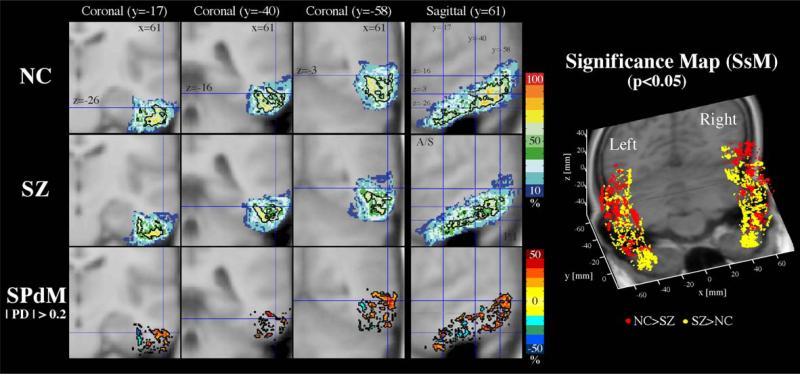
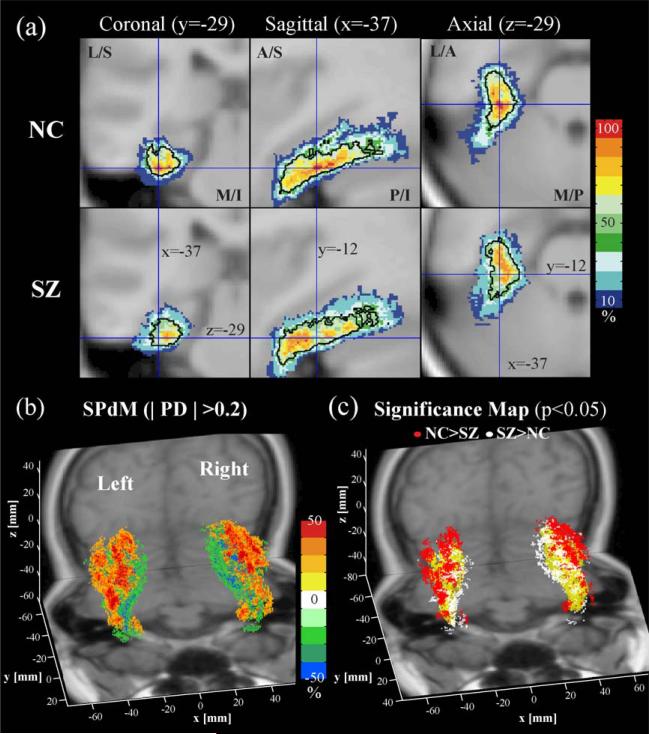
The difference between the probability maps for each ROI between normal controls and schizophrenia can be assessed, in a global way, by the use of 50% probability volumes normalized by the mean volume (relative 50% probability volumes) and cumulative distributions of probability (Fig. 6 and Table 2). These differences can be assessed with voxel-wise comparisons by the use of statistical probability difference maps and statistical significance maps (see Figs. 7–12).
Fig. 6.
Relative 50% probability volumes for brain regions. The 50% probability volumes were defined as all those voxels that in at least 50% of subjects belong to the specific ROI. The relative 50% probability volume for a given ROI is defined as the 50% probability volume normalized by the mean volume of that ROI. (a) is the relative 50% probability volumes after linear normalization and (b) is the relative 50% volume after nonlinear normalization.
Table 2.
Cumulative distribution of probability and the distribution of probability difference
| ROI | Group | Cumulative distribution |
Probability difference |
||||||||||
|---|---|---|---|---|---|---|---|---|---|---|---|---|---|
| Left hemisphere |
Right hemisphere |
Left hemisphere |
Right hemisphere |
||||||||||
| P > 0.25 | P > 0.5 | P > 0.75 | P > 0.25 | P > 0.5 | P > 0.75 | NC > SZ | NC = SZ | NC < SZ | NC > SZ | NC = SZ | NC < SZ | ||
| STG | NC | 19,436 | 5263* | 73 | 20,610 | 5450* | 135 | 9226 | 28,415 | 6863 | 9084 | 32634 | 10,011 |
| SZ | 17,422 | 3423 | 127 | 20,303 | 3481 | 66 | r = 0.29* | r = –0.09 | |||||
| HG | NC | 3164 | 520* | 14 | 2292 | 646* | 25 | 2047 | 2,001,444 | 1421 | 1995 | 2,001,116 | 1801 |
| SZ | 2351 | 403 | 7 | 2063 | 295 | 1 | r = 0.36* | r = 0.10 | |||||
| PT | NC | 3495 | 419 | 1 | 2007 | 174 | 1 | 3402 | 1,999,238 | 2272 | 1632 | 1,999,369 | 3911 |
| SZ | 2867 | 382 | 2 | 2505 | 147 | 0 | r = 0.40* | r = –0.87* | |||||
| MTG | NC | 21,031 | 6050 | 479 | 25,146 | 7358* | 443 | 12785 | 44,808 | 9878 | 14,989 | 47,768 | 9341 |
| SZ | 25,302 | 5816 | 149 | 27,251 | 5890 | 128 | r = 0.26* | r = 0.46* | |||||
| ITG | NC | 21,559 | 4715 | 201 | 20,045 | 4860 | 178 | 14689 | 40,671 | 9812 | 14,362 | 39,638 | 9949 |
| SZ | 22,574 | 4554 | 115 | 22,256 | 4184 | 85 | r = 0.40* | r = 0.36* | |||||
| FG | NC | 12,423 | 5100* | 795 | 13,484 | 5959* | 1319 | 7221 | 22,386 | 5661 | 6782 | 24,511 | 5796 |
| SZ | 11,626 | 3596 | 437 | 13,151 | 4859 | 1124 | r = 0.24* | r = 0.16 | |||||
| PHG | NC | 4445 | 1281 | 101 | 4877 | 1057 | 54 | 2238 | 8023 | 3828 | 2544 | 8787 | 3220 |
| SZ | 4824 | 1365 | 41 | 4344 | 1671* | 47 | r = –0.52* | r = –0.23 | |||||
| HIPP | NC | 6780 | 4329 | 2316 | 6925 | 4520 | 2381 | 5666 | 7774 | 2281 | 3058 | 8956 | 3285 |
| SZ | 5938 | 3649 | 1750 | 7201 | 4706 | 2174 | r = 0.85* | r = –0.07 | |||||
| AMYG | NC | 3507 | 2134 | 932 | 4077 | 2421 | 1247 | 1246 | 4617 | 2522 | 2634 | 5719 | 862 |
| SZ | 3879 | 2346 | 1142 | 3461 | 2094 | 1181 | r = –0.68* | r = 1.01 | |||||
| PCG | NC | 32,703 | 6391 | 521 | 31,831 | 6330 | 465 | 20915 | 1,968,230 | 15,767 | 20,092 | 1,969,462 | 15,358 |
| SZ | 29,703 | 5995 | 554 | 28,758 | 5619 | 409 | r = 0.28* | r = 0.27* | |||||
| SMG | NC | 36,799 | 13,789 | 1979 | 34,221 | 13,337 | 2086 | 17442 | 1,969,100 | 18,370 | 18,551 | 1,970,330 | 16,031 |
| SZ | 36,886 | 13,477 | 1668 | 34,779 | 11,754 | 1215 | r = –0.05 | r = 0.15 | |||||
| AG | NC | 19,007 | 5770* | 676 | 19,305 | 5205 | 463 | 14474 | 1981,729 | 8709 | 9528 | 1,983,517 | 11,867 |
| SZ | 17,045 | 4170 | 357 | 20,397 | 6155 | 538 | r = 0.50* | r = –0.22* | |||||
| INSL | NC | 15,529 | 9005 | 3996 | 14,985 | 8968 | 3989 | 7466 | 22,562 | 2563 | 7029 | 21,553 | 3164 |
| SZ | 13,699 | 8424 | 2984 | 13,521 | 8474 | 3448 | r = 0.98* | r = 0.76* | |||||
| PF | NC | 164,804 | 115,560 | 45,064 | 160,242 | 112,172 | 43,142 | 59337 | 1,884,079 | 61,496 | 53,903 | 1,889,022 | 61,987 |
| SZ | 169,520 | 108,969 | 43,024 | 166,654 | 109,510 | 43,496 | r = 0.10 | r = –0.14 | |||||
| CAUD | NC | 8333 | 5239 | 3427 | 8359 | 5442 | 3687 | 2852 | 1,999,408 | 2652 | 3521 | 1,998,167 | 3224 |
| SZ | 8336 | 5439 | 3383 | 8441 | 5714 | 3621 | r = 0.07 | r = 0.09 | |||||
| LV | NC | 14,268 | 8042 | 3531 | 12,013 | 7048 | 3536 | 3029 | 30,377 | 6341 | 2614 | 26,663 | 5498 |
| SZ | 15,046 | 9099 | 4575 | 13,398 | 7443 | 3925 | r = –0.71* | r = –0.71* | |||||
Note. In cumulative distribution, P > 0.25, P > 0.5, and P > 0.75 indicate the number of voxels that have population frequencies higher than 25%, 50%, and 75%, respectively. Values of difference distribution show number of voxels of the probability difference (PD) between normal controls (NC) and schizophrenics(SZ), divided into three subregions, 10% < PD (NC > SZ), –10% < PD < 10% (NC = SZ), and PD < –10% (SZ > NC). In cumulative distribution P > 0.5, the bold face with an asterisk indicates where the ratio of cumulative 50% volume between normal controls and schizophrenia, defined by (NC – SZ) / (NC + SZ) / 2, shows higher than 0.2 (NC has more voxels than SZ) or lower than –0.2 (SZ has more voxels than NC). The difference ratio r in probability difference is defined as (NC – SZ) / (NC + SZ) / 2 and the bold face with an asterisk indicates where the ratio is higher than 0.2 (ROI contains more, by r = 0.2, voxels where probability of NC has higher than that of SZ) or lower than –0.2 (ROI contains more, by r = 0.2, voxels where probability of SZ has higher than that of NC). Note that above values are not normalized by the average volume, like the relative 50% volume in Fig. 6.
Fig. 7.
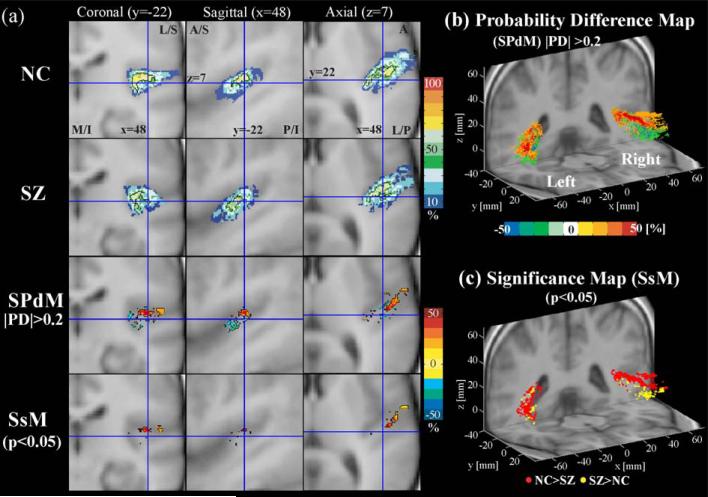
Probability maps of Heschl's gyrus. For Heschl's gyrus, probability atlas maps (upper two rows in a), probability difference maps (SPdM, third row in a and b), and probability significance map (SsM, at the fourth row in a and at c) are displayed. In SPdM, the positive values with hot colors indicate the voxels where normal controls (NC) have higher probability than schizophrenics (SZ), while the negative values with cold colors indicate the voxels where schizophrenics show higher probability than normal controls. PD is the probability difference between NC and SZ, that is, probability of NC—probability of SZ, at the voxel. We displayed the ranges where the difference of probability was higher than 20% for visualization purpose (|PD| > 0.2). The SsM's were derived by applying Fisher's exact test to all voxels. The SsM in (a) is displayed overlain with SPdM, hot color level indicating NC has a higher probability than SZ in the voxel, while cold colors indicating conversely. In (c), the red dots indicate normal controls have a higher probability than schizophrenics while yellow dots indicate conversely with P < 0.05 (uncorrected). L: lateral, M: medial, S: superior, I: inferior, A: anterior, P: posterior.
Fig. 12.
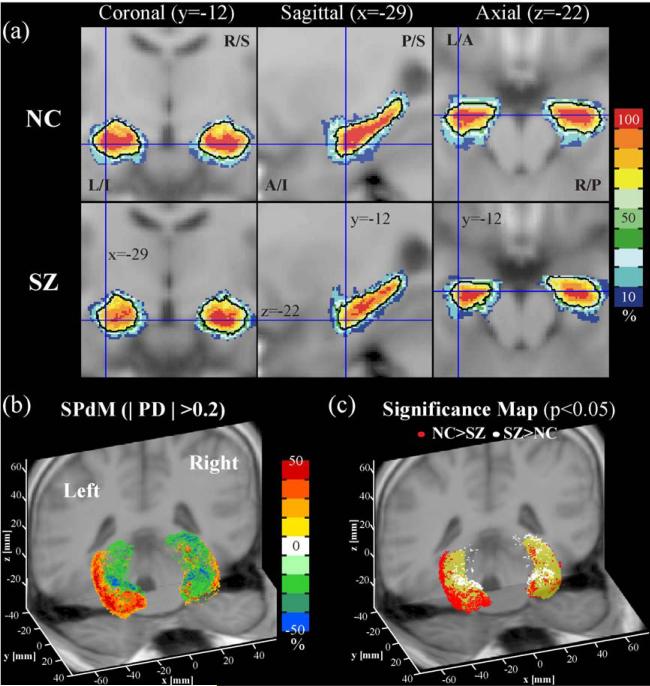
Probability maps of the hippocampus. For the hippocampus, slices of probability atlas maps of normal controls (NC) and schizophrenia (SZ) are displayed in (a). Probability difference map (SPdM in b), derived from subtracting probability of NC with probability of SZ, and probability significance map (c), derived from Fisher's exact test, are displayed in three-dimensional space. The red dots indicate normal controls have higher probability than schizophrenics while white dots indicate conversely with P < 0.05 (uncorrected). These significance maps are displayed on the rendering of 50% probability volume (yellow color). L: left, R: right, S: superior, I: inferior, A: anterior, P: posterior.
Fig. 6a shows the relative 50% probability volumes of each ROI after linear registration. Whereas the 50% probability volumes of bilateral amygdala–hippocampal complex (AMYG + HIPP) of normal controls occupied about 88% of the mean volume of the area, the 50% probability volume of bilateral STG occupied only 47%. In general, the medially located ROIs and thicker volumetric ROIs showed lower spatial variation. Moreover, ROIs in schizophrenics, compared with normal controls, tended to show more spatial variation, indicated by smaller relative 50% probability volumes. For example, while the 50% volume of bilateral STG in normal controls was 47% of the mean volume, the 50% volume of schizophrenics was only 33% of the mean volume.
Additionally, as shown in Fig. 6b, for all ROIs, nonlinear normalization increased the relative 50% probability volume in both groups. For example, in the left STG, in normal controls, the relative 50% volume was increased from 47% to 65% after application of nonlinear normalization. Once again, we found that laterally located cortical structures still had a large degree of misalignment, even after nonlinear normalization, while more medially located subcortical structures showed a higher degree of alignment, and hence, had greater relative 50% probability volumes.
The group differences of the cumulative probability volumes and volumes of the probability difference between the normal controls and schizophrenic groups for each ROI in each hemisphere are summarized in Table 2.
The cumulative numbers of voxels having above 25% (>0.25), above 50% (>0.5), and above 75% (>0.75) probability have been calculated for each ROI of each group independently. Focusing on >50% probability of overlap, we found the normal control group had more cumulative voxels with >50% probability than the schizophrenia group in bilateral STG, especially HG, bilateral FG, right MTG, and left AG with the criteria of the volumetric ratio between controls and schizophrenics defined as a ratio of (NC – SZ) / (NC + SZ) / 2, above 0.2.
With regard to probability differences of overlap at each voxel in the ROI, results varied for different ROIs. Certain ROIs contained more voxels where the probability of overlap in the normal control group surpassed that of schizophrenics by >10% than those ROI voxels where the probability of the schizophrenics surpassed that of normal controls by >10%. These ROIs included the left STG (left HG and left PT), bilateral MTG, ITG, PCG, and INSL, and left FG, HIPP, and AG. Conversely, other ROIs included more voxels where the probability of schizophrenics was higher than that of normal controls by over 10%. These ROIs included right PT, left PHG, left AMYG, right AG, and bilateral LV. Note that for the probability difference findings, group differences between controls and schizophrenics were particularly apparent in temporal lobe ROIs, especially on the left side, compared with other brain ROIs.
The localized difference in the spatial distribution of ROIs in the temporal lobe between normal control group and schizophrenia is displayed in Figs. 7–12. The temporal ROIs include subregions of superior temporal gyrus (Heschl's gyrus (Fig. 7), planum temporale (Fig. 8)), middle temporal gyrus (Fig. 9), inferior temporal gyrus (Fig. 10), fusiform gyrus (Fig. 11), and hippocampal gyrus (Fig. 12). The voxel-wise localization of statistical difference in probability for each ROI is visualized by the statistical probability difference map (SPdM) and its statistical significance map (SsM) in three-dimensional space as well as in slices of the probability map of a given ROI.
Fig. 8.
Probability maps of the planum temporale. For planum temporale, probability atlas maps (upper two rows in a), probability difference maps (SPdM, third row in a and b), and probability significance map (SsM, at the fourth row in a and at c) are displayed. For detailed explanation on the SPdM and SsM, see the legend of Fig. 7.
Fig. 9.
Probability maps of the middle temporal gyrus. For middle temporal gyrus, coronal slices of probability atlas maps (upper two rows) and probability difference map (SPdM, third row) are displayed in the left panel and the probability significance maps (SsM, in the right panel) are displayed in three-dimensional space. For detailed explanation on the SPdM and SsM, see the legend of Fig. 7.
Fig. 10.
Probability maps of the inferior temporal gyrus. For the inferior temporal gyrus, coronal slices of probability atlas maps (upper two rows), and probability difference map (SPdM, third row) are displayed in the left panel and the probability significance maps (SsM, in the right panel) are displayed in three-dimensional space. For detailed explanation on the SPdM and SsM, see the legend of Fig. 7.
Fig. 11.
Probability maps of the fusiform gyrus. For the fusiform gyrus, slices of probability atlas maps of normal controls (NC) and schizophrenia (SZ) are displayed in (a). Probability difference map (SPdM in b), derived from subtracting probability of NC with probability of SZ, and probability significance map (c), derived from Fisher's exact test, are displayed in three-dimensional space. The red dots indicate normal controls have a higher probability than schizophrenics while white dots indicate conversely with P < 0.05 (uncorrected). These significance maps are displayed on the rendering of 50% probability volume (yellow color).
For Heschl's gyrus (Fig. 7) and planum temporale (Fig. 8), there is a pattern that normal controls have higher probability at dorsal posterior regions while schizophrenics have higher probability at ventral anterior regions. This is more typical in the right hemisphere Heschl's gyrus and left hemisphere planum temporale. Note no volume, location, or orientation difference in Heschl's gyrus, and only a bilateral volume difference in the planum temporale. Both regions in the left hemisphere show more voxels with higher probability in controls compared with schizophrenics, indicating greater spatial variance in schizophrenia in the left hemisphere, but the right hemisphere planum temporale showed more voxels with higher probability in schizophrenia, indicating less spatial variance in this group in the right hemisphere, as is shown in Fig. 8b and consistent with Table 2.
In Fig. 9, the middle temporal gyri of schizophrenics are shown to have a tendency for lower probability of overlap at the lateral regions of the left hemisphere and the dorsolateral regions, especially in the posterior part of the right hemisphere. Conversely, schizophrenics are shown to have higher probability of overlap at the medial side of the middle temporal gyrus in both hemispheres.
The inferior temporal gyrus (Fig. 10) has a similar pattern with the middle temporal gyrus, having a tendency of lateral prevalence in normal controls, especially in the posterior part of the ROI. We found a tendency for ventral medial regions in the middle zone and ventral regions in the anterior zone of inferior temporal gyrus to show higher probability in schizophrenia. This localized difference might be related to the difference in center of ROI in addition to the difference in volume between groups (Tables 1 and 2) as the center of right side ITG in controls is located laterally, superiorly, and posteriorly compared with schizophrenics (Table 2).
The most prominent localized difference in probability maps between the control and the schizophrenic groups was found in fusiform gyrus (Fig. 11) and hippocampal gyrus (Fig. 12). Higher probability of fusiform gyrus is located at the lateral and dorsal regions, bilaterally, in the hemispheres of normal controls compared with schizophrenia (Figs. 11b and c). Fig. 12 also shows that the left hippocampus of normal controls has higher probability at the ventrolateral and anterior regions, which show a significant overlap difference, compared with schizophrenics, with as much as 30–50% differences (Fig. 12b). This difference may also be related with the finding in Table 1 that shows a significant difference in the volume size and the center of gravity of the left hippocampus between schizophrenics and normal controls.
Discussion
Probability maps of first-episode schizophrenia
Many researches have shown individual variability in the anatomy of the normal brain (Amunts et al., 1999, 2000; Kennedy et al., 1998; Leonard et al., 1998; Loftus et al., 1995; Paus et al., 1996; Penhune et al., 1996; Rademacher et al., 2001a,b, 2002; Thompson et al., 1996a; Tomaiuolo et al., 1999; Varnavas and Grand, 1999; Westbury et al., 1999; White et al., 1997). We examined here for the first time the spatial distribution of brain structures in first-episode schizophrenia and demonstrated how this distribution differed from normal controls. The present study showed not only individual variations in the normal control group but also showed that the schizophrenia group manifested significant differences in the pattern of spatial variation in comparison with the control group.
We found two major findings in temporal lobe brain structures in schizophrenia. First, examining the relative 50% probability volume, a global measure of overlap, we found the (1) superior temporal gyrus and fusiform gyrus, bilaterally, showed smaller relative 50% volume in schizophrenia than in normal controls; (2) middle temporal gyrus, inferior temporal gyrus, and amygdala–hippocamps did not show a group difference; and (3) parahippocampal gurus did not show a group difference in the left hemisphere but in the right, where schizophrenics showed a larger relative 50% probability volume. Second, examining probability difference maps, which reveal the local overlap difference between groups at each voxel, we found that, in schizophrenia as compared with the control group: (1) Heschl's gyrus and planum temporale (parts of superior temporal gyrus) showed a significantly lower overlap probability dorsally and posteriorly in both hemispheres; (2) middle temporal gyrus and inferior temporal gyrus showed bilaterally lower probability; (3) fusiform gyrus showed significantly lower overlap probability dorsolaterally in both hemispheres; and (4) hippocampus showed significantly lower overlap probability laterally and anteriorly in the left hemisphere. In general, in schizophrenia, temporal lobe substructures showed lower overlap probabilities in dorsolateral regions in the stereotaxic space than in controls.
In addition, we examined the relative importance of three major factors, that is, mean volume, location, and orientation that affect the probability distribution of the above structures. In the superior temporal gyrus, we found that volume was smaller in the left hemisphere in schizophrenia but there were no group differences in location or orientation. Middle temporal gyrus showed smaller mean volume in the right hemisphere in schizophrenia and inferior temporal gyrus showed bilateral volume reduction and a right hemisphere location difference in schizophrenia. Fusiform gyrus showed significant group volume and location differences in the left hemisphere and a group location difference in both hemispheres. As regards location in first-episode schizophrenics, the mean center of fusiform gyrus was located medially, anteriorly, and ventrally, and the mean center of hippocampus was located medially, posteriorly, and superiorly relative to the control population. The volume and location difference between schizophrenics and controls may explain the significant overlap probability difference between the two groups in that ventrolateral and anterior regions of left hippocampus and lateral and dorsal regions of bilateral fusiform gyrus in schizophrenia showed lower probability than did controls. A given structure, such as the right superior temporal gyrus, that showed a group-overlap-probability difference but no group difference in volume, location, or orientation factors could be explained by group differences in a mixture of such factors, none by itself significant, or it could be due to a variation in shape between groups that was not measured in this study. Therefore, using the probability maps alone, it is not easy to conclude which group has higher intragroup variability in terms of each individual factor (volume, location, orientation, and shape). However, the probability maps used by us do provide information relevant to the overall anatomical variability of a specific region. For example, comparing the more medially located hippocampus or caudate nucleus regions with the more laterally located superior temporal gyrus showed that in both schizophrenics and normal controls the relative 50% probability volume was higher (see Fig. 6). This suggests that the former two structures have a more homogeneous spatial distribution. Similarly, lower relative 50% probability volume values for the superior temporal gyrus in schizophrenics, compared with normal controls, indicate that in the schizophrenic group there was greater spatial variation for this structure.
The fact that we were able to demonstrate differences in probability maps between first-episode schizophrenic subjects and normal controls suggests that these differences occur early in the illness and are not the result of confounding factors such as chronic neuroleptic medication use, the effects of chronic institutionalization, poor nutrition, or chronic substance abuse. This is consistent with the large body of neuroimaging information pointing to anatomical abnormalities in first-episode schizophrenia that have been investigated actively during the last decade. (For reviews of MRI in schizophrenia, see (McCarley, 2002; Shenton et al., 2001).)
Our probability maps are based on our previous ROI studies that had relatively small sample sizes due to the labor-intensive nature of the manual parcellation approach we used to delineate ROIs and due to the limited size of matching group samples between our first-episode schizophrenics and normal controls. We expect that with a larger database, which we are presently collecting, the accuracy of our analyses might improve. We do not discount the variability errors for ROIs caused from the sterotaxic registration procedure itself applied to individual subjects. However, other potential sources of variability, the effects of age and gender, for the probability difference maps are expected to be minimized because subjects of both groups were matched for age and gender.
The numbers of female subjects in our database were 4 among 27 schizophrenics and 5 among 29 controls. As these numbers were small, we have not performed separate analyses on women subjects alone. As our database expands, we believe it would be interesting to do such subgroup analyses based upon both gender and age.
Spatial normalization and spatial variability
An ideal nonlinear spatial registration may match anatomically corresponding structures perfectly between subjects and groups, but this may not be possible due to topological interindividual variability of cortical structures. Moreover, anatomical correspondence in nonlinear registration is dependent on the matching strategy of the algorithm and is also difficult to assess due to lack of a gold standard to compare with (Brett et al., 2002). Therefore, in this study, we applied the affine registration as a spatial normalization method in creating the probability maps because we wanted to preserve anatomical variability after transforming brains to a stereotaxic space and to avoid the probability maps being highly dependent on the nonlinear registration algorithm. However, it is important to understand how nonlinear normalization effects on the probability distribution of schizophrenics and controls differ because most functional imaging studies are based on the basic assumption that spatial normalization minimizes anatomical confounding factors to a similar degree for both groups. Nonlinear normalization, as predicted, increased the relative 50% probability volume of ROIs in both groups (see Fig. 6b). However, we still found the pattern that laterally located cortical structures had larger degrees of misalignment compared with more medial subcortical structures (e.g., see Fig. 5 for individual variation of the laterally located superior temporal gyrus). This spatial variation can be explained either by limited performance of the registration algorithm or by interindividual anatomical variability, or both. Most ROIs in schizophrenia showed lower alignment even after nonlinear normalization. This may indicate higher heterogeneity in the spatial distribution of ROIs within the schizophrenic group compared with the control group. This finding suggests that care should be taken, especially, for studies comparing functional activation between normal controls and schizophrenia because inconsistent registration between groups, due to anatomical intergroup variability, can make a difference in findings and interpretations (Brett et al., 2002).
Probability maps and their application
Recent techniques of high dimensional nonlinear warping make it possible to derive deformation fields from a parcellated brain and to create probability atlases. However, the continuous nature of a deformation field on the same topographic space does not allow ‘the conservation of the topographic uniqueness’ of the individual brain on which the general definition of ROIs has been based (Caviness et al., 1996; Kim et al., 2000; Rademacher et al., 1992). Therefore, probabilistic atlasing methods based on a template parcellation may not be efficient in capturing intersubject topological variability. A surface-based coordinate system is another scheme for creating statistical probabilistic maps to overcome ambiguity on voxel-based Talairach space (Dale and Sereno, 1993; Fischl et al., 1999; Thompson et al., 1996a,b). However, a surface-based method, in general, cannot provide representation of subcortical structures in a standard coordinate system.
Our probability maps are generated by transforming manual parcellations of structural MRIs to a stereotaxic space, avoiding parcellation errors associated with automated methods. With respect to probability maps generated from postmortem brains (Amunts et al., 1999, 2000; Rademacher et al., 2001b; Talairach and Tournoux, 1988), we note that such brains have volumes that are likely to be reduced by loss of vascular volume or by fixation. It is also hard to generate multiple regions of interest. In contrast, our macroscopic probability maps are derived from in vivo volumes. We suggest that the advantages of our statistical maps include the following factors: (1) the maps are created from first-episode schizophrenic subjects, that is, a homogeneous group with minimal neuroleptic exposure; (2) the regions of interests are precisely delineated with high interrater reliability and with the same methodology; and (3) multiple regions of interests are used simultaneously from identical subjects in the group.
The application of probability maps to first-episode schizophrenia can be useful for functional neuroimaging studies for this group. As Kang et al. (2001) noted in their PET study, not only probability maps of the normal control group, but also group-specific probability maps are important in the functional analysis of the pathological group. Considering structure–function relationships, functional intersubject or intergroup variation (Dehaene et al., 1997; Desmond and Glover, 2002) must be explored in relation to anatomic variation. For example, a display of functional activation maps on the anatomical probability map of schizophrenia, instead of on an individual brain, would assist in providing more reliable information to interpret such findings. This approach would be especially useful for the analysis of regions with high spatial variability such as temporal lobe regions in first-episode schizophrenia. In addition, the extent of spatial distribution for ROIs could also be used to determine the smoothing kernel size that is specific to the expected location of the activation. Thus, the effect of the misregistration in functional studies could be minimized without a large loss of spatial resolution.
Another application for probability maps can be found in the automated parcellation of ROIs and in automated image registrations. For example, probability maps of gray matter, white matter, and cerebrospinal fluid were used for image registration and segmentation in SPM99 (Ashburner and Friston, 1999). Our group has worked on the automated segmentation of cortical subregions using a probabilistic atlas (Pohl et al., 2002; Rexilius, 2001). The probability maps generated for first-episode schizophrenics are believed to be advantageous for the automated segmentation of ROIs in this group.
Conclusion
In the present study, we addressed statistical probability maps of 16 ROIs in first-episode schizophrenia and in matched normal controls. Probability maps showed different spatial distributions in first-episode schizophrenia compared with normal controls. The distribution patterns are also specific to ROIs, which imply that the focal activations that are found in functional neuroimaging studies have limitations in the direct comparison of a pathological group, such as schizophrenia, with control subjects in the Talairach coordinate system. Therefore, analysis of probabilistic distributions of ROIs in specific pathological groups should be considered.
Acknowledgments
We gratefully acknowledge the support of the Post-doctoral Fellowship Program of Korea Science & Engineering Foundation (KOSEF) (HJP), William F. Milton Fund (JJL), National Alliance for Research on Schizophrenia and Depression (MK), the National Institutes of Health (K02 MH 01110 and R01 MH 50747 to MES, and R01 MH 58704 to DFS, R01 MH 40799 to RWM), the Department of Veterans Affairs Merit Awards (MES, RWM), the MIND Institute (Albuquerque, RWM), and the National Center for Research Resources (11747 to RK and P41-RR13218 to FAJ).
References
- Amunts K, Schleicher A, Burgel U, Mohlberg H, Uylings HB, Zilles K. Broca's region revisited: cytoarchitecture and intersubject variability. J. Comp. Neurol. 1999;412(2):319–341. doi: 10.1002/(sici)1096-9861(19990920)412:2<319::aid-cne10>3.0.co;2-7. [DOI] [PubMed] [Google Scholar]
- Amunts K, Malikovic A, Mohlberg H, Schormann T, Zilles K. Brodmann's areas 17 and 18 brought into stereotaxic space—Where and how variable? NeuroImage. 2000;11(1):66–84. doi: 10.1006/nimg.1999.0516. [DOI] [PubMed] [Google Scholar]
- Ashburner J, Friston KJ. Nonlinear spatial normalization using basis functions. Hum. Brain Mapp. 1999;7(4):254–266. doi: 10.1002/(SICI)1097-0193(1999)7:4<254::AID-HBM4>3.0.CO;2-G. [DOI] [PMC free article] [PubMed] [Google Scholar]
- Brett M, Johnsrude IS, Owen AM. The problem of functional localization in the human brain. Nat. Rev., Neurosci. 2002;3(3):243–249. doi: 10.1038/nrn756. [DOI] [PubMed] [Google Scholar]
- Caviness VS, Jr., Meyer J, Makris N, Kennedy DN. MRI-based topographic parcellation of human neocortex: an anatomically specified method with estimate of reliability. J. Cogn. Neurosci. 1996;8:566–587. doi: 10.1162/jocn.1996.8.6.566. [DOI] [PubMed] [Google Scholar]
- Csernansky JG, Joshi S, Wang L, Haller JW, Gado M, Miller JP, Grenander U, Miller MI. Hippocampal morphometry in schizophrenia by high dimensional brain mapping. Proc. Natl. Acad. Sci. U. S. A. 1998;95(19):11406–11411. doi: 10.1073/pnas.95.19.11406. [DOI] [PMC free article] [PubMed] [Google Scholar]
- Dale AM, Sereno MI. Improved localization of cortical activity by combining EEG and MEG with MRI cortical surface reconstruction: a linear approach. J. Cogn. Neurosci. 1993;5(2):162–176. doi: 10.1162/jocn.1993.5.2.162. [DOI] [PubMed] [Google Scholar]
- Dehaene S, Dupoux E, Mehler J, Cohen L, Paulesu E, Perani D, van de Moortele PF, Lehericy S, Le Bihan D. Anatomical variability in the cortical representation of first and second language. NeuroReport. 1997;8(17):3809–3815. doi: 10.1097/00001756-199712010-00030. [DOI] [PubMed] [Google Scholar]
- Desmond JE, Glover GH. Estimating sample size in functional MRI (fMRI) neuroimaging studies: statistical power analyses. J. Neurosci. Methods. 2002;118(2):115–128. doi: 10.1016/s0165-0270(02)00121-8. [DOI] [PubMed] [Google Scholar]
- Fischl B, Sereno MI, Tootell RB, Dale AM. High-resolution intersubject averaging and a coordinate system for the cortical surface. Hum. Brain Mapp. 1999;8(4):272–284. doi: 10.1002/(SICI)1097-0193(1999)8:4<272::AID-HBM10>3.0.CO;2-4. [DOI] [PMC free article] [PubMed] [Google Scholar]
- Hirayasu Y, Shenton ME, Salisbury DF, Dickey CC, Fischer IA, Mazzoni P, Kisler T, Arakaki H, Kwon JS, Anderson JE, Yurgelun-Todd D, Tohen M, McCarley RW. Lower left temporal lobe MRI volumes in patients with first-episode schizophrenia compared with psychotic patients with first-episode affective disorder and normal subjects. Am. J. Psychiatry. 1998;155(10):1384–1391. doi: 10.1176/ajp.155.10.1384. [DOI] [PubMed] [Google Scholar]
- Hirayasu Y, Shenton ME, Salisbury DF, Kwon JS, Wible CG, Fischer IA, Yurgelun-Todd D, Zarate C, Kikinis R, Jolesz FA, McCarley RW. Subgenual cingulate cortex volume in first-episode psychosis. Am. J. Psychiatry. 1999;156(7):1091–1093. doi: 10.1176/ajp.156.7.1091. [DOI] [PMC free article] [PubMed] [Google Scholar]
- Hirayasu Y, McCarley RW, Salisbury DF, Tanaka S, Kwon JS, Frumin M, Snyderman D, Yurgelun-Todd D, Kikinis R, Jolesz FA, Shenton ME. Planum temporale and Heschl gyrus volume reduction in schizophrenia: a magnetic resonance imaging study of first-episode patients. Arch. Gen. Psychiatry. 2000a;57(7):692–699. doi: 10.1001/archpsyc.57.7.692. [DOI] [PMC free article] [PubMed] [Google Scholar]
- Hirayasu Y, Shenton ME, Salisbury DF, McCarley RW. Hippocampal and superior temporal gyrus volume in first-episode schizophrenia. Arch. Gen. Psychiatry. 2000b;57(6):618–619. doi: 10.1001/archpsyc.57.6.618. [DOI] [PubMed] [Google Scholar]
- Hirayasu Y, Tanaka S, Shenton ME, Salisbury DF, DeSantis MA, Levitt JJ, Wible C, Yurgelun-Todd D, Kikinis R, Jolesz FA, McCarley RW. Prefrontal gray matter volume reduction in first episode schizophrenia. Cereb. Cortex. 2001;11(4):374–381. doi: 10.1093/cercor/11.4.374. [DOI] [PubMed] [Google Scholar]
- Hunton DL, Miezin FM, Buckner RL, Van Mier HI, Raichle ME, Petersen SE. An assessment of functional – anatomical variability in neuroimaging studies. Hum. Brain Mapp. 1996;4(2):122–139. doi: 10.1002/(SICI)1097-0193(1996)4:2<122::AID-HBM4>3.0.CO;2-5. [DOI] [PubMed] [Google Scholar]
- Kang KW, Lee DS, Cho JH, Lee JS, Yeo JS, Lee SK, Chung JK, Lee MC. Quantification of F-18 FDG PET images in temporal lobe epilepsy patients using probabilistic brain atlas. NeuroImage. 2001;14(1):1–6. doi: 10.1006/nimg.2001.0783. [DOI] [PubMed] [Google Scholar]
- Kennedy DN, Lange N, Makris N, Bates J, Meyer J, Caviness VS., Jr. Gyri of the human neocortex: an MRI-based analysis of volume and variance. Cereb. Cortex. 1998;8(4):372–384. doi: 10.1093/cercor/8.4.372. [DOI] [PubMed] [Google Scholar]
- Kim JJ, Crespo-Facorro B, Andreasen NC, O'Leary DS, Zhang B, Harris G, Magnotta VA. An MRI-based parcellation method for the temporal lobe. NeuroImage. 2000;11(4):271–288. doi: 10.1006/nimg.2000.0543. [DOI] [PubMed] [Google Scholar]
- Lee CU, Shenton ME, Salisbury DF, Kasai K, Onitsuka T, Dickey CC, Yurgelun-Todd D, Kikinis R, Jolesz FA, McCarley RW. Fusiform gyrus volume reduction in first-episode schizophrenia: a magnetic resonance imaging study. Arch. Gen. Psychiatry. 2002;59(9):775–781. doi: 10.1001/archpsyc.59.9.775. [DOI] [PubMed] [Google Scholar]
- Leonard CM, Puranik C, Kuldau JM, Lombardino LJ. Normal variation in the frequency and location of human auditory cortex landmarks. Heschl's gyrus: where is it? Cereb. Cortex. 1998;8(5):397–406. doi: 10.1093/cercor/8.5.397. [DOI] [PubMed] [Google Scholar]
- Loftus WC, Tramo MJ, Gazzaniga MS. Cortical surface modeling reveals gross morphometric correlates of individual differences. Hum. Brain Mapp. 1995;3:257–270. [Google Scholar]
- Mazziotta JC, Toga AW, Evans A, Fox P, Lancaster J. A probabilistic atlas of the human brain: theory and rationale for its development. The International Consortium for Brain Mapping (ICBM). NeuroImage. 1995;2(2):89–101. doi: 10.1006/nimg.1995.1012. [DOI] [PubMed] [Google Scholar]
- Mazziotta J, Toga A, Evans A, Fox P, Lancaster J, Zilles K, Woods R, Paus T, Simpson G, Pike B, Holmes C, Collins L, Thompson P, MacDonald D, Iacoboni M, Schormann T, Amunts K, Palomero-Gallagher N, Geyer S, Parsons L, Narr K, Kabani N, Le Goualher G, Boomsma D, Cannon T, Kawashima R, Mazoyer B. A probabilistic atlas and reference system for the human brain: International Consortium for Brain Mapping (ICBM). Philos. Trans. R. Soc. Lond., B Biol. Sci. 2001a;356(1412):1293–1322. doi: 10.1098/rstb.2001.0915. [DOI] [PMC free article] [PubMed] [Google Scholar]
- Mazziotta J, Toga A, Evans A, Fox P, Lancaster J, Zilles K, Woods R, Paus T, Simpson G, Pike B, Holmes C, Collins L, Thompson P, MacDonald D, Iacoboni M, Schormann T, Amunts K, Palomero-Gallagher N, Geyer S, Parsons L, Narr K, Kabani N, Le Goualher G, Feidler J, Smith K, Boomsma D, Hulshoff Pol H, Cannon T, Kawashima R, Mazoyer B. A four-dimensional probabilistic atlas of the human brain. J. Am. Med. Inform. Assoc. 2001b;8(5):401–430. doi: 10.1136/jamia.2001.0080401. [DOI] [PMC free article] [PubMed] [Google Scholar]
- McCarley RW. Structural magnetic resonance imaging studies in schizophrenia. In: Davis KL, Charney D, Coyle J, Nemeroff C, editors. Neuropsychopharmacology: The Fifth Generation of Progress. Lippincott, Williams & Wilkins; Baltimore: 2002. pp. 757–774. [Google Scholar]
- Narr K, Thompson P, Sharma T, Moussai J, Zoumalan C, Rayman J, Toga A. Three-dimensional mapping of gyral shape and cortical surface asymmetries in schizophrenia: gender effects. Am. J. Psychiatry. 2001;158(2):244–255. doi: 10.1176/appi.ajp.158.2.244. [DOI] [PMC free article] [PubMed] [Google Scholar]
- Paus T, Tomaiuolo F, Otaky N, MacDonald D, Petrides M, Atlas J, Morris R, Evans AC. Human cingulate and paracingulate sulci: pattern, variability, asymmetry, and probabilistic map. Cereb. Cortex. 1996;6(2):207–214. doi: 10.1093/cercor/6.2.207. [DOI] [PubMed] [Google Scholar]
- Penhune VB, Zatorre RJ, MacDonald JD, Evans AC. Interhemispheric anatomical differences in human primary auditory cortex: probabilistic mapping and volume measurement from magnetic resonance scans. Cereb. Cortex. 1996;6(5):661–672. doi: 10.1093/cercor/6.5.661. [DOI] [PubMed] [Google Scholar]
- Pohl KM, Wells WM, Guimond A, Kasai K, Shenton ME, Kikinis R, Grimson WE, Warfield SK. Medical Image Computing and Computer-Assisted Intervention—MICCAI 2002. Springer; Tokyo, Japan: 2002. Incorporating non-rigid registration into expectation maximization algorithm to segment MR images. pp. 564–571. [DOI] [PMC free article] [PubMed] [Google Scholar]
- Rademacher J, Galaburda AM, Kennedy DN, Filipek PA, Caviness VS., Jr. Human cerebral cortex: localization, parcellation, and morphometry with magnetic resonance imaging. J. Cogn. Neurosci. 1992;4:352–374. doi: 10.1162/jocn.1992.4.4.352. [DOI] [PubMed] [Google Scholar]
- Rademacher J, Burgel U, Geyer S, Schormann T, Schleicher A, Freund HJ, Zilles K. Variability and asymmetry in the human precentral motor system. A cytoarchitectonic and myeloarchitectonic brain mapping study. Brain. 2001a;124(Pt 11):2232–2258. doi: 10.1093/brain/124.11.2232. [DOI] [PubMed] [Google Scholar]
- Rademacher J, Morosan P, Schormann T, Schleicher A, Werner C, Freund HJ, Zilles K. Probabilistic mapping and volume measurement of human primary auditory cortex. NeuroImage. 2001b;13(4):669–683. doi: 10.1006/nimg.2000.0714. [DOI] [PubMed] [Google Scholar]
- Rademacher J, Burgel U, Zilles K. Stereotaxic localization, intersubject variability, and interhemispheric differences of the human auditory thalamocortical system. NeuroImage. 2002;17(1):142–160. doi: 10.1006/nimg.2002.1178. [DOI] [PubMed] [Google Scholar]
- Rexilius J. Physics-Based Nonrigid Registration for Medical Image Analysis. Institut fur Medizinische Informatik, Medizinischen Universit; Boston: 2001. [Google Scholar]
- Roland PE, Zilles K. Brain atlases—A new research tool. Trends Neurosci. 1994;17(11):458–467. doi: 10.1016/0166-2236(94)90131-7. [DOI] [PubMed] [Google Scholar]
- Shenton ME, Dickey CC, Frumin M, McCarley RW. A review of MRI findings in schizophrenia. Schizophr. Res. 2001;49(1–2):1–52. doi: 10.1016/s0920-9964(01)00163-3. [DOI] [PMC free article] [PubMed] [Google Scholar]
- Shenton ME, Gerig G, McCarley RW, Szekely G, Kikinis R. Amygdala – hippocampal shape differences in schizophrenia: the application of 3D shape models to volumetric MR data. Psychiatry Res. 2002;115(1–2):15–35. doi: 10.1016/s0925-4927(02)00025-2. [DOI] [PMC free article] [PubMed] [Google Scholar]
- Steinmetz H, Seitz RJ. Functional anatomy of language processing: neuroimaging and the problem of individual variability. Neuropsychologia. 1991;29(12):1149–1161. doi: 10.1016/0028-3932(91)90030-c. [DOI] [PubMed] [Google Scholar]
- Steinmetz H, Furst G, Freund HJ. Cerebral cortical localization: application and validation of the proportional grid system in MR imaging. J. Comput. Assist. Tomogr. 1989;13(1):10–19. [PubMed] [Google Scholar]
- Talairach J, Tournoux P. Co-Planar Stereotaxic Atlas of the Human Brain. Thieme; New York, NY: 1988. [Google Scholar]
- Thompson PM, Schwartz C, Lin RT, Khan AA, Toga AW. Three-dimensional statistical analysis of sulcal variability in the human brain. J. Neurosci. 1996a;16(13):4261–4274. doi: 10.1523/JNEUROSCI.16-13-04261.1996. [DOI] [PMC free article] [PubMed] [Google Scholar]
- Thompson PM, Schwartz C, Toga AW. High-resolution random mesh algorithms for creating a probabilistic 3D surface atlas of the human brain. NeuroImage. 1996b;3(1):19–34. doi: 10.1006/nimg.1996.0003. [DOI] [PubMed] [Google Scholar]
- Thompson PM, MacDonald D, Mega MS, Holmes CJ, Evans AC, Toga AW. Detection and mapping of abnormal brain structure with a probabilistic atlas of cortical surfaces. J. Comput. Assist. Tomogr. 1997;21(4):567–581. doi: 10.1097/00004728-199707000-00008. [DOI] [PubMed] [Google Scholar]
- Thompson PM, Mega MS, Woods RP, Zoumalan CI, Lindshield CJ, Blanton RE, Moussai J, Holmes CJ, Cummings JL, Toga AW. Cortical change in Alzheimer's disease detected with a disease-specific population-based brain atlas. Cereb. Cortex. 2001;11(1):1–16. doi: 10.1093/cercor/11.1.1. [DOI] [PubMed] [Google Scholar]
- Toga AW, Thompson PM, Mega MS, Narr KL, Blanton RE. Probabilistic approaches for atlasing normal and disease-specific brain variability. Anat. Embryol. (Berl.) 2001;204(4):267–282. doi: 10.1007/s004290100198. [DOI] [PubMed] [Google Scholar]
- Tomaiuolo F, MacDonald JD, Caramanos Z, Posner G, Chiavaras M, Evans AC, Petrides M. Morphology, morphometry and probability mapping of the pars opercularis of the inferior frontal gyrus: an in vivo MRI analysis. Eur. J. Neurosci. 1999;11(9):3033–3046. doi: 10.1046/j.1460-9568.1999.00718.x. [DOI] [PubMed] [Google Scholar]
- Van Essen DC, Drury HA. Structural and functional analyses of human cerebral cortex using a surface-based atlas. J. Neurosci. 1997;17(18):7079–7102. doi: 10.1523/JNEUROSCI.17-18-07079.1997. [DOI] [PMC free article] [PubMed] [Google Scholar]
- Varnavas GG, Grand W. The insular cortex: morphological and vascular anatomic characteristics. Neurosurgery. 1999;44(1):127–136. doi: 10.1097/00006123-199901000-00079. discussion 136-138. [DOI] [PubMed] [Google Scholar]
- Westbury CF, Zatorre RJ, Evans AC. Quantifying variability in the planum temporale: a probability map. Cereb. Cortex. 1999;9(4):392–405. doi: 10.1093/cercor/9.4.392. [DOI] [PubMed] [Google Scholar]
- White LE, Andrews TJ, Hulette C, Richards A, Groelle M, Paydarfar J, Purves D. Structure of the human sensorimotor system: I. Morphology and cytoarchitecture of the central sulcus. Cereb. Cortex. 1997;7(1):18–30. doi: 10.1093/cercor/7.1.18. [DOI] [PubMed] [Google Scholar]
- Woods RP. Modeling for intergroup comparisons of imaging data. NeuroImage. 1996;4(3 Pt 3):S84–S94. doi: 10.1006/nimg.1996.0058. [DOI] [PubMed] [Google Scholar]


