

Abstract
Alcoholics and heavy drinkers score higher on measures of impulsivity than nonalcoholics and light drinkers. This may be due to factors that predate drug exposure (e.g., genetics). This study examined the role of genetics by comparing impulsivity measures in ethanol naïve rats selectively bred based on their high (HAD) or low (LAD) consumption of ethanol. Replicates 1 and 2 of the HAD and LAD rats, developed by the University of Indiana Alcohol Research Center, completed two different discounting tasks. Delay discounting examines sensitivity to rewards that are delayed in time and is commonly used to assess “choice” impulsivity. Probability discounting examines sensitivity to the uncertain delivery of rewards and has been used to assess risk taking and risk assessment. HAD rats discounted delayed and probabilistic rewards more steeply than LAD rats. Discount rates associated with probabilistic and delayed rewards were weakly correlated, while bias was strongly correlated with discount rate in both delay and probability discounting. The results suggest that selective breeding for high alcohol consumption selects for animals that are more sensitive to delayed and probabilistic outcomes. Sensitivity to delayed or probabilistic outcomes may be predictive of future drinking in genetically-predisposed individuals.
Keywords: alcohol, impulsivity, delay discounting, probability discounting, rats, selected lines, genetics
Introduction
Drug abusers (including alcohol) exhibit heightened impulsivity. Delay discounting procedures assess impulsivity by offering subjects a choice between an immediate reward and a larger reward available after a delay (e.g. Rachlin and Green 1972, Logue et al. 1988). Alcoholics and heavy drinkers prefer small, immediate monetary rewards over larger, but delayed rewards compared with light drinkers (Vuchinich & Simpson, 1998, Petry 2001), suggesting that alcoholics and heavy drinkers discount the hypothetical “value” of the delayed reward more than light drinkers. Heightened impulsivity may predict subsequent alcohol abuse, or may be the result of short- and/or long-term neurobiological adaptations to drinking. Or, heightened impulsivity could predate drinking and become further exacerbated by long-term alcohol use. Alcoholism (e.g. Goodwin et al. 1974) and impulsivity have genetic components (Anderson and Woolverton 2005, Isles et al. 2004), so the association of heightened impulsivity with alcohol abuse suggests that the genes involved in alcohol abuse and impulse control may overlap.
To more closely model aspects of human drinking behaviors, numerous animal models have been selectively bred to consume relatively high or low amounts of alcohol (for review see McBride and Li 1998). We chose to use the high- and low-alcohol drinking (HAD and LAD respectively) rat lines developed by the Indiana University Alcohol Research Center because of their diverse genetic background and the availability of two independent replicates. Steinmetz et al. (2000) reported no differences between these lines on a motor impulsivity (behavioral inhibition) task, but delay discounting has yet to be examined.
Various factors can affect reinforcer value, including delay, effort, and uncertainty costs associated with reinforcer delivery. Delay and probability discounting are positively correlated (Richards et al. 1999), and can both be modeled with a similar hyperbolic equation (Rachlin et al. 1991; Richards et al. 1999). Probability discounting offers subjects a choice between a certain reward and an uncertain reward and assesses each subject’s sensitivity to probabilistic reinforcement. Little data is available on probability discounting and the available studies are mixed (Reynolds et al. 2004; Yi et al. 2007, Mitchell 1999, Ohmura et al 2005). Delay and probability discounting appear to share some underlying neural mechanisms, but are also dissociable (Acheson et al. 2006, Estle et al. 2006). Therefore, we examined both delay and probability discounting.
Isles et al. (2004) found that mice with higher levels of spontaneous locomotor activity also preferred small immediate rewards. Perry et al. (2005) found no such correlation in rats. No studies have examined the relationship between locomotor activity and probability discounting. We compared locomotor activity between strains and correlated this with performance on the delay and probability discounting tasks to determine if there are species differences in task performance. In addition, we compared sucrose drinking between these rat lines to determine if there were differences and if sucrose consumption correlated with aspects of task performance.
The goal of this study was to determine if heightened discounting of delayed or probabilistic rewards is selected in concert with level of alcohol drinking in a rat model. Understanding the relationship between genetics, impulsivity and alcohol consumption will enhance our knowledge of the behavioral pathways by which genes impact alcohol use.
Materials and Methods
Subjects
Inbred lines of HAD1 (n = 6), HAD2 (n = 6), LAD1 (n = 6) and LAD2 (n = 6) male rats were generously supplied by the Indiana University Alcohol Research Center. These lines of animals were chosen because they were selected from the N/NIH heterogeneous stock (which provides the advantage of a diverse population of starting genes) and because there are two independent replicates available, which greatly decreases the probability that a gene unrelated to alcohol consumption becomes fixed in both replicates. Upon receipt, HAD1 animals weighed 307 ± 10 g, LAD1 animals weighed 347 ± 6 g, HAD2 animals weighed 292 ± 10 g and LAD2 animals weighed 263 ± 9 g. Rats were housed in the Department of Comparative Medicine at Oregon Health & Science University an AAALAC-approved facility. All procedures were approved by the appropriate Institutional Animal Care and Use Committee and adhered to NIH Guidelines. To facilitate training and maintain responding in behavioral tasks, 3 days prior to the start of training, animals were food deprived to approximately 90% of their free-feeding body weights. Unless otherwise noted, animals were maintained at 90% of their free-feeding age-adjusted body weights with supplemental chow given immediately following each day’s test session.
Apparatus
We used eight identical (Med Associates, St. Albans, VT, U.S.A.) modular rat test chambers housed individually within melamine sound-attenuating cabinets. Chambers had acrylic front and back panels and stainless steel side panels. A fan provided constant ventilation and low-level background noise. A house light was mounted in the center of one of the stainless steel panels, and a response clicker was also mounted on the outside of this panel. Three non-retractable levers were mounted on the opposing panel directly below circular lights and above recessed nose-pokes. Thus, there were left, right, and center lights, levers and nose pokes. Computer-controlled pumps were used to deliver sucrose reinforcers (10% w/v) to liquid cups located in the recesses of the outer nose-pokes.
Order of Experiments
HAD1 and LAD1 rats completed the delay discounting task, followed by the probability discounting task and sucrose drinking. HAD2 and LAD2 rats completed the probability discounting task first, then delay discounting, sucrose drinking and locomotor activity. The discounting tasks were counterbalanced to offset potential order effects.
Training
Training began after 3 days of food restriction and was divided into 3 phases (for detailed description see Supplement). Phase 1 of training exposed subjects to a progressively delayed noncontingent reward to acquaint the animals with the location of the reinforcer, and a response-contingent reinforcer, to train the animals to press levers and earn a sucrose reward. In Phase 2 of training, animals were trained to press the middle lever to activate the outer “choice” levers. The purpose of this was to eliminate position bias by forcing the animals to move near the middle of the chamber. Once activated, an outer lever press resulted in sucrose reward delivery and deactivation of both levers until a new trial began (5 s ITI) and the middle lever was pressed. Animals were also introduced to forced choice trials, whereby animals that chose either the right or left lever on two consecutive trials were forced to press the opposite lever on the subsequent trial. Phase 3 of training incorporated time contingencies, requiring animals to successfully complete a middle lever press and a left or right lever press within 24 s of the start of a trial. Each trial was 40 s long. Illumination of the middle light signaled the start of a new trial. A subsequent middle lever press extinguished the middle light and illuminated the right and left lights, indicating that both levers were active. One of the outer levers was assigned to be the immediate/certain lever, while the other was the delayed or probabilistic lever (during training, no delays greater than 0 s or probabilities less than 1.0 were experienced in training). Delayed/Probabilistic levers were counter-balanced between subjects and remained the same throughout both delay and probability discounting experiments. The size of the immediate/certain reward (initially 75 µl) adjusted throughout the experimental session; choice of the delayed/probabilistic lever increased the size of the immediate/certain reward by 10% and choice of the immediate/certain lever decreased the size of the immediate/certain reward by 10% (forced-choice trials did not affect the size of the immediate reward). Each sucrose reinforcer was delivered to the right or left nose pokes in combination with an auditory stimulus (response clicker). Sessions lasted until 60 free-choice trials occurred, or 60 minutes had elapsed. The majority of sessions were completed within 50 minutes. To complete training, rats were required to respond on at least 55 of the 60 possible free-choice trials on two consecutive sessions. One LAD2 rat was unable to complete the training requirements and was therefore not included in the results.
Delay Discounting Task
The adjusting amount procedure was adapted from a procedure described in Richards et al. (1997). Experimental sessions were as described in Phase 3 of training, except that a response on the delayed lever resulted in delivery of a 150 µl sucrose reinforcer, delayed by 0, 2, 4, 8, or 16 s. The delay remained constant within a session but varied between sessions according to a Latin square design. Animals experienced each delay a minimum of 6 times, but only data from occasions 2–6 was included in the analyses. The purpose of the experiment was to assess the subjective value of the delayed sucrose by titrating the volume of the immediate reward until animals became indifferent between the two choices.
Probability Discounting Task
Experimental sessions were carried out exactly as described in Phase 3 of training, except that a response on the probabilistic lever resulted in the delivery of a 150 µl sucrose reinforcer with probabilities of 1.00, 0.75, 0.50, 0.25 or 0.125. Probability remained constant within a session but varied between sessions according to a Latin square design. Animals experienced each probability a minimum of 6 times, but only data from occasions 2–6 was included in the analyses. The purpose of the experiment was to assess the subjective value of the probabilistic sucrose by titrating the size of the immediate reward until animals became indifferent between the two choices.
Two-bottle sucrose preference
The purpose of this experiment was to determine if HAD and LAD rats differed in consumption or preference when offered a choice between a sucrose solution and water. Differences in sucrose consumption or preference might be critical to the interpretation of the discounting data. Replicates 1 and 2 were tested 4 days per week with each concentration of sucrose in the following sequence 0, 0.1, 0.5, 1.0, 2.5, 5, 10, 20, 30 and 0% w/v sucrose. On test days, each rat was placed in a rat drinking cage for 50 minutes (the approximate length of a discounting session) and given access to two bottles; one containing a sucrose solution and the other containing water. To eliminate the potential for side bias, placement of sucrose and water bottles was alternated daily. The amount of solution consumed was determined by weighing the bottles before and after each test session. The average amount of sucrose consumed per 50 min test session was calculated in grams of sucrose/kg body weight. In addition, sucrose preference was calculated as the ratio of the amount of sucrose consumed to the total amount of fluid (water plus sucrose) consumed. Again, preference was averaged over each of the test days. To maintain relevance to discounting procedures, animals were food deprived as described for the discounting procedure.
Locomotor activity
Locomotor activity was assessed in the HAD2 and LAD2 animals. Timing of the decision to collect activity data meant that the first replicate of animals was unavailable to complete the task. Food was available ad-libitum during this phase of the experiment. Four Accuscan (Accuscan Instruments Inc., Columbus, Ohio, U.S.A.) automated activity monitors were used for this study. Chambers consisted of a 40 × 40 × 30 cm clear acrylic test cage placed inside a monitoring unit that recorded photocell beam breaks, which were translated into distance traveled (in cm). Eight or sixteen evenly spaced photocells and receptors were located 2 cm above the chamber floor. Monitors and test cages were housed in black acrylic chambers that were lined with foam to attenuate external noise. A fluorescent light and fan located within the test chamber were on during testing to provide illumination, ventilation and low level background noise. Each rat was assigned to a locomotor activity chamber. Locomotor activity was recorded for 30 minutes on 5 consecutive days and converted to horizontal distance traveled.
Data analysis
Analyses of delay and probability discounting data were similar to those described in Mitchell et al (2006) and Wilhelm et al. (2007). The main dependent variable was the amount of sucrose solution delivered from the immediate/certain, adjusting alternative at the “indifference point”, i.e., the amount at which the immediate/certain and delayed/probabilistic alternatives were selected equally often. Based on previous findings (Richards et al. 1997), animals reach the indifference point after the first 30 trials of a session, thus the median volume of sucrose associated with the adjusting lever over trials 31–60 is an index of the subjective value of the alternate choice. Table 1 demonstrates that animals chose each lever with roughly equal frequency over this period. The median, rather than the mean, was used as a measure of central tendency because changes in the adjusting amount on successive trials were proportions of the amount on the prior trial, resulting in a skewed distribution. Data from sessions where fewer than 40 trials were completed was excluded from analysis (percent of delay discounting sessions with fewer than 40 responses: HAD1 = 2.0%, LAD1 = 0%, HAD2 = 0%; LAD2 = 3% of delay discounting sessions; percent of probability discounting sessions with fewer than 40 responses: HAD1 = 0%, LAD1 = 1%, HAD2 = 3%, and LAD2 = 14% of probability discounting sessions). Hyperbolic equations were fitted to each animal’s average indifference points (modified from Mazur 1987) using Graphpad Prism 3.0 (Graphpad Software Incorporated, San Diego, CA):
| Equation 1 |
Table 1.
Percent choice during the final 30 choice trials
| Delay (% Choice) | Probability (% Choice) | |||
|---|---|---|---|---|
| Immediate | Delayed | Certain | Uncertain | |
| HAD1 | 44.9 ± 1.4% | 55.1 ± 1.4% | 49.2 ± 1.6% | 50.8 ± 1.6% |
| HAD2 | 48.0 ± 1.4% | 52.0 ± 1.4% | 47.1 ± 1.1 % | 52.9 ± 1.1% |
| LAD1 | 45.8 ± 1.0% | 54.2 ± 1.0% | 47.5 ± 1.3% | 52.5 ± 1.3% |
| LAD2 | 47.6 ± 1.0% | 52.4 ± 1.0% | 46.4 ± 1.4% | 53.6 ± 1.4% |
Data shown are the mean ± SEM percent choice of the noted lever during the final 30 choice trials of delay discounting and probability discounting sessions. This demonstrates that the animals chose each lever with roughly the same frequency over this period, i.e. they had reached an indifference point. HAD1 n = 6, HAD2 n = 6, LAD1 n = 6, LAD2 n = 5.
where V represents the value of the adjusting reward at indifference in µl; A represents the amount of sucrose solution from the delayed or probabilistic alternative (150 µl); X is either the delay to receiving the reinforcer (0, 2, 4, 8, or 16 s), or the odds against receiving the reinforcer ((1-probability)/probability: 0, 0.33, 1, 3, 7), and the bias parameter, b, is a fitted parameter indicative of bias, or side preference in the absence of delay (0 s delay condition) or uncertainty (odds against = 0)‥ The discount parameter (k) is a fitted parameter, and indexes the rate of discounting or overall sensitivity to delayed or probabilistic rewards. Larger values of k indicate steeper discount functions, and stronger aversion to delayed or probabilistic rewards. Mixed model ANOVAs were used to examine indifference points, with LINE and REPLICATE as between-subjects factors and DELAY or ODDS AGAINST as within-subjects factors. Similar ANOVAs with the additional inclusion of CHOICE as a within-subjects factor was used to examine reaction times and choice reaction times. Two-way ANOVAs were used to examine k values and b values, with LINE and REPLICATE as between-subjects factors.
The main dependent variables in the two-bottle choice study were the grams of sucrose consumed /kg of body weight and the preference ratio (ml of sucrose consumed/total ml consumed). A mixed model ANOVA with concentration of sucrose (CONCENTRATION) as a within subjects factor and LINE and REPLICATE as between subjects factors was used for analysis. For locomotor activity, the main dependent variables were the horizontal distance traveled on Days 1 through 5 and the difference in horizontal distance traveled from Day 1 to Day 5 (habituation). A mixed model ANOVA with DAY as a within subjects factor and LINE as a between subjects factor was used for analysis.
ANOVA and other statistical tests were carried out using SPSS version 15.0 (SPSS Inc., Chicago, IL). Huynh-Feldt corrections were applied as necessary, and adjusted degrees of freedom are provided.
Results
Delay discounting performance
The adjusting amount procedure determined the discounted value of a reinforcer given after a delay by adjusting the size of an immediate alternative until subjects became indifferent between the two options. Indifference points decreased as the delay to reward increased (DELAY(3.7, 69.5) = 140.9, p < 0.001)(Figure 1). HAD rats were more sensitive to delayed rewards than LAD rats (DELAY × LINE: F(3.7, 69.5) = 12.4, p <0.001), an effect that was consistent in both replicates (REPLICATE: F(1,19) < 1). There was also a main effect of line (LINE: F(1, 19) = 5.2, p = 0.03). Follow-up ANOVAs with line and replicate as factors were carried out at each delay and suggest the main effect of line was driven by differences at the 0 s delay (LINE: F(1, 19) = 20.8, p < 0.001), but not at any of the other delays (LINE other delays: all F’s(1, 19) < 1).
Figure 1.
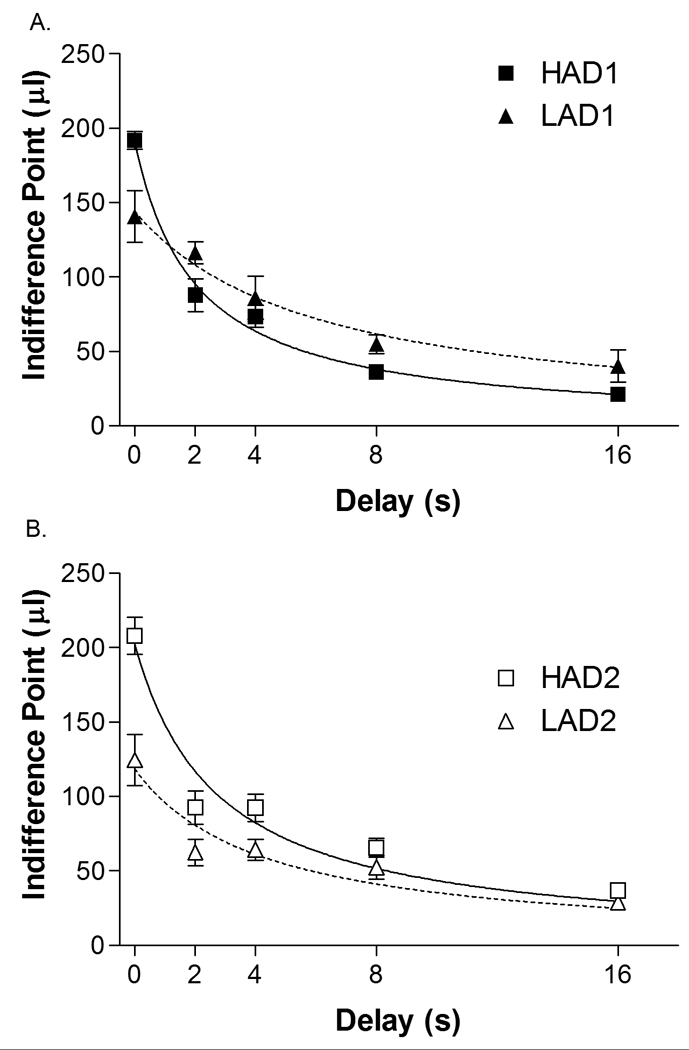
Mean ± SEM indifference point for each line at each delay tested (0, 2, 4, 8 and 16 s). Data for replicate 1 are shown in the top (a) graph and for Replicate 2 in the bottom (b) graph. A significant LINE × DELAY interaction suggests that HAD animals were more sensitive to delayed rewards than LAD animals. HAD1 n = 6, HAD2 n = 6, LAD1 n = 6, LAD2 n = 5.
The hyperbolic discount function (Equation 1) was fitted to the data for each individual rat, resulting in the generation of a k-value (discount rate) and b-value (bias) for each animal. HAD rats had higher k-values than LAD rats (LINE: F(1, 19) = 15.1, p = 0.001)(Table 2), indicating that HAD animals discount the value of delayed rewards more rapidly than LAD animals. This effect was consistent in both replicates (REPLICATE: F(1, 19) < 1.0). For b values, HAD1 and HAD2 animals were biased toward the delayed lever (b > 1.0), while LAD2 animals were biased toward the immediate lever (b < 1.0) and LAD1 animals were relatively unbiased (b approximated) (LINE: F(1, 19) = 25.5, p < 0.001)(Table 2). Again, there was no effect of replicate (REPLICATE: F(1, 19) < 1.0).
Table 2.
HAD rats are more sensitive to delayed or probabilistic outcomes.
| Delay Discounting | Probability Discounting | |||
|---|---|---|---|---|
| Bias | k | Bias | k | |
| HAD1 | 1.28 ± 0.04*** | 0.53 ± 0.07** | 1.14 ± 0.10* | 0.76 ± 0.19* |
| HAD2 | 1.36 ± 0.09*** | 0.40 ± 0.07** | 1.12 ± 0.09* | 0.53 ± 0.19* |
| LAD1 | 0.99 ± 0.09 | 0.20 ± 0.06 | 1.00 ± 0.12 | 0.25 ± 0.04 |
| LAD2 | 0.80 ± 0.11 | 0.25 ± 0.04 | 0.76 ± 0.14 | 0.44 ± 0.30 |
Data shown are the mean ± SEM for bias (b) and discount parameter (k) values as derived from the hyperbolic discount function (Equation 1). Higher values of k indicate greater sensitivity to delayed or probabilistic outcomes. Bias values above one indicate a preference for the cost (uncertain or delayed) lever and bias values below 1.0 indicate a preference for the certain or immediate lever. HAD1 n = 6, HAD2 n = 6, LAD1 n = 6, LAD2 n = 5. Significant line differences are denoted as follows,
p < 0.05,
p = 0.001,
p < 0.001
There were no line differences in reaction time (the time from trial start to middle lever press)(LINE: F(1, 19) = 3.6, p = 0.074)(Figure S1), choice reaction time (the time from middle lever press to choice of either of the two outer levers)(LINE: F(1, 19) = 1.8, p = 0.311)(Figure S2), or on the number of trials completed each session (LINE: F(1, 19) = 1.0, p = 0.708). HAD1 and LAD1 animals had faster reactions times than HAD2 and LAD2 animals (REPLICATE: F(1, 19) = 8.8, p = 0.008). Reaction times were slower on trials when the delayed alternative was chosen (CHOICE: F(1, 19) = 7.9, p = 0.011) and as the delay to reward increased (DELAY: F(4, 76) = 35.6, p < 0.001). Likewise, choice reaction times were slower on trials when the delayed alternative was chosen (CHOICE: F(1,19) = 10.0, p = 0.005), and as the delay to reward increased (DELAY: F(3.0, 56.7) = 14.1, p < 0.001). Choice reaction times were similar in both replicates (REPLICATE: F(1, 19) < 1). The number of trials completed also decreased as the delay to reward increased (DELAY: F(3.0, 57.7) = 22.9, p < 0.001), and HAD1 and LAD1 animals completed more trials than the HAD2 and LAD2 animals (REPLICATE: (F(1, 19) = 12.0, p < 0.001). There were other significant interactions, however, these were not systematic, and are not discussed further.
Probability Discounting Performance
The adjusting amount procedure was used to assess the discounted value of rewards given with varying probabilities (Figure 2). Analysis of probability discounting is complicated because choice of the uncertain lever leads to probabilistic reward delivery. Therefore, experienced probability often differs from the target probability. The average experienced probabilities for the 0.125 probability sessions ranged from 0.083 – 0.213. The averaged experienced probabilities by line for the 0.125 condition were: HAD1 = 0.145 ± 0.012, LAD1 = 0.129 ± 0.012, HAD2 = 0.135 ± 0.013 and LAD2 = 0.147 ± 0.020. One-sample t-tests revealed that experienced probabilities in all conditions were not different from programmed probabilities (all p’s > 0.05). Therefore, to facilitate comparisons, further analyses use the programmed probabilities to calculate the odds against.
Figure 2.
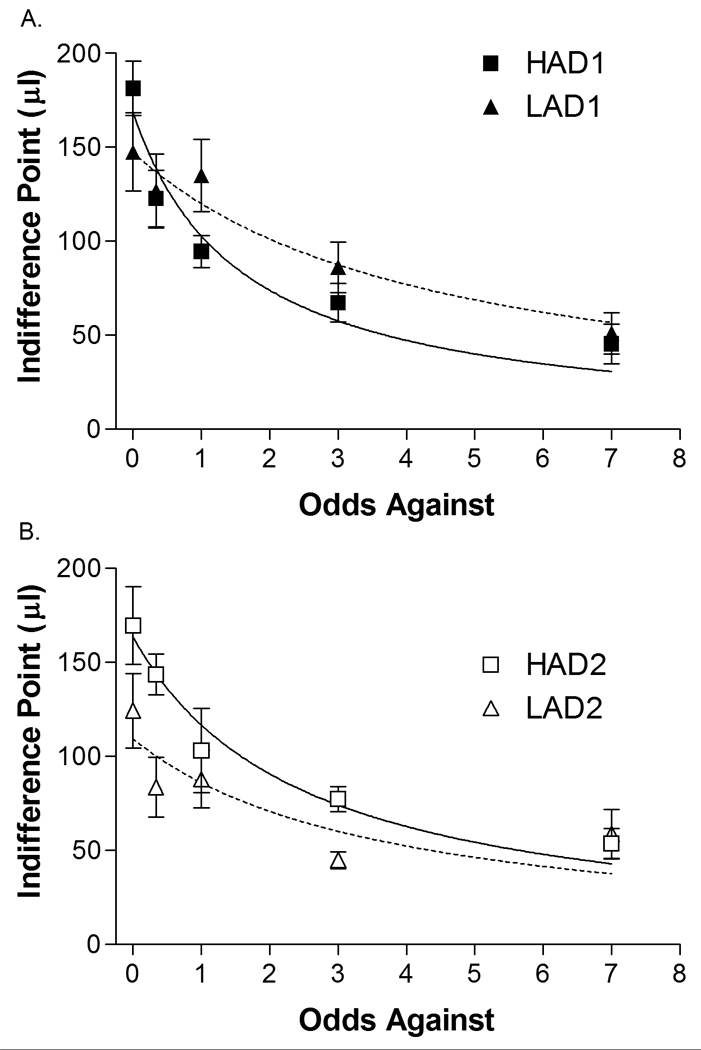
Mean ± SEM indifference point for each line at each odds against (0, 0.33, 1, 3 and 7). Data for replicate 1 are shown in the top (a) graph and for Replicate 2 in the bottom (b) graph. A significant LINE × ODDS AGAINST interaction suggests that HAD animals were more sensitive to probabilistic rewards than LAD animals. HAD1 n = 6, HAD2 n = 6, LAD1 n = 6, LAD2 n = 5.
Indifference points decreased as the odds against obtaining a reward increased (ODDS AGAINST: F(3.9, 74.3) = 46.1, p < 0.001). HAD animals were more sensitive to odds against than LAD animals (LINE × ODDS AGAINST F(3.9, 74.3) = 3.3, p = 0.015). Post-hoc analyses indicate that line differences were most robust at the level of full certainty (odds-against = 0, LINE F(1, 19) = 4.25, p = 0.053, all other odds-against, p’s > 0.09). There was no effect of line (LINE: F(1, 19) = 1.2, p = 0.29) or replicate (REPLICATE: F(1, 19) = 1.2, p = 0.29). As with the delay discounting task, the experimentally derived indifference points were fitted to the hyperbolic discount function (Equation 1). The resulting k-values were skewed (1.41), therefore a natural logarithm transformation was applied to reduce skewness and decrease the influence of outliers (resulting skewness = 0.12). HAD rats had larger k-values than LAD rats (LINE: F(1, 19) = 5.54, p = 0.03)(Table 2), with no difference between replicates (REPLICATE: F(1, 19) < 1). The large standard errors of the HAD2 and LAD2 animals were the result of single outliers, which when excluded yield average k values of HAD2 k = 0.35 ± 0.07 and LAD2 k = 0.14 ± 0.04. Thus, HAD animals appear more sensitive to probabilistic outcomes. Similar to the results from the delay discounting study, the HAD line was biased toward the uncertain lever, while LAD animals were unbiased, or biased toward the certain lever (LINE: F(1,19) = 5.17, p = 0.04)(Table 2). There was no difference between replicates (REPLICATE: F(1,19) = 1.38, p = 0.26).
There were no line differences in reaction time (the time from trial start to middle lever press)(LINE: F(1, 19) = 2.3, p = 0.142)(Figure S3), choice reaction time (the time from middle lever press to choice of either of the two outer levers) (LINE: F(1, 19) = 3.7, p = 0.071)(Figure S4), or on the average number of trials completed per session (LINE: F(1, 19) = 2.5, p = 0.130). Reaction times were slower as the odds against receiving a reward increased (ODDS AGAINST: F(4.0, 75.1) = 48.9, p < 0.001), and HAD1 and LAD1 rats had faster reaction times than HAD2 and LAD2 rats (REPLICATE: F(1, 19) = 85.8, p < 0.001). Choice reaction times were also slower when the uncertain reward was chosen (CHOICE: F(1, 19) = 16.5, p = 0.001) and as the odds against receiving a reward increased (ODDS AGAINST: F(4, 76) = 3.8, p = 0.007). The number of trials completed decreased as the odds against receiving a reward increased (ODDS AGAINST: F(3.6, 69.0) = 56.5, p < 0.001). HAD1 and LAD1 rats completed more trials than HAD2 and LAD2 rats (REPLICATE: F(1, 19) = 25.4, p < 0.001). There were other significant interactions, however, these were not systematic, and are not discussed further.
Two-bottle choice
Animals consumed more of the sucrose solution as sucrose concentration increased (CONCENTRATION: F(2.3, 46.7) = 340.2, p < 0.001)(Figure 3a). There were also line differences in consumption of sucrose (LINE: F(1, 20) = 8.7, p = 0.008). To further examine this effect, post-hoc ANOVAs were conducted independently for each replicate. For HAD1 and LAD1 animals, LAD1 animals drank more sucrose than HAD1 animals (LINE: F(1,10) = 25.9, p < 0.001) and as the concentration of sucrose increased, so did the amount of sucrose solution consumed (CONCENTRATION: F(2.7, 26.6) = 207.5, p < 0.001). The observed difference in sucrose consumption was not due to weight differences (average weights HAD1 = 306 ± 14 g, LAD1 = 321 ± 9 g, t-test p = 0.38). For HAD2 and LAD2 animals, sucrose consumption increased with concentration (CONCENTRATION: F(2.0, 20.1) = 149.2, p < 0.001), however, consumption did not differ between lines (LINE: F(1, 10) < 1, p = 0.88). Thus sucrose consumption differences between HAD1 and LAD1 animals were responsible for the observed line difference.
Figure 3.
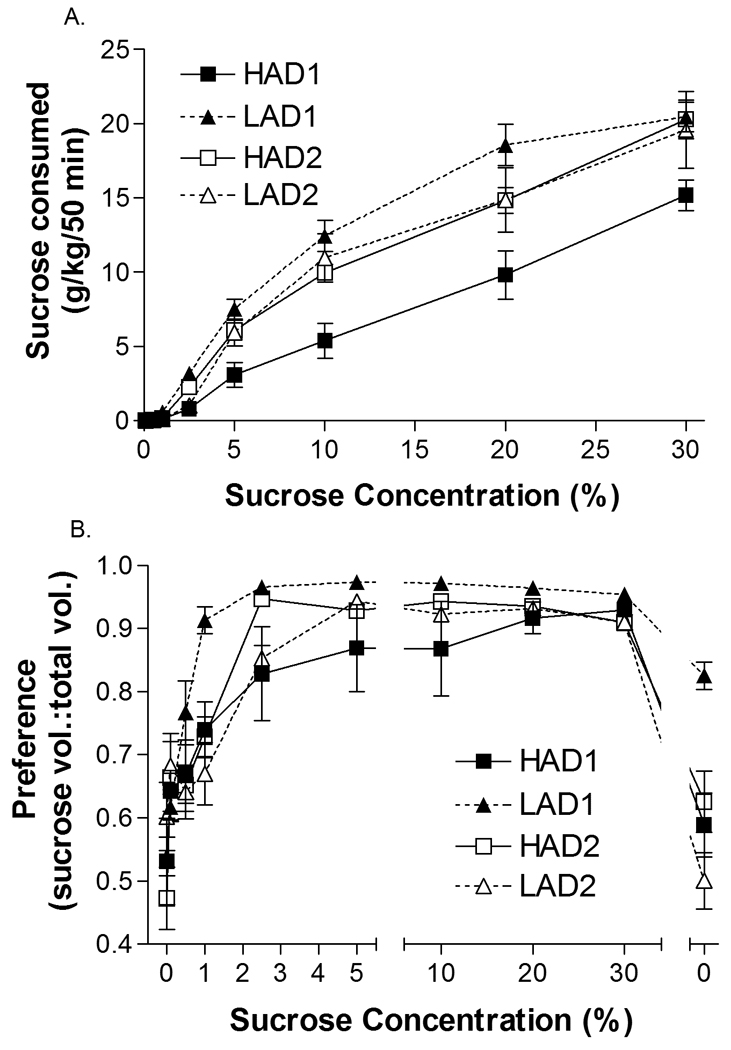
Consumption and preference for reinforcer were similar in both HAD and LAD rats. HAD1 n = 6, HAD2 n = 6, LAD1 n = 6, LAD2 n = 6. Panel a illustrates the mean ± SEM amount of sucrose consumed by each strain in g of sucrose consumed per kg of body weight. Sucrose concentrations ranged from 0–30% sucrose (w/v). Panel b illustrates the mean ± SEM preference ratio between the sucrose solution and water. Preference ratio was calculated as volume of sucrose consumed/total volume.
Preference for sucrose increased with increasing concentrations of sucrose (CONCENTRATION: F(7.4, 149.0) = 66.7, p < 0.001), and was similar in both lines (LINE: F(1,20) = 0.5, p = 0.49) and replicates (REPLICATE: F(1,20) = 1.90, p = 0.18). At higher concentrations of sucrose, all animals showed a strong preference for sucrose over water (Figure 3b). Furthermore, at the 10% sucrose concentration (the concentration used for the delay and probability discounting experiments), all lines of animals showed a near exclusive preference for the sucrose solution (one of the HAD1 animals had a preference ratio of 0.5 at the 10% sucrose concentration, while all other animals had a preference ratio of > 0.92).
Locomotor Activity
HAD2 animals were more active than LAD2 animals (LINE: F(1, 9) = 31.6, p < 0.001)(Figure 4). Activity tended to decrease as animals became habituated to the chamber following numerous exposures (DAY: F(3.1, 28.0) = 3.2, p = 0.035).
Figure 4.
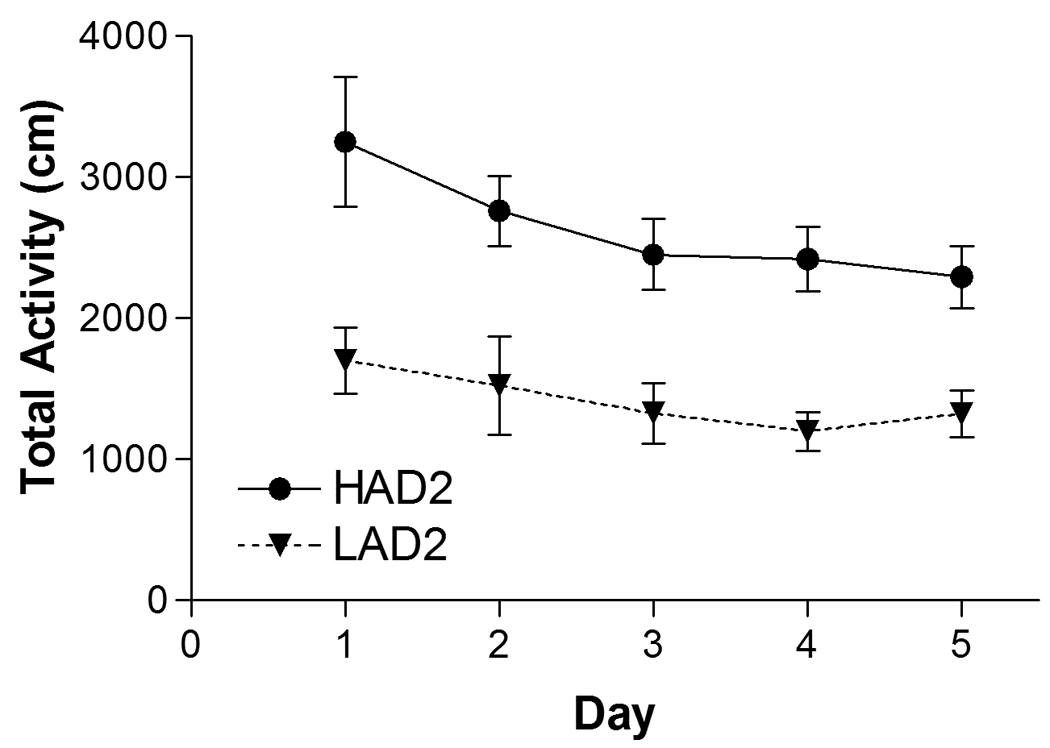
Mean (± SEM) of the total horizonal activity (in cm) for each line during a 30 minute session. HAD2 rats were more active than LAD2 rats (* denotes main effect of LINE: F(1, 9) = 31.6, p < 0.001). Locomotor activity decreased as the animals habituated to the chamber (main effect of DAY: F(3.1, 28.0) = 3.2, p = 0.035). HAD1 n = 6, HAD2 n = 6, LAD1 n = 6, LAD2 n = 6.
Correlational analysis
Table 3 summarizes correlations for the dependent measures obtained in each component experiment of this study. Within each discounting task, bias was correlated with k values. Between discounting tasks, k values were correlated, but b values were not. Interestingly, consumption of 10% sucrose was correlated with both bias and k values derived from delay discounting, but not probability discounting tasks. This was not the result of using the programmed odds-against descriptor, as a correlation using probability discounting parameters incorporating experienced odds-against yielded similar results (correlations: probability discounting b (experienced probabilities) with sucrose, Spearman’s rho = 0.078; probability discounting k (experienced probabilities) with sucrose, Spearman’s rho = −0.005).
Table 3.
Nonparametric correlations between experimental measures
| DD b | DD k | PD b | PD k | 10% Sucrose |
D1 Loco# |
D1–D5 Loco# |
|
|---|---|---|---|---|---|---|---|
| DD b | |||||||
| DD k |
.687** (<.001) |
||||||
| PD b | .326 (.129) |
.177 (.419) |
|||||
| PD k | .241 (.268) |
.460* (.027) |
.582** (.004) |
||||
| 10% Sucrose | −.498* (.016) |
−.600** (.002) |
.093 (.672) |
.043 (.847) |
|||
| D1 Loco# | .564 (.071) |
.255 (.450) |
.364 (.272) |
.355 (.285) |
.236 (.484) |
||
| D1–D5 Loco# | .300 (.370) |
.227 (.502) |
−.245 (.467) |
−.109 (.750) |
−.209 (.537) |
.627* (.039) |
|
Data shown are Spearman’s rho (p-value).
p < 0.05,
p < 0.01. Correlations between performance measures that were significant at the p < 0.05 level are indicated by bold type. Abbreviations: PD: probability discounting, DD: delay discounting, 10% Sucrose: the amount of sucrose consumed in g/kg body weight, D1 Loco: locomotor activity on day 1, D1–D5 Loco: locomotor activity on day 5 minus locomotor activity on day 1 (habituation);
denotes n = 11, all other n = 23.
Discussion
A genetic predisposition toward high alcohol drinking is associated with greater sensitivity to delayed and probabilistic outcomes
Significant line differences were apparent in discounting of both delayed and probabilistic rewards, with HAD animals exhibiting greater sensitivity to both delayed and probabilistic contingencies. The consistency of this finding in both HAD/LAD replicates adds additional support, suggesting that the genes associated with the high or low alcohol consumption phenotype are also associated with heightened sensitivity to delayed or probabilistic outcomes. It is not clear if these discounting profiles will generalize to other genetically unrelated rat models of high or low alcohol drinking, but this could further strengthen these associations. Differences in rearing may contribute to the observed patterns of discounting, although this is unlikely given that the effect was consistent in both independently selected replicates. Bias, or indifference points at 0 s delay and 0 odds-against that are not equal to 150 µl accounted for much of the differences between lines. It is not clear what causes animals to under- or over-value these conditions, but it is not unique to this study (Richards et al. 1997). Most common in this study, was for HAD rats to have bias values greater than one, indicating a preference, and subsequent overvaluation, of the delayed or probabilistic lever under conditions of 0 s delay, or 0 odds-against. It is unlikely that this is simply position bias, i.e. HAD rats being generally more averse to the lever closest to the door, because delayed and probabilistic levers were counter-balanced. Instead, this may be the result of differences in behavioral contrast (Richards et al. 1997). HAD rats may exhibit a strong positive behavioral contrast under conditions of 0 s delay or 0 odds-against, which would result in overvaluation of the delayed or probabilistic lever. By contrast, LAD2 rats undervalued the delayed or probabilistic levers under these conditions, while, LAD1 rats tended to exhibit no bias (b ~ 1). Given the correlation between bias and discount rate (k), the importance of bias cannot be underestimated. Clearly, the cause of bias in the adjusting amount procedure needs to be better understood. Nevertheless, the slope of the discount curves for LAD rats were consistently shallower than those for HAD rats, making this the first study to demonstrate that heightened sensitivity to delayed or probabilistic outcomes exists in alcohol naive rats predisposed to high alcohol drinking. This finding may have significant implications for risk factors that contribute to human alcohol abuse disorders, however it is not clear if such differences contribute to initiation of drug use and/or drug dependence over and above the risk conferred by family history. Although it is outside the scope of this study, gender differences may also play a role in the genetics of alcohol abuse (Petry et al. 2002). A single previous study in short term selectively bred mice found no difference in delay discounting between high and low alcohol drinking mice (Wilhelm et al. 2007). This may be explained by a number of factors. First, the mouse background used to create the selected lines for the previous study was a DBA/2J and C57BL/6J cross. A previous study found that the alcohol averse DBA/2J strain was more sensitive to delayed reinforcement than the alcohol preferring C57BL/6J strain (Helms et al. 2006). Thus, the genes associated with heightened discounting and alcohol consumption may not be identical in rats and mice (see discussion of locomotor activity below). In addition, HAD and LAD rats have most non-alcohol related genes in common, while DBA/2J and C57BL/6J mice have different alleles at many non-alcohol-related genes. Therefore, the differences in delay discounting between these mouse lines may be due to factors unrelated to their ethanol preference phenotypes. Further, mice respond less reliably than rats in discounting procedures (unpublished observation), reducing the sensitivity of the assessment in mice.
Behavioral correlations
Some believe that delay and probability discounting are analogous processes, i.e. choosing an uncertain reward with a probability of 0.25, resulting in, on average, delivery of a reinforcer every fourth trial is similar to having a long delay between response and reinforcer delivery (Mazur 1989, Hayden and Platt 2007). Other studies suggest that although delay and probability discounting share some underlying processes and can be modeled with the same hyperbolic equation, they are distinguishable from one another behaviorally and neurologically (Rachlin et al. 1991, Green et al. 1999, Adriani and Laviola 2006). Studies in human subjects have found weak positive relationships between probability and delay discounting (Richards et al. 1999), indicating that some but not all aspects of these tasks are related. If delay and probability discounting were essentially the same process, then bias (b) and the discount parameter (k) should be correlated between the two tasks. We found a weak positive correlation for k-values, but no such correlation for bias between the two tasks.
The relationship between delay discounting performance and preference or consumption of reinforcer is not well understood. Establishing that animals have similarly strong preferences for the reinforcer is an important control. If, for example, we had used alcohol instead of sucrose as a reinforcer, the results of the study would be difficult to interpret simply because LAD rats are relatively averse to ethanol, while HAD rats exhibit a much stronger preference for alcohol. Thus, although differences in deprivation have little effect on choice behavior (Cardinal et al. 2000, Richards et al. 1997), it is unclear how differences in preference or consumption of reinforcers might affect responding on this task. Consumption of 10% sucrose negatively correlated with both b and k for the delay discounting task, but did not correlate with either in the probability discounting task. That is, the more animals drink of the 10% sucrose solution the less sensitive they were to devaluation of the large 150 µl reinforcer as a result of delay. In contrast, the amount of sucrose consumed was unrelated to devaluation caused by probabilistically withholding the 150 µl reinforcer. Differences in deprivation affect other aspects of the task such as reaction time and choice reaction time (Richards et al. 1997), but there were no line differences on these measures. Our results support the hypothesis that delay- and probability discounting are dissociable experimental measures.
Locomotor activity predicts delay discounting in mice (Isles et al. 2004), but not rats (Perry et al. 2005). Our results support the finding by Perry and colleagues and suggest that locomotor activity is not correlated with delay or probability discounting in rats. HAD rats were significantly more active than LAD rats, but this did not correlate with individual differences in discounting parameters. For the LAD2 rats, the rats with the lowest levels of activity tended to have the highest k values within the line, thus nullifying the potential positive correlation. A significant correlation may have been apparent if a larger number of rats were tested. Differences in locomotor activity between HAD and LAD rats have not been observed previously (Overstreet et al. 1997, Nowak et al. 2000), however, the current study is the first to examine the HAD2 and LAD2 replicate line. In contrast, the P and NP rats do exhibit a difference in locomotor activity, with P rats being more active than NP rats (Nowak et al. 2000). There were also line differences in sucrose drinking, with LAD rats tending to drink more 10% sucrose than HAD rats. This effect was driven by differences between HAD1 and LAD1 animals and was not observed in the HAD2 and LAD2 lines. Inclusion of 10% sucrose consumption as a covariate in the analysis of delay discounting did not alter the statistical outcome, suggesting that differences in sucrose consumption were not solely responsible for the observed line differences. Differences between HAD and LAD replicates are not uncommon, for instance HAD1 rats exhibited higher levels of operant ethanol self-administration than HAD2 rats (Files et al. 1998). No differences were observed between LAD1 and LAD2 rats in this task. HAD2 rats consume more ethanol than LAD2 rats by having larger and more frequent drinking bouts per day, whereas HAD1 rats drink fewer bouts per day, but have larger bouts than HAD2 rats (Files et al. 1998).
Conclusions
This study found a significant and replicable relationship between heightened sensitivity to delayed and probabilistic rewards and a genetic predisposition to high alcohol consumption. This indicates that heightened sensitivity to these reward costs may exist prior to drug use, and therefore, may serve as a risk factor in humans for developing an alcohol abuse disorder. This is the first study demonstrating a strong relationship between sensitivity to delayed or probabilistic outcomes and a predisposition to high alcohol drinking in rats. It is not clear if this finding will generalize to other selectively bred lines for high alcohol drinking, or to other models of alcohol-associated behaviors such as sensitization or withdrawal. Future studies attempting to determine the specific proteins/neurotransmitters involved in mediating this behavior may provide important and useful pharmacotherapeutic targets that may aid in preventing the development of alcohol abuse disorders.
Supplementary Material
Acknowledgements
Supported by grant AA007468 (CJW), DA016727 (SHM)
We would like to thank the NIAAA-funded Indiana Alcohol Research Center (R24 AA015512-01) for providing us with the HAD and LAD animals used in this study and Kirigin Elstad for her assistance with data collection.
Footnotes
Portions of the abstract of this manuscript have been previously published in the 2007 and 2008 annual meetings of the Research Society on Alcoholism Supplement.
References
- Acheson A, Farrar AM, Patak M, Hausknecht KA, Kieres AK, Choi S, de Wit H, Richards JB. Nucleus accumbens lesions decrease sensitivity to rapid changes in the delay to reinforcement. Behav Brain Res. 2006;16:217–228. doi: 10.1016/j.bbr.2006.06.024. [DOI] [PMC free article] [PubMed] [Google Scholar]
- Adriani W, Laviola G. Delay aversion but preference for large and rare rewards in two choice tasks: implications for the measurement of self-control parameters. BMC Neurosci. 2006;7:52. doi: 10.1186/1471-2202-7-52. [DOI] [PMC free article] [PubMed] [Google Scholar]
- Anderson KG, Woolverton WL. Effects of clomipramine on self-control choice in Lewis and Fischer 344 rats. Pharmacol Biochem Behav. 2005;80:387–393. doi: 10.1016/j.pbb.2004.11.015. [DOI] [PMC free article] [PubMed] [Google Scholar]
- Cardinal RN, Robbins TW, Everitt BJ. The effects of d-amphetamine, chlordiasepoxide, alpha-flupenthixol and behavioural manipulations on choice of signaled and unsignalled delayed reinforcement in rats. Psychopharmacology. 2000;152:362–375. doi: 10.1007/s002130000536. [DOI] [PubMed] [Google Scholar]
- Estle SJ, Green L, Myerson J, Holt DD. Differential effects of amount on temporal and probability discounting of gains and losses. Mem Cognit. 2006;34:914–928. doi: 10.3758/bf03193437. [DOI] [PubMed] [Google Scholar]
- Files FJ, Samson HH, Denning CE, Marvin S. Comparison of alcohol-preferring and nonpreferring selectively bred rat lines. II. Operant self-administration in a continuous-access situation. Alcohol Clin Exp Res. 1998;22:2147–2158. [PubMed] [Google Scholar]
- Goodwin DW, Schulsinger F, Moller N, Hermansen L, Winokur G, Guze SB. Drinking problems in adopted and nonadopted sons of alcoholics. Archives of General Psychiatry. 1974;31:164–169. doi: 10.1001/archpsyc.1974.01760140022003. [DOI] [PubMed] [Google Scholar]
- Green L, Myerson J, Ostaszewski P. Amount of reward has opposite effects on the discounting of delayed and probabilistic outcomes. J Exp Psychol Learn Mem Cogn. 1999;25:418–427. doi: 10.1037//0278-7393.25.2.418. [DOI] [PubMed] [Google Scholar]
- Hayden BY, Platt ML. Temporal discounting predicts risk sensitivity in rhesus macaques. Curr Biol. 2007;17:49–53. doi: 10.1016/j.cub.2006.10.055. [DOI] [PMC free article] [PubMed] [Google Scholar]
- Helms CM, Reeves JM, Mitchell SH. Impact of strain and D-amphetamine on impulsivity (delay discounting) in inbred mice. Psychopharmacology. 2006;188:144–151. doi: 10.1007/s00213-006-0478-0. [DOI] [PubMed] [Google Scholar]
- Isles AR, Humby T, Walters E, Wilkinson LS. Common genetic Effects on variation in impulsivity and activity in mice. J Neurosci. 2004;24:6733–6740. doi: 10.1523/JNEUROSCI.1650-04.2004. [DOI] [PMC free article] [PubMed] [Google Scholar]
- Logue AW. Research on self-control: an integrating framework. Behav Brain Sci. 1988;11:665–709. [Google Scholar]
- Mazur JE. An adjusting procedure for studying delayed reinforcement. In: Commons ML, Mazur JE, Nevin JA, Rachlin H, editors. Quantitative Analysis of Behavior: The Effects of Delay and of Intervening Events on Reinforcement Value. Vol. 5. Hillsdale, NJ: Lawrence Erlbaum Associates; 1987. pp. 55–73. [Google Scholar]
- Mazur JE. Theories of probabilistic reinforcement. J Exp Anal Behav. 1989;51:87–99. doi: 10.1901/jeab.1989.51-87. [DOI] [PMC free article] [PubMed] [Google Scholar]
- McBride WJ, Li TK. Animal models of alcoholism: neurobiology of high alcohol-drinking behavior in rodents. Crit Rev Neurobiol. 1998;12:339–369. doi: 10.1615/critrevneurobiol.v12.i4.40. [DOI] [PubMed] [Google Scholar]
- Mitchell SH. Measures of impulsivity in cigarette smokers and non-smokers. Psychopharmacology. 1999;146:455–464. doi: 10.1007/pl00005491. [DOI] [PubMed] [Google Scholar]
- Mitchell SH, Reeves JM, Li N, Phillips TJ. Delay discounting predicts behavioral sensitization to ethanol in outbred WSC mice. Alcohol Clin Exp Res. 2006;30:429–437. doi: 10.1111/j.1530-0277.2006.00047.x. [DOI] [PubMed] [Google Scholar]
- Ohmura Y, Takahashi T, Kitamura M. Discounting delayed and probabilistic monetary gains and losses by smokers of cigarettes. Psychopharmacology. 2005;182:508–515. doi: 10.1007/s00213-005-0110-8. [DOI] [PubMed] [Google Scholar]
- Nowak KL, Ingraham CM, Mckinzie DL, McBride WJ, Lumeng L, Li TK, Murphy JM. An assessment of novelty-seeking behavior in alcohol-preferring and nonpreferring rats. Pharmacol Biochem Behav. 2000;66:113–121. doi: 10.1016/s0091-3057(00)00206-9. [DOI] [PubMed] [Google Scholar]
- Overstreet DH, Halikas JA, Seredenin SB, Kampov-Polevoy AB, Viglinskaya IV, Kashevskaya O, Badishtov BA, Knapp DJ, Mormede P, Kiianmaa K, Li TK, Rezvani AH. Behavioral similarities and differences among alcohol-preferring and – nonpreferring rats: confirmation by factor analysis and extension to additional groups. Alcohol Clin Exp Res. 1997;21:840–848. [PubMed] [Google Scholar]
- Perry JL, Larson EB, German JP, Madden GJ, Carrol ME. Impulsivity (delay discounting) as a predictor of acquisition of IV cocaine self-administration in female rats. Psychopharmacology. 2005;178:193–201. doi: 10.1007/s00213-004-1994-4. [DOI] [PubMed] [Google Scholar]
- Petry NM. Delay discounting of money and alcohol in actively using alcoholics, currently abstinent alcoholics, and controls. Psychopharmacology. 2001;154:243–250. doi: 10.1007/s002130000638. [DOI] [PubMed] [Google Scholar]
- Petry NM, Kirby KN, Kranzler HR. Effects of gender and family history of alcohol dependence on a behavioral task of impulsivity in healthy subjects. J Stud Alcohol. 2002;63:83–90. [PubMed] [Google Scholar]
- Rachlin H, Green L. Commitment, choice and self-control. J Exp Anal Behav. 1972;17:15–22. doi: 10.1901/jeab.1972.17-15. [DOI] [PMC free article] [PubMed] [Google Scholar]
- Rachlin H, Raineri A, Cross D. Subjective probability and delay. J Exp Anal Behav. 1991;55:233–244. doi: 10.1901/jeab.1991.55-233. [DOI] [PMC free article] [PubMed] [Google Scholar]
- Reynolds B, Richards JB, Horn K, Karraker K. Delay discounting and probability discounting as related to cigarette smoking status in adults. Behav Processes. 2004;30:35–42. doi: 10.1016/s0376-6357(03)00109-8. [DOI] [PubMed] [Google Scholar]
- Richards JB, Mitchell SH, de Wit H, Seiden LS. Determination of discount functions in rats with an adjusting amount procedure. J Exp Anal Behav. 1997;67:353–366. doi: 10.1901/jeab.1997.67-353. [DOI] [PMC free article] [PubMed] [Google Scholar]
- Richards JB, Zhang L, Mitchell SH, de Wit H. Delay or probability discounting in a model of impulsive behavior: effect of alcohol. J Exp Anal Behav. 1999;71:121–143. doi: 10.1901/jeab.1999.71-121. [DOI] [PMC free article] [PubMed] [Google Scholar]
- Steinmetz JE, Blankenship MR, Green JT, Smith GB, Finn PR. Evaluation of behavioral disinhibition in P/NP and HAD1/LAD1 rats. Prog Neuropsychopharmacol Biol Psychiatry. 2000;24:1025–1039. doi: 10.1016/s0278-5846(00)00122-6. [DOI] [PubMed] [Google Scholar]
- Vuchinich RE, Simpson CA. Hyperbolic temporal discounting in social drinkers and problem drinkers. Exp Clin Psychopharmacol. 1998;6:292–305. doi: 10.1037//1064-1297.6.3.292. [DOI] [PubMed] [Google Scholar]
- Wilhelm CJ, Reeves JM, Phillips TJ, Mitchell SH. Mouse lines selected for alcohol consumption differ on certain measures of impulsivity. Alcohol Clin Exp Res. 2007;31:1839–1845. doi: 10.1111/j.1530-0277.2007.00508.x. [DOI] [PubMed] [Google Scholar]
- Yi R, Chase WD, Bickel WK. Probability discounting among cigarette smokers and nonsmokers: molecular analysis discerns group differences. Behav Pharmacol. 2007;18:633–639. doi: 10.1097/FBP.0b013e3282effbd3. [DOI] [PubMed] [Google Scholar]
Associated Data
This section collects any data citations, data availability statements, or supplementary materials included in this article.