

Abstract
Background
Despite population declines in all-cause mortality, women with diabetes may have experienced an increase in mortality rates as compared to men.
Methods and Results
We examined change in all-cause, cardiovascular (CVD), and non-CVD mortality rates among Framingham Heart Study participants, who attended examinations during an “earlier” (1950-1975; n=930 deaths) and “later” time period (1976-2001; n=773 deaths). Diabetes was defined as casual glucose ≥200 mg/dL, fasting plasma glucose ≥126 mg/dL, or treatment. Among women, the hazard ratio (HR) for all-cause mortality in the later versus the earlier time period was 0.59 (95% confidence interval [CI]: 0.50-0.70; p<0.0001) for those without diabetes and 0.48 (0.32-0.71; p=0.002) for those with diabetes. Similar results were observed in men. Among women and men, the HR of CVD mortality declined among those with and without diabetes. Non-CVD mortality declined among women without diabetes (HR=0.76, p=0.01), whereas no change was observed among women with diabetes or among men with or without diabetes. Individuals with versus those without diabetes were at increased risk of all-cause mortality in the earlier (HR=2.44, p<0.0001) and later (HR=1.95, p<0.0001) time periods.
Conclusions
Reductions in all-cause mortality among women and men with diabetes have occurred over time. However, mortality rates among individuals with diabetes remain ∼2-fold higher compared to individuals without diabetes.
Keywords: diabetes mellitus, mortality, men, women
Over the past several decades there has been a marked decline in mortality from cardiovascular disease (CVD).1, 2 Despite this, diabetes remains a key risk factor for CVD, and is associated with a two to four fold higher risk of CVD, as well as an increased risk of mortality by up to three fold.3-5 Rising rates of obesity and diabetes may be increasing the burden of CVD due to diabetes, highlighting the need to better understand the morbidity and mortality related to diabetes.6, 7 Declines in mortality rates over time have been observed in people with and without diabetes.8-11 However, a recent analysis of national trends data from the National Health and Nutrition Examination Survey (NHANES) data suggested that declines in all-cause mortality have occurred among men with diabetes, but not women.4 Further, these findings suggested that women may have had an increase in mortality related to diabetes over time.
These conflicting findings may be due to differences in study methodology. Prior studies examining trends in diabetes mortality are limited by the use of self-reported diabetes status or death certificates, increasing the possibility of misclassification.4, 5 Prior work in the Framingham Heart Study has shown that CVD event rates have declined among those with and without diabetes.3 As an extension to this prior work, the purpose of the current study is to assess time-period trends in all-cause mortality among women and men with and without diabetes in the Framingham Heart Study, where diabetes status has been routinely screened for and all deaths have been adjudicated. We also secondarily examined CVD and non-CVD mortality rates over time among men and women with diabetes.
Methods
Study Sample
The Framingham Heart Study and the Framingham Offspring Cohort Study have been previously described.12-14 Briefly, the Framingham Heart Study is an ongoing prospective cohort study which began in 1948 with the enrollment of 5,209 men and women aged 28 to 62 years.12, 13 The participants underwent an examination every two years that included a medical history interview, physical examination, and laboratory tests. The Framingham Offspring Cohort began in 1971 when 5,124 offspring of the original participants and their spouses were enrolled.14 The offspring cohort underwent examinations approximately every four years. All subjects provided written informed consent and the study has been approved by the Institutional Review Board at Boston Medical Center.
For the present study, we selected individuals aged 45 to 74 years from ten serial original cohort examinations, taken four years apart, occurring from 1950 to 1990 and from all seven serial offspring examinations, taken roughly four years apart, occurring from 1971 to 2001. The participants were followed-up for death in four-year windows until December 31, 2005. Participants were able to contribute information at more than one examination provided that they survived to the following exam and were aged 45 to 74 at their next exam. For example, an individual who attended an exam in 1971 would be followed up until death or 1975 (four-year follow-up window), whichever occurred first. The four-year follow-up window was used so that diabetes status could be updated at each exam the participant attended. The four-year risk periods were pooled for each individual making this approach equivalent to a long-term Cox model with age and diabetes status as time-dependent variables.15
We divided the study sample into two 25-year time periods according to the calendar year of examinations: the “earlier period” for examinations occurring from 1950 to 1975, and the “later period” for examinations occurring from 1976 to 2001. The total follow-up period for death was 1950-1979 (1975 + 4-year follow-up window) for participants attending examinations during the earlier time period and 1976-2005 (2001 + 4-year follow-up window) for participants attending examinations during the later period. There were 78,156 person-years and 930 deaths in the earlier period and 79,000 person-years and 773 deaths in the later period.
Outcome Assessment
The primary outcome of interest was all-cause mortality. We secondarily examined mortality from CVD and non-CVD causes. All deaths were adjudicated by a panel of three investigators, using previously described criteria.16 Information on cause of death was obtained from death certificates, hospital admission records, medical records, and family members. CVD was identified as the cause of death if any of the following conditions were responsible for the death: coronary heart disease, intermittent claudication, congestive heart failure, stroke, or transient ischemic attack.
Diabetes Status Assessment
Participants were considered to have diabetes if they had a fasting plasma glucose level of ≥126 mg/dL (for the offspring cohort), a casual plasma glucose level of ≥200 mg/dL (for the original cohort) or if they reported treatment with insulin or an oral hypoglycemic agent. All participants with type I diabetes, as identified by chart review, were excluded from the analysis.
Statistical Methods
A Cox proportional hazards model using pooled repeated observations was fit to estimate hazard ratios (HR) and 95% confidence intervals with follow-up time used as the time scale. Four-year mortality rates were calculated as the total number of deaths divided by the total number of person-years of follow-up. Mortality rates for the total study sample were directly adjusted for age (in 5-year age groups) and sex. In the primary analysis, separate models were fit for those with and without diabetes for the total study sample and for men and women separately. All models were adjusted for age and the models for the total study sample were additionally adjusted for sex. The primary comparison of interest was the HR comparing all-cause mortality in the later period to the earlier period among both those with diabetes and those without diabetes. A dichotomous variable for time period was entered into the Cox model and its significance was assessed by a one degree of freedom Wald test. In order to assess the interaction between time period and sex, a cross product term for time period by sex was entered into each model and its significance was assessed by a one degree of freedom likelihood ratio test.
We also compared the HR of all-cause mortality for individuals with diabetes to those without diabetes within each time period. Models were fit separately for the earlier time period and the later time period for the total study sample and for men and women separately. The interaction between diabetes status and sex within each time period was assessed. In secondary analyses, we stratified all-cause mortality into its components and separately examined trends in CVD and non-CVD mortality over time.
In a secondary analysis, we redesigned our analysis in order to compare our main results with a prior analysis conducted using NHANES data.4 The NHANES analysis compared three different time periods ranging from 1971 to 1994 (1971-1975, 1976-1980, 1988-1994). Due to the overlapping nature of the NHANES follow-up periods (which is possible since they have a different cohort of individuals at each time period), we were not able to construct three separate time periods using our data. However, we constructed two periods that are equivalent in calendar time to the first (1971-1975) and third (1988-1994) NHANES surveys, which was the main comparison of interest. We also used a 12-year follow-up period instead of the 4-year follow-up window in our primary analysis and included ages 35 to 74 years to match the NHANES study design more closely.
Since the original and offspring Framingham cohorts used different definitions for assessing diabetes status, we performed a sensitivity analysis to examine the effect of changing the original cohort's definition of diabetes (casual plasma glucose ≥ 200 mg/dL or diabetes treatment). Models were fit that changed the cohort diabetes definition from ≥200 mg/dL to ≥150 mg/dL by decrements of 10 mg/dL.
A p-value of <0.05 was considered statistically significant. All analyses were performed using SAS version 8.1 (Cary, North Carolina). The proportional hazards assumption was assessed graphically using log –log plots from PROC LIFETEST in SAS and was met for all variables considered. The authors had full access to the data and take responsibility for its integrity. All authors have read and agree to the manuscript as written.
Results
Study Sample Characteristics
In the earlier period, 3.5% of women and 4.5% of men had diabetes while in the later period 7.0% of women and 11.2% of men had diabetes (Table 1). Additional characteristics of the study sample are presented in Table 1.
Table 1.
Characteristics of the study sample, by sex and time period, in the Framingham Heart Study.
| Characteristics | Earlier Period (1950-1975) | Later Period (1976-2001) |
|---|---|---|
| Women | ||
| No. of person-years | 43,992 | 42,592 |
| Age (years), mean (SD) | 56.9 (7.6) | 59.7 (8.3) |
| Diabetes*, % | 3.5 | 7.0 |
| Prevalent CVD† at index exam, % | 2.5 | 3.7 |
| Men | ||
| No. of person-years | 34,164 | 36,409 |
| Age (years), mean (SD) | 56.5 (7.5) | 59.4 (8.1) |
| Diabetes*, % | 4.5 | 11.2 |
| Prevalent CVD† at index exam, % | 5.5 | 9.5 |
Abbreviations: SD, standard deviation; CVD, cardiovascular disease
There are 399 individuals with diabetes in the earlier period and 679 individuals with diabetes in the later period.
CVD defined as myocardial infarction, stroke, or congestive heart failure
Trends in All-Cause Mortality
The age- and sex-adjusted all-cause mortality rates (per 1,000 person-years) decreased from 12.8 to 7.7 among those without diabetes and from 33.1 to 15.8 among those with diabetes, corresponding to a 40% and a 48% reduced risk of death, respectively (Table 2). The results in the sex-specific analysis for all-cause mortality paralleled those in the total study sample. Both women and men with and without diabetes had a significantly decreased risk of all-cause mortality in the later period compared to the earlier period (Figure 1; Table 2).
Table 2.
Hazard ratios of mortality comparing the later to the earlier period*, by diabetes status, in the Framingham Heart Study.
| Earlier Period (1950-1975) | Later Period (1976-2001) | Later vs. Earlier Hazard Ratio (95% CI) | P Value | |||||
|---|---|---|---|---|---|---|---|---|
| No. Deaths | No. P-Y | Mortality Rate per 1000 P-Y | No. Deaths | No. P-Y | Mortality Rate per 1000 P-Y | |||
| Women and Men Combined† | ||||||||
| All-cause mortality§ | ||||||||
| No Diabetes | 821 | 75,200 | 12.8 | 614 | 72,131 | 7.7 | 0.60 (0.54, 0.66) | <.0001 |
| Diabetes | 109 | 2,956 | 33.1 | 159 | 6,869 | 15.8 | 0.52 (0.41, 0.67) | <.0001 |
| CVD mortality‖ | ||||||||
| No Diabetes | 400 | 75,200 | 6.3 | 193 | 72,131 | 2.4 | 0.38 (0.32, 0.45) | <.0001 |
| Diabetes | 81 | 2,956 | 24.1 | 70 | 6,869 | 6.8 | 0.31 (0.22, 0.43) | <.0001 |
| Non-CVD mortality # | ||||||||
| No Diabetes | 383 | 75,200 | 5.9 | 379 | 72,131 | 4.8 | 0.81 (0.70, 0.93) | 0.004 |
| Diabetes | 26 | 2,956 | 8.5 | 73 | 6,869 | 7.6 | 1.01 (0.65, 1.60) | 0.95 |
| Women‡ | ||||||||
| All-cause mortality§ | ||||||||
| No Diabetes | 328 | 42,505 | 8.8 | 238 | 39,708 | 5.2 | 0.59 (0.50, 0.70) | <.0001 |
| Diabetes | 49 | 1,487 | 30.8 | 50 | 2,884 | 12.3 | 0.48 (0.32, 0.71) | 0.002 |
| CVD mortality‖ | ||||||||
| No Diabetes | 135 | 42,505 | 3.7 | 64 | 39,708 | 1.3 | 0.35 (0.26, 0.47) | <.0001 |
| Diabetes | 35 | 1,487 | 21.0 | 22 | 2,884 | 5.3 | 0.29 (0.17, 0.50) | <.0001 |
| Non-CVD mortality # | ||||||||
| No Diabetes | 177 | 42,505 | 4.6 | 153 | 39,708 | 3.5 | 0.76 (0.61, 0.95) | 0.01 |
| Diabetes | 14 | 1,487 | 9.7 | 24 | 2,884 | 6.1 | 0.80 (0.41, 1.56) | 0.52 |
| Men‡ | ||||||||
| All-cause mortality§ | ||||||||
| No Diabetes | 493 | 32,695 | 17.7 | 376 | 32,424 | 10.8 | 0.60 (0.52, 0.69) | <.0001 |
| Diabetes | 60 | 1,469 | 36.1 | 109 | 3,985 | 20.1 | 0.55 (0.40, 0.76) | 0.0002 |
| CVD mortality‖ | ||||||||
| No Diabetes | 265 | 32,695 | 9.4 | 129 | 32,424 | 3.7 | 0.39 (0.31, 0.48) | <.0001 |
| Diabetes | 46 | 1,469 | 27.8 | 48 | 3,985 | 8.5 | 0.32 (0.21, 0.47) | <.0001 |
| Non-CVD mortality # | ||||||||
| No Diabetes | 206 | 32,695 | 7.5 | 226 | 32,424 | 6.5 | 0.85 (0.70, 1.03) | 0.09 |
| Diabetes | 12 | 1,469 | 7.1 | 49 | 3,985 | 9.5 | 1.23 (0.65, 2.33) | 0.52 |
Abbreviations: P-Y, person-years; CI, confidence interval
Total follow-up period is 1950-1979 for earlier period and 1976-2005 for later period.
Mortality rates and relative risks are adjusted for age and sex.
Mortality rates and relative risks are adjusted for age.
Likelihood ratio test for sex by time period interaction: p-value= 0.92 for non-DM, 0.50 for DM
Likelihood ratio test for sex by time period interaction: p-value= 0.95 for non-DM, 0.75 for DM
Likelihood ratio test for sex by time period interaction: p-value= 0.17 for non-DM, 0.32 for DM
Note: CVD deaths and non-CVD deaths do not sum to all-cause deaths due to the presence of deaths of unknown cause in the all-cause mortality group
Figure 1.
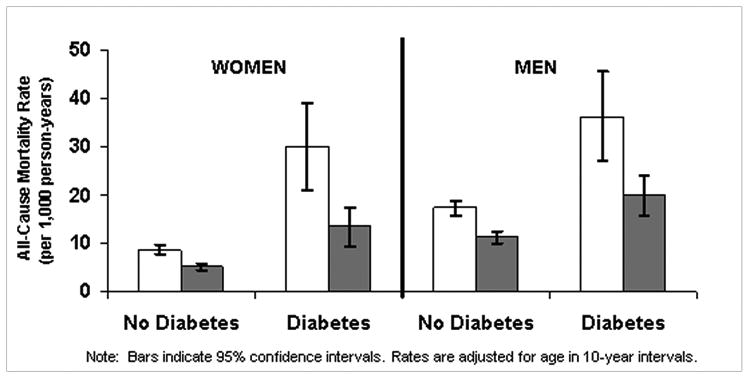

Figure 1a. Age-adjusted all-cause mortality rates among participants with and without diabetes, by sex and time period.
Figure 1b. Age-adjusted cardiovascular disease (CVD) mortality rates among participants with and without diabetes, by sex and time period.
The association between diabetes status and risk of mortality by time period is presented in Table 3. Within both the earlier and the later time periods, participants with diabetes had a two-fold increased risk of all-cause mortality compared to those without diabetes. In sex-specific analyses, women had approximately a three-fold increased risk of mortality associated with diabetes while men had approximately a two-fold increased risk (Table 3). The p-value for the interaction between sex and diabetes status was 0.05 for the earlier period and 0.20 for the later period.
Table 3.
Hazard ratios of mortality comparing participants with diabetes to those without diabetes, by time period*, in the Framingham Heart Study.
| Hazard Ratio of Diabetes (95% CI) |
P Value | |
|---|---|---|
| Women and Men Combined† | ||
| All-cause mortality§ | ||
| Earlier Period | 2.44 (1.99, 2.98) | <.0001 |
| Later Period | 1.95 (1.64, 2.33) | <.0001 |
| CVD mortality‖ | ||
| Earlier Period | 3.61 (2.84, 4.60) | <.0001 |
| Later Period | 2.61 (1.98, 3.45) | <.0001 |
| Non-CVD mortality # | ||
| Earlier Period | 1.28 (0.86, 1.90) | 0.23 |
| Later Period | 1.49 (1.16, 1.92) | 0.002 |
| Women‡ | ||
| All-cause mortality§ | ||
| Earlier Period | 3.13 (2.31, 4.25) | <.0001 |
| Later Period | 2.29 (1.69, 3.12) | <.0001 |
| CVD mortality‖ | ||
| Earlier Period | 5.08 (3.48, 7.41) | <.0001 |
| Later Period | 3.49 (2.15, 5.67) | <.0001 |
| Non-CVD mortality # | ||
| Earlier Period | 1.76 (1.02, 3.05) | 0.04 |
| Later Period | 1.81 (1.17, 2.78) | 0.007 |
| Men‡ | ||
| All-cause mortality§ | ||
| Earlier Period | 2.05 (1.57, 2.69) | <.0001 |
| Later Period | 1.81 (1.46, 2.25) | <.0001 |
| CVD mortality‖ | ||
| Earlier Period | 2.95 (2.15, 4.05) | <.0001 |
| Later Period | 2.35 (1.68, 3.28) | <.0001 |
| Non-CVD mortality# | ||
| Earlier Period | 0.96 (0.54, 1.72) | 0.89 |
| Later Period | 1.35 (0.99, 1.84) | 0.06 |
Abbreviations: P-Y, person-years; CI, confidence interval
Earlier period consists of examinations attended 1950-1975 (total follow-up period is 1950-1979) and later period consists of examinations attended 1976-2001 (total follow-up period is 1976-2005).
Mortality rates and relative risks are adjusted for age and sex.
Mortality rates and relative risks are adjusted for age.
Likelihood ratio test for sex by diabetes interaction: p-value=0.05 for earlier period, 0.20 for later period
Likelihood ratio test for sex by diabetes interaction: p-value=0.02 for earlier period, 0.10 for later period
Likelihood ratio test for sex by diabetes interaction: p-value=0.21 for earlier period, 0.38 for later period
Note: CVD deaths and non-CVD deaths do not sum to all-cause deaths due to the presence of deaths of unknown cause in the all-cause mortality group
Trends in CVD Mortality
The results for CVD mortality were similar to those for all-cause mortality. Among the total study sample, participants without diabetes had a 62 percent decline in CVD mortality and participants with diabetes had a 69 percent decline (Table 2). Similar magnitudes of decline in CVD mortality were observed when the analysis was performed separately by sex.
When comparing diabetes to non-diabetes in the total study sample, participants with diabetes had nearly a four-fold increased risk of CVD mortality in the earlier time period and nearly a three-fold increased risk in the later time period (Table 3). In the earlier time period, comparing those with diabetes to those without diabetes, the HR for CVD mortality was 5.08 (p<0.0001) for women and 2.95 (p<0.0001) for men. In the later time period, the HRs of CVD mortality were 3.49 (p<0.0001) for women and 2.35 (p<0.0001) for men. There was a statistically significant interaction for CVD mortality between sex and diabetes status in the earlier time period (p-interaction=0.02).
Trends in Non-CVD Mortality
In the total study sample, individuals without diabetes had a 19 percent decrease in non-CVD mortality rates while individuals with diabetes had no change in mortality rates (p=0.95) when comparing the earlier and later time periods (Table 2). In sex-specific analyses, only women without diabetes but not men without diabetes had a statistically significantly reduced risk of non-CVD mortality between the two time periods. Both women and men with diabetes had no change in the rates of non-CVD mortality between the earlier and later periods.
In sex-specific analyses, as shown in Table 3, women with diabetes were at increased risk of non-CVD mortality compared to those without diabetes in both the earlier (HR=1.76, 95%CI: 1.02-3.05, p=0.04) and later (HR=1.81, 95%CI: 1.17-2.78, p=0.007) time periods. Among men, there was no difference in the risk of non-CVD mortality comparing those with diabetes to those without diabetes in the earlier time period. However, in the later period, men with diabetes appeared to be at increased risk of non-CVD mortality relative to those without diabetes, although the difference was not statistically significant (p=0.06). The interaction between sex and diabetes status was not statistically significant in either the earlier or later time periods (p=0.21 for earlier period; p=0.38 for later period).
Secondary Analyses
One of our goals was to compare our results with a prior analysis published which used NHANES data.4 Since the NHANES analysis compared different time periods, had a wider age range, and a longer follow-up window than our primary analysis, we restructured our primary analysis to be comparable. Some notable differences did emerge between our primary analysis presented in Table 2 and our restructured analysis. The results for our restructured analysis are presented in Table 4. Among the total study sample, the magnitude of decline in all-cause mortality was less prominent when comparing the earlier to the later time period, especially among individuals with diabetes. Among women with and without diabetes, the difference between the earlier and later period was not as pronounced compared to our primary analysis (DM, HR=0.76 vs. 0.48; non-DM, HR=0.74 vs. 0.59). Furthermore, the hazard ratio for all-cause mortality among women with diabetes was no longer statistically significant (p=0.24), although the magnitude of the hazard ratio was similar for women with and without diabetes (HR=0.76 vs. 0.74), likely due to fewer deaths among women with diabetes in the restructured analysis. For CVD mortality, we did not observe any differences between our restructured analysis and our primary analysis (DM, HR=0.38 vs. 0.29; non-DM, HR=0.38 vs. 0.35). For non-CVD mortality, in our restructured analysis, we did not observe a decline in mortality among individuals without diabetes, among men and women combined, as we did in our primary analysis. Additionally, among women, we did not observe a decline in non-CVD mortality among those without diabetes in the restructured analysis as we did in our primary analysis. Among women with diabetes, there was a suggestion of an increased risk of non-CVD mortality, although the hazard ratio was not statistically significant.
Table 4.
Hazard ratios of mortality comparing the later to the earlier period, by diabetes status, using the analysis strategy from a prior NHANES analysis*, in the Framingham Heart Study.
| Earlier Period (1971-1974) | Later Period (1988-1994) | Later vs. Earlier Hazard Ratio (95% CI) | P Value | |||||
|---|---|---|---|---|---|---|---|---|
| No. Deaths | No. P-Y | Mortality Rate per 1000 P-Y | No. Deaths | No. P-Y | Mortality Rate per 1000 P-Y | |||
| Women and Men Combined† | ||||||||
| All-cause mortality§ | ||||||||
| No Diabetes | 747 | 63,372 | 13.1 | 520 | 50,435 | 11.9 | 0.70 (0.63, 0.79) | <.0001 |
| Diabetes | 114 | 2,805 | 32.7 | 124 | 3,299 | 26.2 | 0.77 (0.60, 1.00) | 0.05 |
| CVD mortality‖ | ||||||||
| No Diabetes | 302 | 63,372 | 5.4 | 123 | 50,435 | 2.9 | 0.40 (0.33, 0.50) | <.0001 |
| Diabetes | 73 | 2,805 | 21.5 | 44 | 3,299 | 10.0 | 0.42 (0.29, 0.61) | <.0001 |
| Non-CVD mortality # | ||||||||
| No Diabetes | 395 | 63,372 | 6.9 | 366 | 50,435 | 8.3 | 0.95 (0.82, 1.10) | 0.49 |
| Diabetes | 34 | 2,805 | 9.3 | 66 | 3,299 | 13.7 | 1.40 (0.92, 2.12) | 0.12 |
| Women‡ | ||||||||
| All-cause mortality§ | ||||||||
| No Diabetes | 316 | 34,668 | 9.9 | 225 | 27,721 | 8.8 | 0.74 (0.62, 0.88) | 0.0006 |
| Diabetes | 43 | 1,218 | 25.4 | 35 | 1,353 | 19.2 | 0.76 (0.49, 1.20) | 0.24 |
| CVD mortality‖ | ||||||||
| No Diabetes | 108 | 34,668 | 3.5 | 44 | 27,721 | 1.7 | 0.38 (0.27, 0.54) | <.0001 |
| Diabetes | 30 | 1,218 | 18.8 | 12 | 1,353 | 6.6 | 0.38 (0.19, 0.74) | 0.005 |
| Non-CVD mortality # | ||||||||
| No Diabetes | 179 | 34,668 | 5.5 | 166 | 27,721 | 6.5 | 1.00 (0.81, 1.24) | 0.99 |
| Diabetes | 10 | 1,218 | 5.6 | 21 | 1,353 | 11.6 | 1.94 (0.91, 4.11) | 0.09 |
| Men‡ | ||||||||
| All-cause mortality§ | ||||||||
| No Diabetes | 431 | 28,704 | 16.8 | 295 | 22,714 | 15.3 | 0.68 (0.59, 0.79) | <.0001 |
| Diabetes | 71 | 1,587 | 41.2 | 89 | 1,946 | 34.2 | 0.77 (0.56, 1.06) | 0.10 |
| CVD mortality‖ | ||||||||
| No Diabetes | 194 | 28,704 | 7.6 | 79 | 22,714 | 4.1 | 0.41 (0.32, 0.53) | <.0001 |
| Diabetes | 43 | 1,587 | 24.6 | 32 | 1,946 | 13.8 | 0.44 (0.27, 0.70) | 0.0005 |
| Non-CVD mortality # | ||||||||
| No Diabetes | 216 | 28,704 | 8.4 | 200 | 22,714 | 10.4 | 0.91 (0.75, 1.11) | 0.34 |
| Diabetes | 24 | 1,587 | 13.5 | 45 | 1,946 | 16.2 | 1.15 (0.70, 1.91) | 0.58 |
Abbreviations: P-Y, person-years; CI, confidence interval
This analysis was structured to parallel that found in an prior study done using NHANES data4
The changes from our main analysis include: 1.) expanding age range at index exam to 35-74 years, 2.) increasing follow-up window from 4 to 12 years, 3.) using exams occuring from 1971-74 for the earlier period and 1988-94 for the later period. A total of 119,911 person-years and 1,505 deaths were included in the analysis.
Mortality rates and relative risks are adjusted for age and sex.
Mortality rates and relative risks are adjusted for age.
Likelihood ratio test for sex by time period interaction: p-value= 0.48 for non-DM, 0.96 for DM
Likelihood ratio test for sex by time period interaction: p-value= 0.84 for non-DM, 0.71 for DM
Likelihood ratio test for sex by time period interaction: p-value= 0.77 for non-DM, 0.27 for DM
Note: CVD deaths and non-CVD deaths do not sum to all-cause deaths due to the presence of deaths of unknown cause in the all-cause mortality group
We performed a sensitivity analysis to examine the effect of changing the original cohort's definition of diabetes of non-fasting plasma glucose of ≥200 mg/dL to ≥160 mg/dL by 10 mg/dL units (Online Supplemental Figure 1). Overall, changing the diabetes definition for the cohort minimally affected the HR estimates.
Excluding those with prevalent CVD at the index exam resulted in similar findings to our main analysis (Online Supplemental Table 1).
Discussion
Our findings from an analysis of mortality trends among participants with and without diabetes in the Framingham Heart Study are three-fold. First, contrary to recent NHANES findings, we observed a decline in all-cause mortality rates among both men and women with and without diabetes when comparing the earlier to the later time period. We also observed a decline in CVD mortality between the earlier and later time periods. Second, there was no change in non-CVD mortality rates among women or men with diabetes over time, and women with diabetes had approximately a two-fold higher risk of death from non-CVD causes than women without diabetes in both the earlier and later time periods. Lastly, we observed that men and women with diabetes continue to remain at a higher risk of all-cause and CVD mortality than their counterparts without diabetes.
There are several factors that may explain the decrease in mortality rates over time among those with and without diabetes. In recent decades there have been improvements in major CVD risk factors, including reductions in smoking prevalence, total cholesterol, and systolic blood pressure levels.6 Additionally, recent advances in secondary prevention therapies have also occurred which may have contributed to the decline.6 Decreases in incidence rates of CVD events have been observed among individuals both with and without diabetes.3 These substantial declines in mortality rates among individuals with diabetes over time are especially important to consider in light of the recent clinical trials which failed to find benefit of intensive as compared to standard glucose-lowering regimens,17, 18 and emphasize the continued importance of primary and secondary prevention in the overall reduction of mortality in individuals with diabetes over time.
We observed that non-CVD mortality was higher in both time periods in women with diabetes compared to women without diabetes, although the number of events was small. Nonetheless, these findings are supported by a prior examination of trends in non-CVD mortality among people with diabetes, which noted a significant increase in cancer mortality in the period from 1970 to 1994.9
In the Context of the Current Literature
A recent analysis of mortality trends among people with diabetes conducted using NHANES data showed that men with and without diabetes had a significant decline in all-cause mortality when comparing the time periods 1971-1986 to 1988-2000.4 However, women with and without diabetes did not have similar declines in the rates of all-cause mortality over the same time period. Among women, the absolute difference in all-cause mortality rates between those with and without diabetes more than doubled between 1971-1986 and 1988-2000. Both women and men without diabetes had significant declines in CVD mortality, but significant declines were not observed in either men or women with diabetes. In contrast, in our primary analysis, we observed strong and significant declines in all-cause and CVD mortality among both men and women with and without diabetes. However, in our analysis that was restructured to match the NHANES analysis, we did not observe a statistically significant decline in all-cause mortality among either men or women with diabetes, although substantial declines were observed among individuals with diabetes for CVD mortality. Importantly, we did not observe an increase in all-cause mortality among women in any of our analyses, as was observed in the prior analysis of NHANES data.
Potential differences in study design may explain the discrepancy in our results. Most likely, the breadth of the time period examined in the Framingham Heart Study as compared to the NHANES data could explain the disparate findings for all-cause mortality. The NHANES study period covered a narrower and more contemporary time period (1971-2000) than our primary analysis (1950-2005). For CVD mortality, additional methodologic factors may explain our disparate findings. First, NHANES relied on self-reported diabetes status while in the Framingham Heart Study, diabetes was routinely screened for using glucose measurements and medication use. A study using NHANES data revealed that the percentage of individuals with undiagnosed diabetes was 38% in 1976-1980, 36% in 1988-1994, and 29% in 1999-2000.19 A recent study showed that the sensitivity of self-reported diabetes was only 49.3% for women and 67.1% for men.20 If women are less likely to report their diabetes status correctly, it is possible that only the most severe cases of diabetes are identified through self-report. Additionally, the NHANES analysis ascertained mortality using death certificates, an approach that has been shown to overestimate CVD as a cause of death,21 whereas all deaths in FHS were adjudicated by a panel of three physicians. Therefore, misclassification of both exposure and outcome could have occurred within the NHANES analysis. Lastly, it is possible that the NHANES results differed from ours due to either the geographic variability or to the high proportion (∼20%) of non-white participants in their study sample. The Framingham Heart Study is predominantly white and may not be as representative of the general US population as is the NHANES population.
In contrast to the NHANES study, the majority of studies of mortality trends among people with diabetes have shown decreases in mortality rates over time. Three studies have been conducted in predominantly white populations, similar to the racial composition of the Framingham Heart Study. In a population-based study in Rochester, MN, where diagnosis of diabetes was based on hospital records and cause of death information was obtained from death certificates, all-cause mortality decreased by 13.8% among those with diabetes and by 21.4% in those without diabetes between 1970 and 1994.9 Similarly, an examination of North Dakota death certificate data showed that the mortality rate among persons with diabetes (as identified on the death certificate) declined by 35% between 1997 and 2002 and sex-specific rates showed a similar trend to those for the total population.10 In a study of nearly 75,000 individuals from Norway, where diabetes status was self-reported and cause of death was identified from a national death registry, statistically significant declines in CHD mortality were observed in both men and women with diabetes from 1984-1997.11
Trends in mortality rates among people with diabetes have also been conducted among in multiethnic study samples. For example, a recent study from Ontario, Canada reported a 25% decline in all-cause mortality in both women and men with diabetes from 1995 to 2005.8 Therefore, differences in the ethnic composition of our study sample as compared to NHANES are unlikely to fully account for differences in the findings.
Strengths and Limitations
Strengths of this analysis include the routine screening for diabetes using glucose measurements to define diabetes status in our study sample, instead of relying on either self-reported diabetes status or on diabetes status from hospital admission records. Self-reported diabetes status can result in misclassification, as nearly one third of total diabetes cases are undiagnosed.22 Further, self-reported diabetes status would have only identified the most severe cases in the earlier years while in the later years there are fewer undiagnosed cases. Reliance on using hospital admission records to define diabetes status only confirms a positive diabetes diagnosis among those who have been admitted to the hospital. Therefore, the use of blood glucose measurements in our study is a more sensitive and specific way of defining those with and without diabetes. Another strength of our study is the broad time period of observation, which enabled us to elucidate long-term trends.
The results of this analysis should be interpreted in light of its limitations. Our study sample is predominantly white, thus the results may not be generalizable to other ethnic or racial groups where disparities in health care may exist. Additionally, we had a small number of deaths among the diabetes group in the sex-specific analyses, and therefore power to detect a modest effect may be limited. We used a differing diabetes definition in the Original and Offspring cohorts. However, a sensitivity analysis revealed that this is unlikely to account for our findings.
Conclusion
We observed a decline in all-cause and CVD mortality rates among both men and women with and without diabetes over the period 1950-2005. Both men and women with diabetes continue to remain at a higher risk of all-cause and CVD mortality than those without diabetes. Whether the lack of decrease in non-CVD mortality rates over time among individuals with diabetes is observed in other studies warrants further investigation.
Supplementary Material
Acknowledgments
Funding Sources: This work was supported by the National Heart, Lung, and Blood Institute (NIH contract #: N01-HC-25195).
Footnotes
Disclosures:
Sarah Rosner Preis – none
Shih-Jen Hwang – none
SSean Coady – none
SMichael J. Pencina – none
SRalph B. D'Agostino – none
SPeter J. Savage – none
SDaniel Levy - none
SCaroline S. Fox-none
Sarah R. Preis and Caroline S. Fox had full access to all of the data in the study and take responsibility for the integrity of the data and the accuracy of the data analysis.
References
- 1.Cooper R, Cutler J, svigne-Nickens P, Fortmann SP, Friedman L, Havlik R, Hogelin G, Marler J, McGovern P, Morosco G, Mosca L, Pearson T, Stamler J, Stryer D, Thom T. Trends and disparities in coronary heart disease, stroke, and other cardiovascular diseases in the United States: findings of the national conference on cardiovascular disease prevention. Circulation. 2000;102:3137–3147. doi: 10.1161/01.cir.102.25.3137. [DOI] [PubMed] [Google Scholar]
- 2.Rosamond WD, Chambless LE, Folsom AR, Cooper LS, Conwill DE, Clegg L, Wang CH, Heiss G. Trends in the incidence of myocardial infarction and in mortality due to coronary heart disease, 1987 to 1994. N Engl J Med. 1998;339:861–867. doi: 10.1056/NEJM199809243391301. [DOI] [PubMed] [Google Scholar]
- 3.Fox CS, Coady S, Sorlie PD, Levy D, Meigs JB, D'Agostino RB, Sr, Wilson PW, Savage PJ. Trends in cardiovascular complications of diabetes. JAMA. 2004;292:2495–2499. doi: 10.1001/jama.292.20.2495. [DOI] [PubMed] [Google Scholar]
- 4.Gregg EW, Gu Q, Cheng YJ, Narayan KM, Cowie CC. Mortality trends in men and women with diabetes, 1971 to 2000. Ann Intern Med. 2007;147:149–155. doi: 10.7326/0003-4819-147-3-200708070-00167. [DOI] [PubMed] [Google Scholar]
- 5.Gu K, Cowie CC, Harris MI. Diabetes and decline in heart disease mortality in US adults. JAMA. 1999;281:1291–1297. doi: 10.1001/jama.281.14.1291. [DOI] [PubMed] [Google Scholar]
- 6.Ford ES, Ajani UA, Croft JB, Critchley JA, Labarthe DR, Kottke TE, Giles WH, Capewell S. Explaining the decrease in U.S. deaths from coronary disease, 1980-2000. N Engl J Med. 2007;356:2388–2398. doi: 10.1056/NEJMsa053935. [DOI] [PubMed] [Google Scholar]
- 7.Fox CS, Coady S, Sorlie PD, D'Agostino RB, Sr, Pencina MJ, Vasan RS, Meigs JB, Levy D, Savage PJ. Increasing cardiovascular disease burden due to diabetes mellitus: the Framingham Heart Study. Circulation. 2007;115:1544–1550. doi: 10.1161/CIRCULATIONAHA.106.658948. [DOI] [PubMed] [Google Scholar]
- 8.Lipscombe LL, Hux JE. Trends in diabetes prevalence, incidence, and mortality in Ontario, Canada 1995-2005: a population-based study. Lancet. 2007;369:750–756. doi: 10.1016/S0140-6736(07)60361-4. [DOI] [PubMed] [Google Scholar]
- 9.Thomas RJ, Palumbo PJ, Melton LJ, III, Roger VL, Ransom J, O'Brien PC, Leibson CL. Trends in the mortality burden associated with diabetes mellitus: a population-based study in Rochester, Minn, 1970-1994. Arch Intern Med. 2003;163:445–451. doi: 10.1001/archinte.163.4.445. [DOI] [PubMed] [Google Scholar]
- 10.Tierney EF, Cadwell BL, Engelgau MM, Shireley L, Parsons SL, Moum K, Geiss LS. Declining mortality rate among people with diabetes in North Dakota, 1997-2002. Diabetes Care. 2004;27:2723–2725. doi: 10.2337/diacare.27.11.2723. [DOI] [PubMed] [Google Scholar]
- 11.Dale AC, Vatten LJ, Nilsen TI, Midthjell K, Wiseth R. Secular decline in mortality from coronary heart disease in adults with diabetes mellitus: cohort study. BMJ. 2008;337:a236. doi: 10.1136/bmj.39582.447998.BE. [DOI] [PMC free article] [PubMed] [Google Scholar]
- 12.Dawber TR, Meadors GF, Moore FEJ. Epidemiological approaches to heart disease: the Framingham Study. Am J Public Health. 1951;41:279–286. doi: 10.2105/ajph.41.3.279. [DOI] [PMC free article] [PubMed] [Google Scholar]
- 13.Dawber TR, Kannel WB, Lyell LP. An approach to longitudinal studies in a community: the Framingham Study. Ann N Y Acad Sci. 1963;107:539–556. doi: 10.1111/j.1749-6632.1963.tb13299.x. [DOI] [PubMed] [Google Scholar]
- 14.Kannel WB, Feinleib M, McNamara PM, Garrison RJ, Castelli WP. An investigation of coronary heart disease in families. The Framingham offspring study. Am J Epidemiol. 1979;110:281–290. doi: 10.1093/oxfordjournals.aje.a112813. [DOI] [PubMed] [Google Scholar]
- 15.D'Agostino RB, Lee ML, Belanger AJ, Cupples LA, Anderson K, Kannel WB. Relation of pooled logistic regression to time dependent Cox regression analysis: the Framingham Heart Study. Stat Med. 1990;9:1501–1515. doi: 10.1002/sim.4780091214. [DOI] [PubMed] [Google Scholar]
- 16.Cupples LA, D'Agostino RB., Sr . Section 34 Some risk factors related to the annual incidence of cardiovascular disease and death in pooled repeated biennial measurements: Framingham Heart Study, 30-year follow-up (NIH publication no. 87-2703) In: Kannel WB, Wolf PA, Garrison RJ, editors. The Framingham Study: an epidemiological investigation of cardiovascular disease. National Heart, Lung, and Blood Institute; 1987. [Google Scholar]
- 17.The Action to Control Cardiovascular Risk in Diabetes Study Group. Effects of Intensive Glucose Lowering in Type 2 Diabetes. N Engl J Med. 2008;358:2545–2559. doi: 10.1056/NEJMoa0802743. [DOI] [PMC free article] [PubMed] [Google Scholar]
- 18.The ADVANCE Collaborative Group. Intensive Blood Glucose Control and Vascular Outcomes in Patients with Type 2 Diabetes. N Engl J Med. 2008;358:2560–2572. doi: 10.1056/NEJMoa0802987. [DOI] [PubMed] [Google Scholar]
- 19.Gregg EW, Cadwell BL, Cheng YJ, Cowie CC, Williams DE, Geiss L, Engelgau MM, Vinicor F. Trends in the prevalence and ratio of diagnosed to undiagnosed diabetes according to obesity levels in the U.S. Diabetes Care. 2004;27:2806–2812. doi: 10.2337/diacare.27.12.2806. [DOI] [PubMed] [Google Scholar]
- 20.Molenaar EA, Van Ameijden EJ, Grobbee DE, Numans ME. Comparison of routine care self-reported and biometrical data on hypertension and diabetes: results of the Utrecht Health Project. Eur J Public Health. 2007;17:199–205. doi: 10.1093/eurpub/ckl113. [DOI] [PubMed] [Google Scholar]
- 21.Lloyd-Jones DM, Martin DO, Larson MG, Levy D. Accuracy of death certificates for coding coronary heart disease as the cause of death. Ann Intern Med. 1998;129:1020–1026. doi: 10.7326/0003-4819-129-12-199812150-00005. [DOI] [PubMed] [Google Scholar]
- 22.Cowie CC, Rust KF, Byrd-Holt DD, Eberhardt MS, Flegal KM, Engelgau MM, Saydah SH, Williams DE, Geiss LS, Gregg EW. Prevalence of diabetes and impaired fasting glucose in adults in the U.S. population: National Health And Nutrition Examination Survey 1999-2002. Diabetes Care. 2006;29:1263–1268. doi: 10.2337/dc06-0062. [DOI] [PubMed] [Google Scholar]
Associated Data
This section collects any data citations, data availability statements, or supplementary materials included in this article.