Abstract
A multispectral camera is capable of imaging a histologic slide at narrow bandwidths over the range of the visible spectrum. While several uses for multispectral imaging (MSI) have been demonstrated in pathology [1, 2], there is no unified consensus over when and how MSI might benefit automated analysis [3, 4]. In this work, we use a linear-algebra framework to investigate the relationship between the spectral image and its standard-image counterpart. The multispectral “cube” is treated as an extension of a traditional image in a high-dimensional color space. The concept of metamers is introduced and used to derive regions of the visible spectrum where MSI may provide an advantage. Furthermore, histological stains which are amenable to analysis by MSI are reported. We show the Commission internationale de l’éclairage (CIE) 1931 transformation from spectrum to color is non-neighborhood preserving. Empirical results are demonstrated on multispectral images of peripheral blood smears.
Index Terms: multispectral, pathology, metamer, color
1. INTRODUCTION
Pathologists rely on subjective color cues to interpret tissue texture and morphology. Decision support algorithms have initiated a shift from a qualitative to a quantitative paradigm in pathology. The benefits, namely higher accuracy coupled with less variability, make automated analysis an increasingly important tool for the pathologist. Multispectral imaging (MSI) exposes new opportunities within quantitative pathology. The three color channels of a standard image represent a small subspace of the spectral data that gave rise to it [5]. With access to the spectral distribution of each pixel, quantitative algorithms have access to previously-unexplored data.
A number of specific uses for MSI in pathology have been advanced. For example, using spectral unmixing, one can rescue specimens which are over stained, separate stains which co-localize and are difficult to visualize, and separate mixed fluorescent signals [1, 2]. However, there is little a priori evidence that the additional spectral channels provided by MSI will be orthogonal, relevant, or useful to the researcher. In a recent study, Boucheron et al. found minimal (< 1%) performance improvement using multispectral imagery over a standard image for pixel-level nuclear classification of routine H&E images [4]. In a different application, Roula et al. found an improved classification ability using MSI with H&E slides of radical prostatectomies [3]. The lack of clear consensus over the utility of MSI for bright-field imaging prompts a closer look at the underlying principles.
Rather than examining specific pathological applications, which depend on the properties of the biological specimen, stain type, tissue morphology, etc., this paper approaches MSI from its colorimetry fundamentals. By investigating the formation of color from the spectral power distribution, we attempt to narrow the uncertainty of knowing when a spectral image captures information absent from a standard image.
2. COLOR SPACES AND THE MATRIX REPRESENTATION
The absorbance of a histological specimen is defined as the log of the transmitted light intensity over the incident light intensity, a = − log(I/I0). Using the Beer-Lambert law, the absorbance is expressed as the product of the path length, spectral absorption coefficient, and concentration. The optical density of a material is the absorbance per unit length. Crucially, this quantity is independent of the background illumination level.
An RGB image is a multidimensional array of size m × n × 3, while a multispectral image is a matrix with m × n × λ dimensions. The human eye converts between these spaces naturally by means of three wavelength-specific cones. Mathematically, the transformation between a spectrum and the color it represents can be written as an integral over the visible spectrum [5]. If p⃗ contains the color components and X(λ) the continuous spectrum, we have
| (1) |
where κ is a constant and ai are the color matching coefficients corresponding to the color space of interest. In reality, we sample the spectrum at a fixed number of equally-spaced wavelengths. Eqn. 1 then becomes the sum,
| (2) |
In 1931, the Commission internationale de l’éclairage (CIE) established an international standard in which three “tristimulus” values, (X, Y, Z), uniquely define a color [6]. Similar to the well-known RGB system, the XYZ values are obtained in the same manner as Eqn. 1, X = κ ∫λ X (λ)x̄(λ)dλ (with similar eqns. for Y and Z), where x̄, ȳ, z̄ are the color matching coefficients from the CIE 1931 protocol.
We define an intermediate representation of the cube in order to cast Eqn. 2 into conventional linear algebra notation. Let N = m * n be the number of pixels in the image and λ be the number of capture wavelengths. Then X is the λ × N matrix formed by drawing the elements of the cube along the lambda dimension in a column-wise order (i.e. columns of X contain the intensity of each pixel at each spectral value). Using this notation, we write Eqn. 2 as,
| (3) |
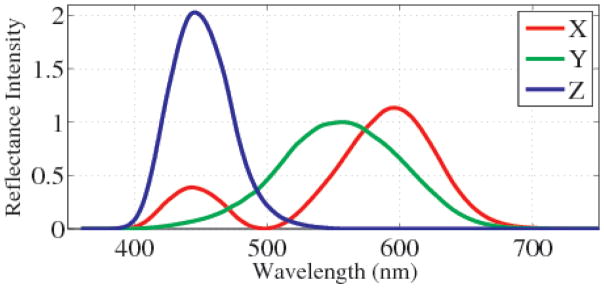
Here A is the scaled matrix of the color matching coefficients, X ∈ ℝλ is the multispectral cube, and I ∈ ℝ3 is the resulting image. Since the dimension of the image is less than the dimension of the cube, it is generally not the case that A is invertible. Such a system has 3 equations for λ unknowns, or (λ − 3) degrees of freedom. To convert from the spectral space to RGB, the cube is first transformed into the CIE XYZ space, then to RGB, ARGB AXY Z X = IRGB, where ACIE and ARGB are color-matching matrices from Λ → XY Z and XY Z → RGB, respectively. In this work, we adopt the conversion matrices established by the CIE 1931 protocol. The coefficients of the transformation are plotted in Fig. 1. For clarity, we abbreviate AXY Z as A for the remainder of the paper.
Fig. 1.
Coefficients of the matrix ACIE, from the CIE 1931 protocol.
3. METAMERISM
Two different spectra which are perceived as the same color are called metamers. Formally, metamers are different spectral power distributions which induce the same CIE XYZ tristimulus value under a given illuminant. There are an infinite number of spectral distributions which give rise to each color [5]. Next, we derive a condition under which this metamerism occurs.
Denote the pixels in the cube by xij and those in the image by plj, two pixels are mapped to the same value when,
| (4) |
It is not necessary for the two pixels in the target image to be strictly equal. We therefore add a slack term. Eqn. 4 then becomes,
| (5) |
Note that εl ∈ ℝ3 and is a function of the color space coordinates. From AX = I, we have for xi1,
For a second pixel, xi2, to meet the conditions in Eqn. 5, the following equalities hold (for each plj),
Subtraction of these equations yields a set of inequalities,
The condition for metamerism is then the following, with one equation for each dimension of I,
| (6) |
For two pixels from the cube to be metamers, the spectrum of each pixel, subtracted in a pairwise fashion and multiplied by the appropriate color-matching coefficient, must fall within a small range around zero.
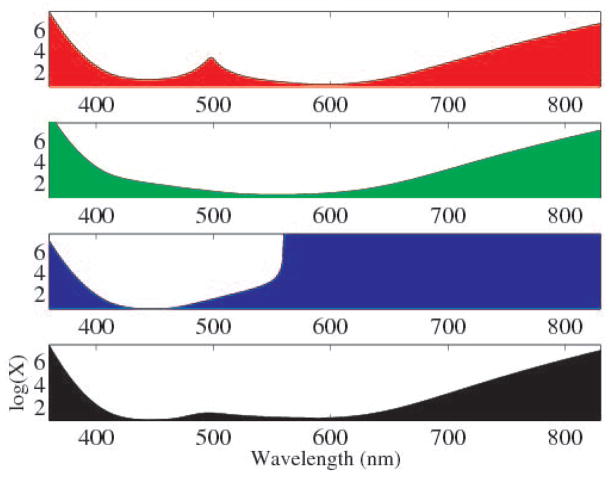
Eqn. 6 illustrates an interesting property of the CIE color matching functions. Wherever a is small, the spectral distribution has freedom to vary. That is, for each channel (X, Y, and Z) there are regions where two spectra can greatly differ, but still produce the same color to the observer. In Fig. 2, we plot the log of the maximum variance at each wavelength, for a color matching tolerance of ε = 5%. To illustrate using the X channel (red), two spectra can have almost any value at 700nm, but must match very closely at 600nm. It is in the variable regions where multispectral imaging has discriminating ability beyond traditional images.
Fig. 2.
Log of the maximum spectral difference between two metamers at each wavelength (assuming the spectra are otherwise equal), for a color matching tolerance of ε = 5%. Red (top), green (2nd), and blue (3rd), represent CIE X, Y and Z, respectively. Black (bottom) shows the maximum difference for the magnitude of all three channels.
The bottom plot (black) of Fig. 2 shows the maximum difference for the vector magnitude of all three channels. As expected, the power distribution has the most freedom outside the human visible spectrum. The most flexibility inside the visible spectrum occurs around 500nm (blue-green) and at the higher wavelengths around 650–700nm (red). It is worth mentioning that this observation agrees with single-channel classification experiments in [4], where classification performance was computed using only one of the spectral bands at a time. Within the visible spectrum, Boucheron et al. found the best performance in the red portion (~ 600 – 650nm).
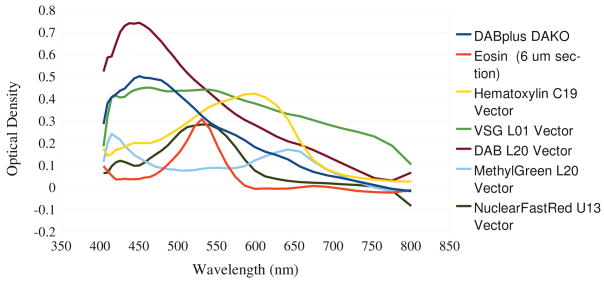
Eqn. 6 also advances a means to determine histological stains which may be amenable to multispectral imaging. Stains have unique spectral absorption profiles, several of which are plotted in Fig. 3 (data courtesy of [2]). Those stains which absorb heavily in regions where the color-matching coefficients are small may see a benefit from MSI. Eosin, for example, has a sharp peak at approximately 525nm, which is a region of high metameric flexibility. On the other hand, DAB peaks at the low end of the spectrum, where there is little flexibility, and would thus be less of a candidate for MSI. Further experiments are necessary to determine if this theoretical premise holds under real biological conditions.
Fig. 3.
Spectra of several histological stains. Data courtesy of the authors of [2].
4. NEIGHBORHOOD PRESERVATION
In Sec. 3, it was shown that certain regions of the spectrum possess flexibility in the absorbance necessary for a given color. This property suggests the CIE transformation is not “neighborhood preserving.” That is, if each pixel is plotted as a point in λ-dimensional space, points which are far apart can be mapped very close in XYZ, or points which are close mapped far. Clustering and classification algorithms rely on these relative data relationships in the form of a distance matrix. If the transformation appreciably changes the distance matrix, it will certainly affect the outcome of the data analysis.
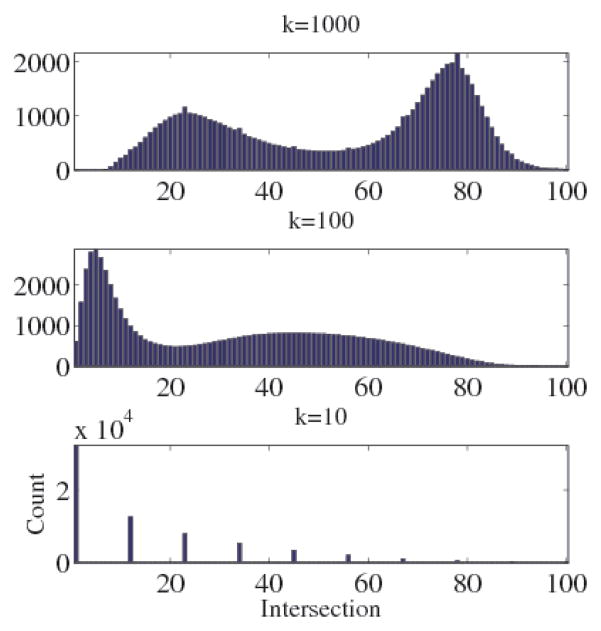
The effect of A on local structure was tested on spectral images. k nearest neighbors were computed in ℝλ for each pixel xij. The transformation was then applied and the neighbors recomputed in ℝ3. The normalized size of the intersection between the neighbor lists, |{xij }X ∩ {xij }I |/k, was computed for several values of k. This procedure was applied to 160 256×256 multispectral images of peripheral blood smears.1 A k-D tree implementation [7] of the nearest neighbor search, with preprocessing time O(kN log(N)) and expected search time log(N), was necessary to handle the data set in reasonable time.
Results (shown in Fig. 4) confirm the CIE transformation is not neighborhood preserving. Even at the neighborhood size k = 1000 (1.5% of the data set), approximately half of the points retain less than 50% of their respective neighbors. On average, 40% of points retain none of their closest 10 neighbors in XYZ space.
Fig. 4.
Histograms of the mean fraction of neighbors retained, after transformation by A, in 160 multispectral blood smear images, N = 65, 536. On average, 40% of points retain none of their closest 10 neighbors when transformed to XYZ space.
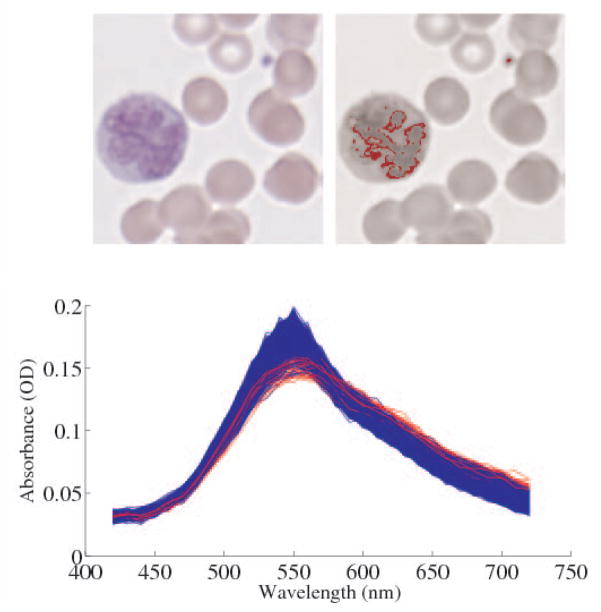
The same effect can be shown at the image level. In Fig. 5, 1000 pixels with RGB values closest to those of the blood platelet (top right) are highlighted. The highlighted pixels include two distinct structures, namely the platelet and the nuclei of the neutrophil (left). These pixels are nearly metameric; without relative image context they are indistinguishable by RGB. A qualitative examination of the spectra, however, indicates separation in spectral space, particularly near the regions of high metameric flexibility. A basic decision-boundary classifier achieved 95% overall accuracy, with a 100% true positive rate, for distinguishing platelet from neutrophil, using the 550nm band alone. This performance could not be reproduced using RGB due to the information loss associated with metamerism.
Fig. 5.
Top left: 60× RGB image of a blood smear showing a neutrophil (large polynuclear cell on left), red cells, and a platelet (small blue dot). Top right: The 1000 closest pixels to the RGB color of the platelet are highlighted in red. Bottom: The spectra of the neutrophil pixels are plotted in blue, while those of the platelet are plotted red.
5. CONCLUSIONS
Whether performed by the eye or a computer, color is formed through a constrained summation across the spectrum. Metamerism is therefore an unavoidable consequence of brightfield imaging. In this work, we used a linear-algebra framework to investigate the relationship between the multispectral image and its color counterpart. The concept of metamers was introduced and used to derive regions of the visible spectrum where MSI may provide an advantage, as well as histological stains which are, theoretically, amenable to analysis by MSI. We empirically showed the CIE 1931 transformation from spectrum to color is non-neighborhood preserving.
For multispectral imaging to move from fringe technology to a mature diagnostic tool, it is helpful to anticipate applications for which it adds value. MSI increases time (in both the acquisition and processing stage) and storage costs. True color slide scans may contain in excess of 109 pixels and occupy upwards of 15 gigabytes of storage space, a figure which grows multiplicatively when spectral imaging is introduced. Increases in computing power and storage will certainly alleviate these practical limitations, but are no substitute for the targeted, judicious application of the technology.
Acknowledgments
This research was funded, in part, by grants from the NIH through contract 5R01EB003587-03 from the National Institute of Biomedical Imaging and Bioengineering and contract 5R01LM009239-02 from the National Library of Medicine. Additional funds were provided by the Department of Defense via grant number W81XWH-06-1-0514.
Footnotes
Specimens were acquired using a Nuance VIS-Flex multispectral camera (Cambridge Research & Instrumentation, Inc) on an Olympus AX70 microscope at 60X. Slides were prepared for each specimen using standard methods of air drying, fixation with methanol, and staining with Wright Giemsa solution. Exposure time and aperture settings were automatically set by the Nuance software. Images were acquired over a wavelength range of 420nm to 720nm with a step size of Δλ = 10nm.
References
- 1.Levenson RM, Hoyt CC. Spectral imaging and microscopy. American Laboratory; 2000. [Google Scholar]
- 2.Macville MV, Van der Laak JA, Speel EJ, Katzir N, Garini Y, Soenksen D, McNamara G, de Wilde PC, Hanselaar AG, Hopman AH, Ried T. Spectral imaging of multi-color chromogenic dyes in pathological specimens. Anal Cell Pathol. 2001;22:133–42. doi: 10.1155/2001/740909. [DOI] [PMC free article] [PubMed] [Google Scholar]
- 3.Roula MA, Bouridane A, Kurugollu F, Amira A. A quadratic classifier based on multispectral texture features for prostate cancer diagnosis. Proc Int Symp Sig Processing. 2003;2:37–40. [Google Scholar]
- 4.Boucheron L, Bi Z, Harvey N, Manjunath BS, Rimm D. Utility of multispectral imaging for nuclear classification of routine clinical histopathology imagery. BMC Cell Biology. 2007;8:S8. doi: 10.1186/1471-2121-8-S1-S8. [DOI] [PMC free article] [PubMed] [Google Scholar]
- 5.Stiles W, Wyszecki GW. Counting metameric object colors. J Opt Soc Am. 1962;52:313–328. doi: 10.1364/josa.58.000032. [DOI] [PubMed] [Google Scholar]
- 6.Smith T, Guild J. The c.i.e. colorimetric standards and their use. Trans Opt Soc. 1931;33:73–134. [Google Scholar]
- 7.Freidman JH, Bentley JL, Finkel RA. An algorithm for finding best matches in logarithmic expected time. ACM Trans Math Softw. 1977;3(3):209–226. [Google Scholar]


