

Summary
How does feature-based attention modulate neural responses? We used adaptation to quantify the effect of feature-based attention on orientation-selective responses in human visual cortex. Observers were adapted to two superimposed oblique gratings while attending to one grating only. We measured the magnitude of attention-induced orientation-selective adaptation both psychophysically, by the behavioral tilt aftereffect, and physiologically, using fMRI response adaptation. We found evidence for orientation-selective attentional modulation of neuronal responses—a lower fMRI response for the attended than the unattended orientation—in multiple visual areas, and a significant correlation between the magnitude of the tilt aftereffect and that of fMRI response adaptation in V1, the earliest site of orientation coding. These results show that feature-based attention can selectively increase the response of neuronal subpopulations that prefer the attended feature, even when the attended and unattended features are coded in the same visual areas and share the same retinotopic location.
Introduction
Visual attention is the mechanism that selects relevant information from a visual scene for prioritized processing. It has been well established that attending to a spatial location can improve psychophysical performance and neural responses (Carrasco, 2006; Reynolds and Chelazzi, 2004). Specifically, single-unit recording studies in monkeys have shown that spatial attention increases the gain of neuronal firing to the same extent for all neurons that respond to stimuli in the attended region, regardless of their stimulus preference (McAdams and Maunsell, 1999; Treue and Martinez Trujillo, 1999).
Attention can also select visual features independent of their spatial locations (Maunsell and Treue, 2006; Yantis, 2000). Early studies showed that attending to different feature dimensions (e.g., motion, color) modulated cortical areas specialized for processing those dimensions (e.g., MT+, V4/V8) (Chawla et al., 1999; Liu et al., 2003; O'Craven et al., 1997). Recent psychophysical studies have demonstrated that attention can select different feature values within a dimension (e.g., different directions of motion; Baldassi and Verghese, 2005; Liu et al., 2007; Saenz et al., 2003). In this paper, we use “feature” to denote different feature values within a dimension (e.g., two different orientation values within the orientation dimension). Single-unit recording work has suggested that such feature-based attention can selectively enhance neural responses of individual neurons that prefer the attended feature (the “feature-similarity gain” model; Treue and Martinez Trujillo, 1999). Results consistent with this model have been obtained in visual area MT in a monkey single-unit (Martinez-Trujillo and Treue, 2004) and a human fMRI (Saenz et al., 2002) study when subjects attended to motion direction. The procedure used in these studies (Martinez-Trujillo and Treue, 2004; Saenz et al., 2002; Treue and Martinez Trujillo, 1999) allows one to demonstrate feature-selective attentional modulation for a specific feature (e.g., upward motion) in the ignored stimulus, i.e., outside and contralateral to the attended location. However, such attentional modulation cannot be assessed for the attended stimulus, i.e., at the location where both the attended and unattended features (e.g., upward and downward motion) are superimposed. Thus, although the feature-similarity gain model asserts that attention can selectively modulate subpopulations of neurons in the same retinotopic region where both the attended and unattended features are processed, from these studies it is not clear whether such selective modulation occurred.
Here we used adaptation to assess the effect of attention to orientations in both imaging and psychophysical experiments. Measurements of adaptation with fMRI allow one to make inferences about neural activity at the subpopulation level beyond the resolution of a single image voxel (Grill-Spector and Malach, 2001; Krekelberg et al., 2006). We used orientation because it is a fundamental feature in visual perception, and because orientation tuning is a common characteristic of visual cortical neurons, especially in the primary visual cortex (V1). Furthermore, orientation-selective adaptation of the fMRI response has been found in early visual cortex (Boynton and Finney, 2003), including V1 (Engel, 2005; Fang et al., 2005; Larsson et al., 2006). If attention to a particular orientation selectively boosts neural responses of neurons preferring that orientation, it should lead to greater adaptation in those neurons compared with neurons preferring other orientations. We also measured the behavioral effect of attention to a particular orientation in a psychophysical experiment. Quantifying the effect of attention with adaptation allowed us to examine the relationship between the behavioral and imaging measures of attentional effect in a model, and to assess the functional significance of attentional modulation in different visual areas.
Results
Observers were adapted to a compound stimulus that consisted of two orientation components (+20° and −20°) and were instructed to attend to one of the orientations only (Figure 1A). In the psychophysical experiment, we measured the perceived vertical orientation after adaptation, as assessed by the tilt aftereffect (TAE), a repulsion effect induced by orientation-selective adaptation (Gibson and Radner, 1937). In the neuroimaging experiment, we measured the fMRI response to a test stimulus in either the attended or the unattended orientation (Figure 2A).
Figure 1. Stimulus Set-Up and the Behavioral Effects of Attention.
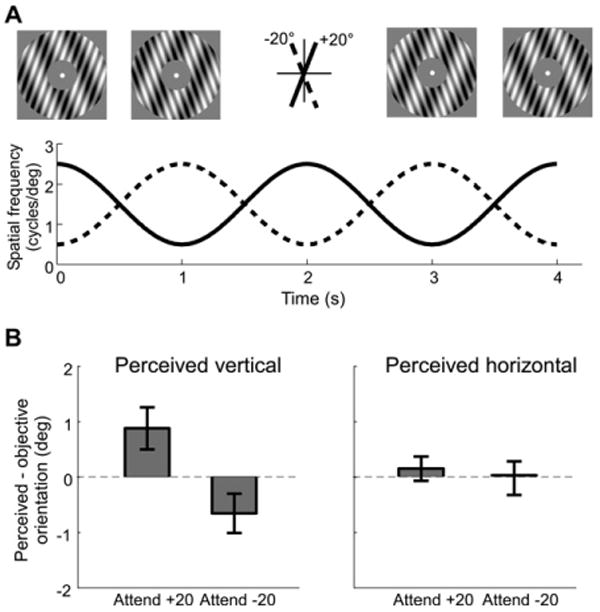
(A) The adapting stimulus. The orientations of the two components are denoted as “+20°” and “−20°,” respectively. The graph shows the modulation of the spatial frequency of the two component gratings (+20°: solid line; −20°: dashed line). The images at the top illustrate the appearance of the stimulus at four different time points: 0, 1, 3, and 4 s. A contrast reversal occurs at 2 s (note that the contrasts of the individual gratings at 0 and 4 s are reversed; the same is true for the gratings at 1 and 3 s).
(B) The effect of attention on the tilt aftereffect (TAE). Left panel shows the difference between the perceived and objective vertical (0°) orientation when attending to one of the component gratings (Attend +20, Attend −20). Right panel shows the difference between the perceived and objective horizontal (90°) orientation. Dashed line indicates no shift in perceived vertical (left) or horizontal (right). Error bars are ±1 SEM across observers.
Figure 2. fMRI Adaptation Protocol and Behavioral Data in the Scanner.
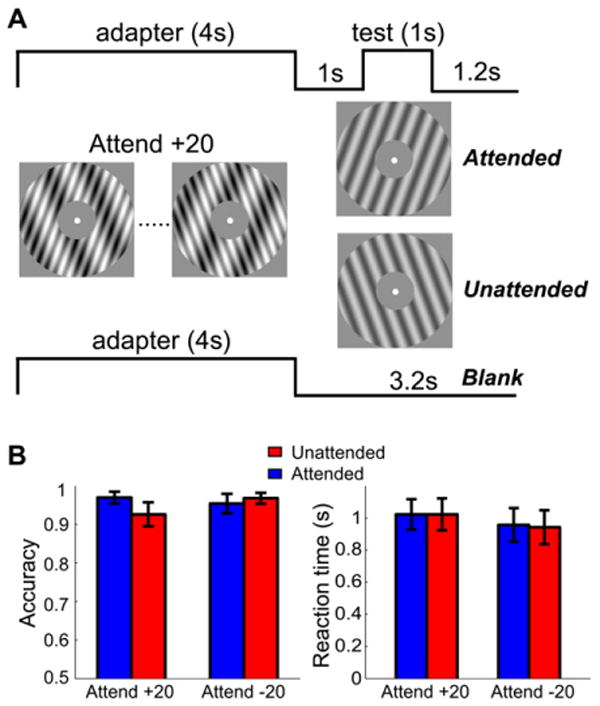
(A) Adaptation protocol in the fMRI experiment. The example here illustrates three trial types (attended, unattended, and blank) for the Attend +20 condition.
(B) Behavioral performance in the scanner in the orientation discrimination task on the test stimulus. Error bars are ±1 SEM across observers.
Behavior: TAE
Attending to one of the orientations in the adapting stimulus affected the perceived vertical (Figure 1B, left panel). When participants attended the +20° orientation, the perceived vertical was shifted toward it, i.e., more than 0° (the objective vertical). Perceived orientation was less than 0° when they attended to the −20° orientation. The perceived vertical was significantly different in the two conditions [paired t test, t(7) = 8.73, p < 0.001]. This pattern of results reflects the repulsion effect induced by orientation-selective adaptation, i.e., TAE (Gibson and Radner, 1937). However, here, consistent with previous findings (Spivey and Spirn, 2000), both adapting orientations were physically present and it was attention that modulated the TAE. To assess the orientation specificity of the effect, we also measured the perceived horizontal orientation in the same experiment. Attention had no effect on the perceived horizontal orientation [Figure 1B, right panel, t(7) = 0.82, p > 0.1]. This is consistent with the observation that indirect TAE (large angular separation between the adaptor and the test stimulus) was much weaker than the direct TAE (small angular separation between the adaptor and the test stimulus; Wenderoth and Johnstone, 1988).
Behavior: Orientation Discrimination during Scanning
Participants reported the orientation of the test stimulus in the scanner (“clockwise” versus “counterclockwise”). One participant's data were excluded due to problems with the response box. Accuracy was near ceiling on this task (Figure 2B). A two-way repeated-measures ANOVA was conducted with session (Attend +20 versus Attend −20) and test orientation (attended versus unattended orientation) as factors. No significant effect was found, either for accuracy or reaction time (all p > 0.1). False alarms (responding on the blank trials when there was no test stimulus) were extremely rare in both the Attend +20 and Attend −20 sessions (<1%).
Imaging: Orientation-Selective fMRI Response Adaptation
Attention modulated orientation-selective fMRI response adaptation in early visual areas. Figure 3 shows the group-averaged fMRI response to the test stimulus in the attended and unattended orientations (collapsed across the Attend +20 and Attend -20 sessions) for all visual areas examined. In every area, the test stimulus in the attended orientation evoked a smaller fMRI response than the test stimulus in the unattended orientation evoked. The peak fMRI responses for the attended and unattended conditions differed significantly in all areas (paired t test, p < 0.01). The attentional effect was present in both the Attend +20 and Attend −20 sessions (see Figure S1 in the Supplemental Data available with this article online). Importantly, the physical stimulus was identical for both attention conditions. Thus, this pattern of results cannot be attributed to differences in the physical stimulus, but must be due to attentional manipulations in the experiment. All participants showed the same pattern of results (see Figure S2 for data from a single observer).
Figure 3. fMRI Data.
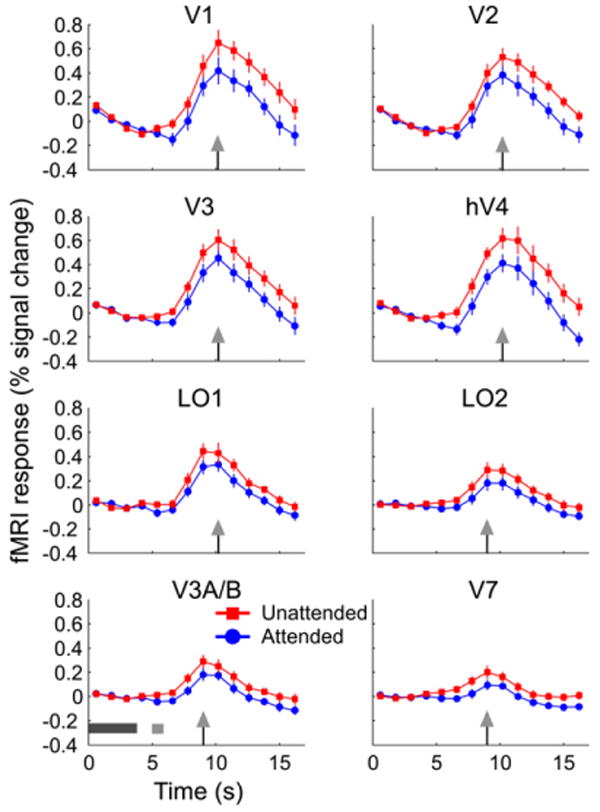
Group-averaged time courses for all visual areas (collapsed across Attend +20 and Attend −20 sessions): fMRI response to the test stimulus in the attended (blue) and unattended (red) conditions is shown. The arrowhead on the horizontal axis indicates the time point at which the response for a particular visual area peaked. The dark and light gray bars in the bottom left panel indicate the onset and duration of the adaptor and the test stimulus, respectively. Error bars are ±1 SEM across observers.
To evaluate the magnitude of the attentional effect, we calculated an attentional modulation index (AMI, see Experimental Procedures) based on the amplitude of peak responses. The AMIs were roughly constant across visual areas (Figure 4), as confirmed by a lack of a significant effect in a one-way repeated-measures ANOVA [F (7,49) = 1.02, p > 0.1].
Figure 4. Attentional Modulation Index for All Visual Areas.
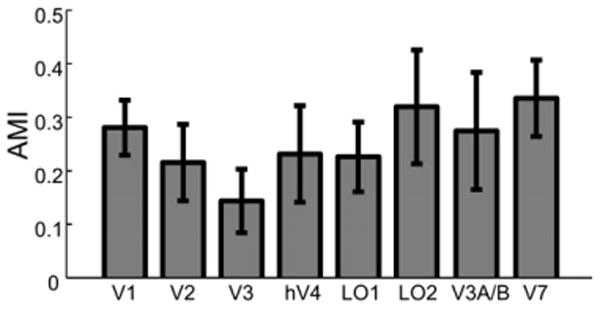
Error bars are ± 1 SEM across observers.
Correlation between Behavioral and Imaging Measures of Attention
We have shown that attention modulated both the TAE and orientation-selective fMRI response adaptation. Although different test stimuli were used for these two measures of attention, given that adapting stimuli were the same and that the same process is likely to underlie the observed attentional effects in both experiments, one might expect that participants who showed a strong attentional effect in one measure would also show a strong attentional effect in the other measure, and vice versa. Consistent with this hypothesis, we found a significant correlation between the behavioral (TAE) and the fMRI (AMI) measures of attentional effect in V1 (r = 0.75, p < 0.03, Figure 5A). This correlation was nonsignificant in V2 (r = 0.36, p > 0.3) and in any other visual area examined: V3, hV4, LO1, LO2, V3A/B, and V7 (all r < 0.3, all p > 0.5, Figure 5B).
Figure 5. Correlation between Attentional Modulation Index and TAE.
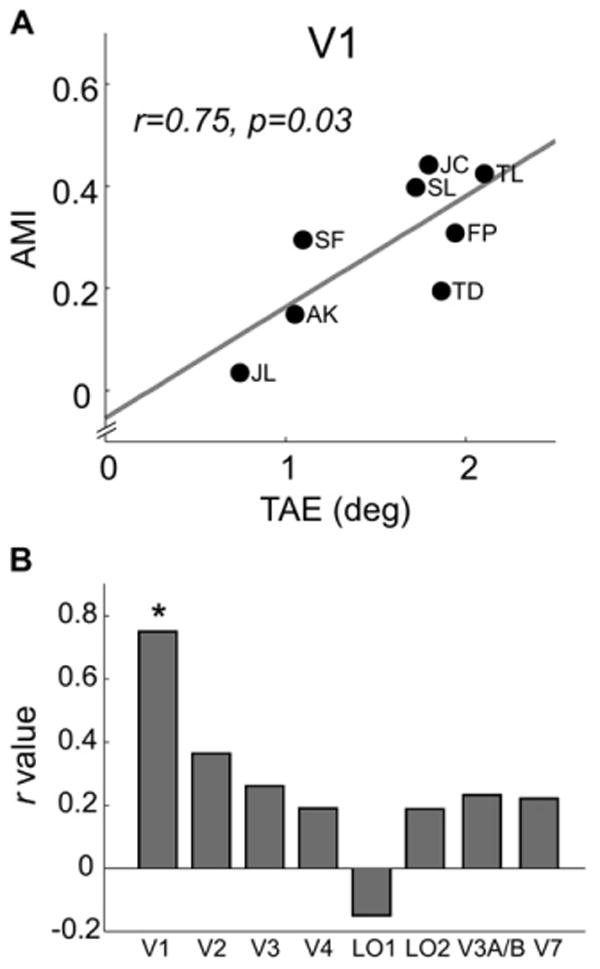
TAE was defined as the difference between the perceived vertical orientations in the Attend +20 and Attend −20 conditions.
(A) Scatter plot of attentional modulation index (AMI) versus TAE for V1. Each symbol represents an observer (with initials affixed); the correlation coefficient and the associated p value are also shown.
(B) Correlation values (r) for all visual areas examined (asterisk indicates significant correlation, p < 0.05).
A Model Relating TAE and fMRI Response Adaptation
We constructed a simple model to make an explicit link between our behavioral and imaging measures of attention. For ease of exposition, we have chosen to model two conditions: attended (one orientation is attended) and neutral (neither orientation is preferentially attended). We did not have a neutral condition in our experiments (participants always attended to one orientation). But given that the effects are symmetric (as our data show), the attentional effect comparing attended to neutral would be half the size as when comparing attending to two orientations. Thus, the expected TAE is about 1° (Figure 1B), and the expected decrease in fMRI response is about 30% (Figure 4, see Equation 4 in Experimental Procedures). We found that with physiologically realistic parameters, our model can account for both the amount of TAE and the fMRI response adaptation (for details and the actual parameters used, see Experimental Procedures).
The model contains a bank of orientation-tuned units (e.g., V1 neurons) whose preferred orientations vary continuously between −90° to 90°. The tuning curves of several such units in the neutral condition are shown in red in Figure 6A (note that although it is likely that some adaptation may have occurred for the two orientations that were physically presented, given that we are modeling a differential effect of the attended and the nonattended conditions on adaptation, for simplicity, we assumed no adaptation in the neutral condition). When the +20° orientation is attended, according to our hypothesis, the units preferring +20° will fire the most and hence will be maximally adapted. Adaptation leads to a decrease in firing rate, and the profile of such decrease as a function of the preferred orientation is depicted by the black dashed line in Figure 6A. In addition to the decrease in firing rate, another consequence of adaptation is a repulsive shift in the preferred orientation for units preferring nearby orientations, which has been observed experimentally (Dragoi et al., 2000, 2001). The profile of such shifts in preferred orientation is shown in Figure 6B (c.f. panel E of the first figure in Dragoi et al., 2000), which can also be seen in Figure 6A, as the tuning curves in the attended condition are both reduced in height and shifted away from the adapting orientation (+20°). Whereas incorporating the shift in tuning is necessary to account for the magnitude of TAE (Jin et al., 2005), this does not affect our main argument that attending to one orientation leads to higher neural responses in the subpopulation of neurons preferring that orientation, resulting in a strengthened orientation-selective adaptation.
Figure 6. Model of How Attention Affects Orientation-Selective Adaptation in both Psychophysical and fMRI Measures.
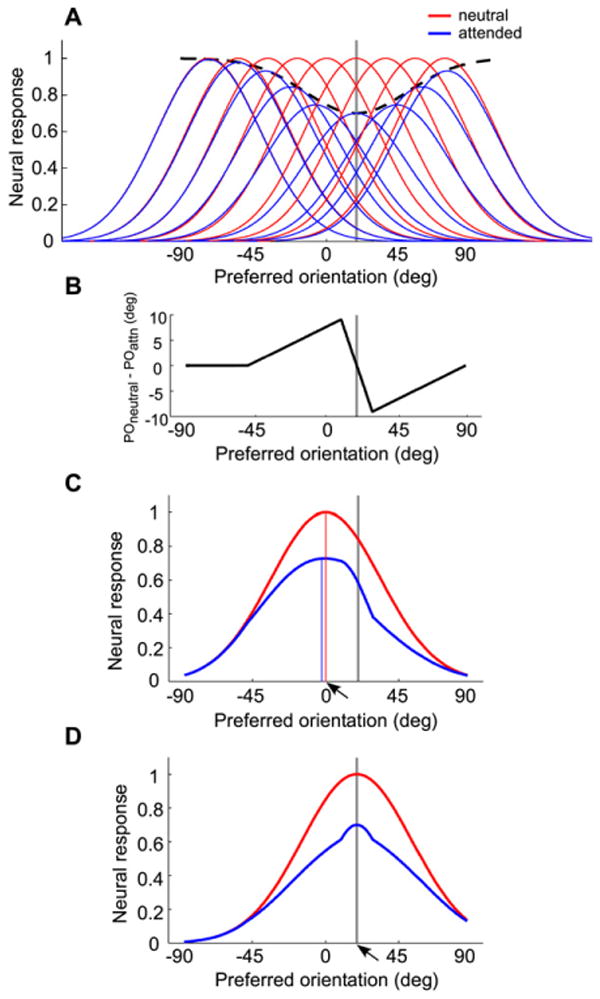
(A) and (B) depict model assumptions; (C) and (D) depict model predictions for psychophysical (C) and fMRI (D) data. In all four panels, the gray vertical line indicates the adapting orientation (+20°). (A) Tuning curves in the neutral (red) and attended (blue) conditions. The black dashed line shows the profile of response reduction due to adaptation. (B) Profile of the shift in preferred orientation due to adaptation to +20°, plotting the amount of shift in orientation preference as a function of a unit's preferred orientation. (C) Population response to the 0° stimulus (indicated by the arrow) in the neutral (red) and attended (blue) conditions. The red and blue vertical lines indicate the units with the maximum response in the neutral and attended conditions, respectively. These are the perceived orientations according to a “winner-take-all” read-out rule (the leftward shift of the blue line is exaggerated to illustrate the small 1° shift). (D) Population response to the +20° stimulus (indicated by the arrow) in the neutral (red) and attended (blue) conditions. The inflection points flanking the peak on the attended (blue) curve are due to the linear approximation of the shift in preferred orientation (B), which contains two singular points at the maximum shift (±10° away from the adapting orientation).
To simulate the measurement of TAE, we calculated the population response (i.e., the response of all units to a single stimulus) to the 0° vertical stimulus (Figure 6C). The perceived orientation of the stimulus is determined from the population response, using a “winner-take-all” rule; i.e., the perceived orientation is the preferred orientation of the unit that has the highest response. To simulate the measurement of fMRI response adaptation, we calculated the population response to the test stimulus at +20° (Figure 6D). The sum of all the units' responses (area under the curve) is the total neural response to the test stimulus. In our simulation, we fixed the width of the tuning and the width of response reduction (the model assumes that the amount of adaptation to a stimulus is proportional to the unadapted response magnitude to that stimulus, so that these widths are numerically the same), as well as the profile of the shift in the preferred orientation (Figure 6B), and varied the amount of response reduction (the height of the black dashed curve in Figure 6A). We were able to fit both the psychophysical TAE and fMRI response adaptation data with a single set of parameters. In Figure 6C, the perceived orientation of the 0° stimulus is −1°, i.e., a repulsion of 1°, and in Figure 6D the relative decrease in total response is 29.8%. Both estimates are comparable to the expected effect size based on our psychophysical and fMRI data.
Discussion
Attentional Modulation of Orientation-Selective Adaptation
Our behavioral results showed that attending to an orientation in a compound stimulus induced a TAE in the same direction as the TAE induced by that orientation alone. It is as if attention selectively enhanced one orientation and diminished the other orientation. These results are consistent with a behavioral TAE study using superimposed gratings of different colors (Spivey and Spirn, 2000).
Our imaging results showed a larger adaptation effect in fMRI response for the attended than the unattended orientation. Previous studies have demonstrated feature selectivity outside the attended location for an ignored stimulus that contained only one feature (Martinez-Trujillo and Treue, 2004; Saenz et al., 2002; Treue and Martinez Trujillo, 1999). Here, by presenting the adaptor and test stimulus at the same location, we show feature selectivity inside the attended location. Because both features occupied the same spatial location during adaptation, such attentional effects cannot be due to spatial attention. The present results lend support to the feature-similarity gain model of attention (Martinez-Trujillo and Treue, 2004; Treue and Martinez Trujillo, 1999). According to this model, attention changes neural response in a multiplicative fashion, and the degree of the modulation depends on the similarity between the attended feature and the neuron's preferred feature. Because fMRI cannot measure neural activity of individual neurons, but only the activity on the population level, we cannot rule out the possibility that feature-based attention sharpened individual neurons' tuning curves. However, given the existing data from single-unit recording, such a possibility is unlikely. Although we can only base our inference on a measure of population neural activity, it can be argued that population response is at least as relevant for behavior as the response of single units (Parker and Newsome, 1998; Pouget et al., 2000; Singer and Gray, 1995).
Given that our behavioral measure, the TAE, is mediated by adaptation of orientation-selective mechanisms (Blakemore et al., 1970; Carpenter and Blakemore, 1973; Gibson and Radner, 1937), it allows us to develop a model that accounts for both the magnitude of the observed TAE and the magnitude of the fMRI response adaptation. The present findings suggest that feature-based attention selectively enhance responses of neuronal subpopulations that prefer a particular orientation. Such enhancements may underlie other psychophysical studies showing an attentional effect on perceived orientation (Montaser-Kouhsari and Rajimehr, 2004; Spivey and Spirn, 2000).
Previous Studies on Attention and Feature Selectivity
It has been reported that spatial attention increases orientation selectivity of fMRI responses in the lateral occipital complex (LOC) (Murray and Wojciulik, 2004). However, the results are open to alternative interpretations since the comparison was between a fully attended and an attention-withdrawn condition, and spatial attention might increase the adaptability of neurons (Boynton, 2004). Indeed, such an effect has been demonstrated psycho-physically (Ling and Carrasco, 2006; Rezec et al., 2004). In contrast, in our experiment, participants always attended to one of the two orientations (feature-based attention), so any general effect of spatial attention on adaptation cannot account for the orientation-selective effects in our data. Furthermore, in the LOC study, no orientation-selective response was found in early visual areas. This is probably due to the specific stimulus adaptation protocol used, in which two brief stimuli were presented in quick succession and an overall response was measured for both the adaptor and test stimulus. This protocol has failed to demonstrate orientation-selective adaptation in V1 (Boynton and Finney, 2003). In contrast, our adaptation protocol–long preadaptation period, and top-up adaptation in every trial–is more similar to those used in psychophysical and electrophysiological studies and has been shown to evoke orientation-selective adaptation in V1 in fMRI studies (Engel, 2005; Fang et al., 2005; Larsson et al., 2006).
Using a display containing intermingled colored dots, a recent study has shown that attending to one color increases the amplitude of steady-state visual evoked potentials (Muller et al., 2006). However, higher spatial resolution is needed to assess attentional effects in specific retinotopic visual areas, which was accomplished by a recent fMRI study using a novel analysis technique, the voxel-based classifier decoding technique. When participants attended to one of two superimposed grid patterns, the classifier based on voxels from V1 to V4 could reliably predict the attended orientation, suggesting that attending to one orientation biased the population activity toward the attended orientation (Kamitani and Tong, 2005). Our results support this interpretation and go beyond the classifier-based analysis in establishing a quantitative link between neural responses (measured by fMRI) and behavior. The classifier technique cannot be used as a quantitative measure of neuronal tuning for the following reasons: (1) the classifier results are expressed in terms of the performance of a binary-decision algorithm; and (2) critically, the classifier technique requires that the distribution of subpopulations of neurons coding for different features (e.g., orientations) be spatially nonuniform within each cortical area (e.g., orientation columns in area V1). If neurons tuned for different features were uniformly distributed within an area, a classifier analysis would reveal no tuning for that feature dimension in that area, even if the individual neurons were sharply tuned for the feature in question. Hence, the performance of the classifier depends on both the (unknown) spatial distribution of neurons coding for a particular feature and the selectivity of those neurons for that feature.
Comparing Attentional Modulation across Visual Areas
It is important to quantify the size of the attentional effect, since this allows one to compare the magnitude of attentional effects across visual areas and experimental conditions. Admittedly, such interpretations rely on the relation between the change in fMRI adaptation and the change in neuronal firing rate. However, given the monotonic relation between neuronal firing rate and adaptation (Gardner et al., 2005; Sclar et al., 1989), as well as that between the neural activity and fMRI response (Heeger and Ress, 2002), it is likely that fMRI adaptation and neuronal firing rate covary in a monotonic fashion. Such a connection could in principle enable an estimate of the magnitude of the attentional effect using fMRI response adaptation.
Indeed, a notable aspect of our results is that the magnitude of attention-induced adaptation was similar across visual areas (Figure 4). Assuming that the relation between changes in adaptation level and changes in neural response is comparable across different visual areas, this finding suggests a constant level of attentional modulation across visual areas, whereas a common finding in studies of spatial attention has been a gradient of increasing attentional modulation from V1 to extrastriate areas (e.g., Cook and Maunsell, 2002; Kastner et al., 1999). Such a gradient is generally believed to be the result of a diminishing top-down modulation from parietal and frontal areas to early sensory areas; it first hits extrastriate areas and then “trickles down” to V1 (Hopf et al., 2005; Schroeder et al., 2001). Note that a feedforward mechanism might underlie the effect of stimulus-driven, exogenous attention (Liu et al., 2005). Our results suggest that such a mechanism is not the only means by which attention modulates sensory processing. We propose that when attention is directed to a feature, it can specifically modulate the neurons that code the relevant feature information, regardless of the level of its representation in the cortical hierarchy. In our experiment, the relevant feature is orientation, which is strongly encoded by neurons in V1. Thus, it seems reasonable for attention to directly modulate V1 neurons with specific orientation preferences. The observed attentional modulation in extrastriate areas might simply reflect a passive feedforward relay of attentional effects in V1. This scenario is also consistent with findings of orientation-selective adaptation effects in visual cortex. A constant level of adaptation across visual areas has been interpreted as an adaptation effect in V1 propagating across extrastriate areas without additional adaptation occurring in those areas (Larsson et al., 2006).
A constant magnitude of attentional modulation across visual areas is probably not universal to all types of feature-based attention. When measuring the fMRI response to a single stimulus outside the focus of spatial attention (either with the attended or unattended feature), there was a smaller effect of feature-based attention in V1 than in MT+ and V4, for motion and color, respectively (Saenz et al., 2002). There are at least three explanations for this discrepancy regarding the magnitude of attentional modulation across visual areas. First, there might be differences in the way attentional effects are propagated across visual areas when spatial attention is directed toward (present study) or away from (Saenz et al., 2002) the stimulus. Second, adaptation effects at the focus of spatial attention (present study) and feature-based effects outside the focus of spatial attention (Saenz et al., 2002) might measure different aspects of feature-based attention. The third, and we believe most likely, reason, concerns the specific features used in the two studies. If, as argued above, attention can selectively modulate the response of neurons coding specific relevant features, then the most efficient modulation would occur on the level in which neurons show the highest functional specialization for the relevant feature. With regard to the time course of feature-based selection, it has been shown that it is faster to select features within a dimension than between dimensions (Schoenfeld et al., 2007). In this framework, it is natural that attention to motion, color, and orientation would produce the most prominent modulation in MT+, V4, and V1, respectively, because each of these areas contains a high proportion of neurons specifically tuned to the corresponding features. The attentional effect in the downstream areas could be simply due to passive propagation of attentional modulation in the earlier areas.
Linking Behavioral and Imaging Measures of Attention
Quantitative measures of attentional effects also allow one to relate the psychophysical and imaging results more directly. We constructed a simple model that incorporated two known effects of adaptation: response reduction and a shift in tuning (Dragoi et al., 2000, 2001). The model provided a good fit for the observed TAE and fMRI response adaptation with a single set of parameters, suggesting that the two types of attentional effects arise from the same underlying neural mechanism. Importantly, the model used a small number of fixed parameters taken from published neurophysiological measurements (Dragoi et al., 2000, 2001; McAdams and Maunsell, 1999) and only one free parameter–the amount of adaptation in the neural response (the height of the black dashed curve in Figure 6A).
One advantage of our study over previous studies that did not measure the behavioral effects of attention (Kamitani and Tong, 2005; Muller et al., 2006) is that behavioral data help constrain the interpretation of imaging results. For example, the functional relevance of attentional modulation in different visual areas can also be assessed by examining the relationship between behavioral effects and neural modulation. The finding that a correlation was observed between TAE and AMI only in V1 and in no other visual areas suggests that V1 is the primary site of attentional modulation, consistent with our conjecture above. Note that this does not necessarily contradict the view that attentional effects propagate from V1 to extrastriate areas, as neural noise at successive stages of processing could corrupt the correlation present at the source. The latter conjecture is supported by the diminishing correlation between TAE and AMI in higher visual areas (Figure 5B). Our results implicate a functional role of V1 in the attentional modulation of adaptation in the current experiment. Thus, even though all visual areas showed a similar attentional effect (Figure 4), they probably did not play an equal role in determining behavior.
Feature-Based versus Object-Based Attention
Although we have interpreted our results as a consequence of feature-based attention, an alternative interpretation is that we have manipulated object-based attention. We cannot rule out the possibility that participants were attentively tracking the grating as an object, since it was expanding and contracting continuously (see Experimental Procedures). However, the boundary between feature-based and object-based attention is quite fuzzy, especially so for simple stimuli with a limited set of features, since objects are always defined by a collection of features. Object-based attentional modulation has been shown in high-order ventral visual areas with superimposed face and house images (O'Craven et al., 1997; Serences et al., 2004). Should the effect reported here be interpreted to reflect object-based attention, it would be a first demonstration that object-based attention can also modulate neural processing in human early visual cortex.
Conclusion
The present results show that feature-based attention can selectively enhance the activity of subpopulations of neurons preferring a particular feature, even though these neurons are located in the same retinotopic region as those that prefer the unattended feature. Such enhancement leads to neural adaptation and produces perceptual consequences that can be linked to each other in a model with physiologically realistic parameters. Although how top-down control signals from the parietal and frontal areas achieve such specificity remains an open question, the present study shows that the attentional system is flexible enough to target very specific groups of neurons.
Experimental Procedures
Participants
Eight students and postdoctoral fellows at New York University participated in the experiment (one woman, seven men), all with normal or corrected-to-normal vision. Except for two authors (J.L. and T.L.), all participants were naive as to the purpose of the experiment. The experiments were performed following the safety guidelines for MRI research; informed consent was obtained, and the experimental protocol was approved by the Institutional Review Board at New York University. Each observer participated in four MRI scanning sessions on different days: one to obtain high-resolution anatomical images, another to measure retinotopic maps in visual cortex, and two sessions for the main experiment.
Visual Stimuli
Stimuli were sinusoidal gratings with blurred edges that appeared in an annulus centered at fixation (1°–4°). The adapting stimulus (adaptor) was composed of two full-contrast gratings, tilted 20° clockwise or counterclockwise off the vertical orientation (0°), labeled +20° and −20°, respectively (Figure 1A). The gratings were superimposed such that the luminance of each pixel in the compound stimulus was equally weighted by the corresponding luminance of its two components. This gave rise to the perception of surface transparency, with the effective contrast of each component at 50%. The spatial frequency of each component grating of the adaptor was modulated continuously over time sinusoidally, but in opposite phases (Figure 1A). The duration of each cycle was 2 s, during which the spatial frequency of both gratings spanned values from 0.5 to 2.5 cycles/degree. The contrast of both component gratings was also reversed every 2 s, to ensure no net luminance (retinal) adaptation. In the example shown in Figure 1A, the +20° grating started and ended at high spatial frequency (2.5 cycles/degree), and the −20° grating started and ended at low spatial frequency (0.5 cycles/degree). The pattern of spatial frequency modulation was fixed for a participant but was switched across participants (i.e., solid and dashed lines in the graph were switched). There were four participants in each subgroup; because the results did not differ between groups, the data were pooled across the two subgroups. The test stimulus was a single grating at 20% contrast and 1.5 cycles/degree. Participants were instructed to fixate on a central fixation point (0.2°) presented throughout the experiment.
For behavioral sessions, stimuli were presented on a 19″ CRT monitor (SONY E400) in the psychophysics lab. Background luminance was set at 60 cd/m2 and participants viewed the screen at a distance of 57 cm. Head position was constrained with a chin-and-head rest.
For fMRI sessions, stimuli were presented on a 21″ flat-panel display (NEC, MultiSync LCD 2110) housed in a Faraday box with an electrically conductive glass front, positioned at the rear of the scanner bore. Participants viewed the display through an angled mirror attached to the head-coil (viewing distance: 150 cm), and a custom-fitted bite bar was used to stabilize the head. Background luminance was set to 62 cd/m2.
Behavior: Measuring the TAE
The behavioral sessions served two purposes: to train participants on the attention task and to obtain an independent measure of the behavioral effect of feature-based attention.
Each run started with a 40 s preadaptation period, during which the adaptor was shown continuously and participants were told to attend to one of the component gratings. After brief training, all participants reported an ability to attentively track one of the component gratings, which perceptually appeared to be in a constant cycle of expansion and contraction. Indeed, we chose to modulate the spatial frequency in a continuous fashion to facilitate attentive tracking. In pilot studies, we had found that a static stimulus was perceptually bi-stable and often led to spontaneous reversals, whereas it was easy to attentively track a dynamic stimulus, consistent with a previous study (Blaser et al., 2000).
After the preadaptation period, two interleaved staircases (24 trials each) were run, during which participants set their subjective vertical and subjective horizontal orientations, respectively. Each trial started with the presentation of the adaptor for 4 s (top-up), followed by a 1 s fixation, after which a test stimulus appeared for 0.5 s. Participants were told to attend to the same component grating as in the preadaptation during the top-up, and report whether the test stimulus appeared clockwise or counterclockwise, with respect to their subjective vertical or horizontal, by pressing one of two keys on a keyboard. The two staircases were easily distinguishable because the starting values for the vertical and horizontal staircases were exactly vertical (0°) and horizontal (90°), respectively. The values of the test orientation were controlled via a 1-up 1-down staircase procedure (Levitt, 1971).
The average of the last four points of a staircase was used as the estimate of subjective vertical or horizontal. The attended orientation was kept constant throughout a run but was counterbalanced across runs, i.e., Attend +20 or Attend −20 conditions. Participants completed 10–12 runs on separate days (five to six threshold estimates for each attended orientation).
In pilot studies we had included a task during preadaptation and top-up in which orientations of both component gratings underwent small changes and participants had to report the orientation changes of the attended grating. Although this task could provide an on-line measure of attentional allocation, it made attentive tracking more difficult for some participants and interfered with the orientation judgment task on the test stimulus. Hence, we dropped the task during preadaptation and top-up. The observed attentional modulation of both the behavioral TAE and fMRI adaptation indicated that observers followed the instructions to selectively attend to one of the orientations.
Magnetic Resonance Imaging Protocol
Magnetic resonance imaging was performed on a 3T Siemens Allegra head-only scanner (Erlangen, Germany) equipped with a volume transmit head-coil and a four-channel, phase-array, surface receive-coil (NM-011 transmit head-coil and NMSC-021 receive-coil, NOVA Medical, Wakefield, MA). High-resolution anatomical images were acquired for each observer using a T1-weighted MP-RAGE sequence (FOV = 256 × 256 mm, 176 sagittal slices, 1 mm isotropic voxels). Functional images were acquired using a T2*-weighted echoplanar imaging sequence (TR = 1.2 s, TE = 30 ms, flip angle = 75°, matrix size = 64 × 64, in-plane resolution = 3 × 3 mm, slice thickness = 3 mm, no gap). Twenty-two slices covering the occipital lobe and approximately perpendicular to the calcarine sulcus were acquired every 1.2 s. Images were reconstructed off-line from the raw k-space data using custom C and Matlab code (L. Fleysher et al., 2005, Proc. Intl. Soc. Magn. Reson., abstract). In each scanning session we also acquired a T1-weighted anatomical image that had the same slice prescription as the functional scans, but with twice the in-plane resolution (1.5 × 1.5 × 3 mm). This image was used to align the functional volumes and the high-resolution anatomical image used to extract cortical surfaces.
Retinotopic Mapping and Cortical Localizer
Early visual cortical areas were identified separately for each observer, based on retinotopic mapping and following well-established procedures (DeYoe et al., 1996; Engel et al., 1997; Sereno et al., 1995). For each participant, we obtained retinotopic maps in separate scanning sessions, during which both the polar angle and radial components were measured repeatedly in multiple scans (for detailed methods, see Larsson and Heeger, 2006). Borders between visual cortical areas were identified as phase reversals in a map of the polar angle representation of the visual field. Phase maps were visualized on computationally flattened representations of the occipital cortex generated from the high-resolution anatomical image using the Surf-Relax software (Larsson, 2001). Ten visual areas were defined for each hemisphere: V1, V2d, V2v, V3d, V3v, V3A/B, hV4, V7, LO1, LO2 (Larsson and Heeger, 2006). We did not observe a consistent boundary between V3A and V3B; hence, we have defined a visual area that contained both and labeled it V3A/B.
In each scanning session, we also ran “localizer” scans to independently define cortical regions responding to the stimuli. In the localizer scan, the same adapting stimulus as in the main experiment (two overlapping moving gratings) was shown for 9.6 s, alternating with a fixation period of the same duration. Each localizer scan consisted of nine on-off cycles (172.8 s duration). Observers were instructed to passively view the display while maintaining fixation. Two repetitions of the localizer scan were run in each scanning session.
fMRI Adaptation Protocol
We measured fMRI adaptation effects in the main experiment using an event-related design based on psychophysical and electrophysiological adaptation protocols (Larsson et al., 2006). To avoid potential long-lasting adaptation effects of the neural response, the two attended orientations were tested in separate scanning sessions. Each participant completed two scanning sessions for the main experiment on separate days, with one session for Attend +20 and one for Attend −20. The order of these two sessions was counterbalanced across participants.
Each scanning session consisted of four scans of the fMRI adaptation protocol. Before each scan, participants viewed the compound adaptor for 40 s while attending to one particular orientation (preadaptation). The scan started immediately after the preadaptation period. During the scan, each trial started with a 4 s adaptor (top-up), followed by 1 s fixation, which was followed by the presentation of a test stimulus for 1 s (Figure 2A). After a 1.2 s intertrial interval, the next trial started (7.2 s duration per trial). The test stimulus was a 20% contrast, 1.5 cycles/degree grating with an orientation of either +20° or −20°. The test stimulus was contrast reversed once (0.5 s after its onset) to avoid any retinal adaptation. In addition, blank trials were also included in which only the top-up was presented, followed by 3.2 s fixation. Thus, there were three trial types: attended, unattended, and blank. For each scan, 14 trials of each type were presented in a pseudorandom order in which trials preceding and following any trial were equally likely to be one of the three trial types. The 42 trials in each scan were followed by a 12 s fixation period at the end, making the total duration of each scan 314.4 s (262 measurements).
Participants were instructed to attend to one of the component gratings whenever they saw the adaptor on the screen (preadaptation and top-up), and to report the orientation of the test stimulus upon its presentation by pressing one of two keys on an MR-compatible response box. We modulated the adaptor spatial frequency to facilitate attentional tracking (see above), and to make the adaptor and the test stimulus very distinct (dynamic versus static). Had the test stimulus been identical to the attended component grating, participants might have been less attentive when seeing a test stimulus in the attended orientation.
fMRI Data Analysis
Functional images were first motion-corrected within and between scans using MCFLIRT (Jenkinson et al., 2002). The fMRI time series in each voxel was normalized to percent signal change by first subtracting and then dividing the mean signal to compensate for the variation in image intensity. The data were then de-trended with a high-pass filter (three cycles per scan) to remove low-frequency drift and noise.
We analyzed data from the localizer scan with a Fourier-based method (for detailed descriptions, see Backus et al., 2001; Huk and Heeger, 2002). Briefly, for each voxel, we computed the correlation (coherence) between the best-fitting sinusoid at the stimulus alternation frequency and the measured time series. This analysis also yielded a response phase and amplitude, which allowed us to distinguish stimulus-related significant increases from significant decreases in fMRI response. Voxels that showed positive correlation with the stimulus alternation with a coherence >0.2 were identified (using different coherence thresholds did not change the results in any significant way). These voxels corresponded to the cortical representation of the stimulus annulus. They were further divided into the ten visual areas defined by retinotopic mapping, each constituting a region of interest (ROI) for the main experiment.
For the main experiment, the fMRI time series of all voxels in an ROI were first extracted and averaged to derive a mean time course for each ROI. Event-related averages were then performed for each of the three trial types (attended, unattended, and blank) by averaging 14 time points (16.8 s) starting with the trial onset. The average response to the adaptor stimulus alone, i.e., the event-related averages of the blank trials, was subtracted from the averages of the attended and unattended trials to isolate the response to the test stimulus. The resulting time series were adjusted to a zero baseline by subtracting the mean of the first four time points (before the onset of the test stimulus). The time course from corresponding ROIs from the left and right hemispheres were averaged, as well as those from the dorsal and ventral portions of V2 and V3.
The peak fMRI response was used as a measure of the response amplitude. The peak time point was determined for each visual area based on the grand mean time course across participants and conditions (Figure 3). Peak times were either the eighth or ninth time point after trial onset (9.6–10.8 s after trial onset, or 4.6–5.8 s after test onset). An AMI was computed based on the response amplitudes (R) to the tests of attended and unattended orientations, defined as:
| (1) |
where Runattn and Rattn were the response amplitudes of the unattended and attended conditions, respectively.
Eye Movement Monitoring
Although all participants were trained psychophysical observers and could maintain proper fixation, we nevertheless monitored the participants' eye movement during scans. We used an eye tracking system (Model 504 LRO, Applied Science Laboratories) to obtain a video of the right eye. The eye video and a real-time video of the stimulus presentation were fed into a computer that recorded both video signals onto the hard disk using Diginet software (Kodicom, Seoul, South Korea). Inspection of these videos for maintenance of proper fixation revealed that all participants were able to maintain stable fixation throughout all the scans.
In the psychophysical experiments measuring TAE, we also monitored participants' eye movement in selected runs using an infrared video camera system (ISCAN, Burlington, MA). Videos of the right eye were recorded and viewed later to confirm the stability of fixation; all participants were able to maintain fixation throughout the runs.
Modeling the Psychophysical and fMRI Measures of Attention
We constructed a simple model to illustrate how the behavioral TAE and fMRI response adaptation can arise from the same underlying mechanisms. We modeled two conditions: attending to the +20° orientation (attended) versus attending to neither orientation (neutral, see Results). Under the assumption of a symmetric effect, the expected effect size in the model should be half of what we observed experimentally. Hence, the expected TAE is about 1° (i.e., half of the difference between Attend +20° and Attend −20°, see Figure 1B), whereas the expected relative reduction in fMRI response is numerically the same as the AMI (Figure 4). To appreciate the latter, consider the numerator in Equation 1. If we assume a symmetric effect, then
| (2) |
Now consider the denominator in Equation 1. Again, if one assumes symmetric effect, then
| (3) |
Substituting Equations 2 and 3 in Equation 1, one gets:
| (4) |
Thus, given that the AMI is around 0.3 (Figure 4), we expect a relative reduction of 30% in the fMRI response in the model.
Having established the expected effect size, we now describe the model and its parameters. The model consisted of a bank of orientation-tuned units with their preferred orientations ranging from −90° to 90° (red curves in Figure 6A). Each unit had a Gaussian tuning profile, with a standard deviation (SD) of 35°, corresponding to the tuning width of V1 neurons reported by McAdams and Maunsell (1999). Attending to the +20° orientation in the adapting stimulus increases the firing rate of neurons tuned to this orientation, leading to an orientation-selective reduction in neural response to the subsequently presented test stimulus, which represents the suppressive effects of adaptation on neuronal gain. The profile of this reduction was modeled as an inverted Gaussian centered on the adapting orientation, as depicted by the black dashed line in Figure 6A (SD of 35°). This is equivalent to assuming that adaptation is proportional to the magnitude of the unadapted response, a reasonable assumption given our current understanding of adaptation (Carandini and Ferster, 1997; Gardner et al., 2005; Sclar et al., 1989).
The other consequence of adaptation was a repulsive shift of the preferred orientation for units close to the adapting orientation, as has been demonstrated experimentally (Dragoi et al., 2000, 2001) and has been shown to be necessary to quantitatively account for the TAE (Jin et al., 2005). The profile of such a shift in the preferred orientation is shown in Figure 6B, with the maximal shift occurring for units with peak orientation sensitivities ±10° away from the adapting orientation (i.e., units preferring +10° and +30°), the maximal magnitude of such shift at 9°, and no such shift at orientations 70° away from the adapting orientation (i.e., units preferring +90° and −50°). This profile is an approximation of the data obtained in neurophysiological experiments (c.f. panel E in the first figure in Dragoi et al., 2000).
In the psychophysical experiment, we measured the perceived shift of the objective vertical, which is equivalent to presenting a 0° stimulus to the model and obtaining the perceived orientation of the model. Thus, we calculated the population response to the 0° stimulus (i.e., the response of all units to the 0° stimulus) with and without attention (Figure 6C). Note that our psychophysical experiment used a nulling procedure, corresponding to computing the test orientation that would be perceived as vertical. We have implemented both methods and found them to give essentially the same results. For simplicity, here we present the results of the first method to illustrate the shift. We used a simple winner-take-all rule to read out the population response; that is, the perceived orientation is the preferred orientation of the unit that has the highest response. Other read-out methods, such as population-vector averaging and maximum-likelihood estimation, give similar qualitative results for such models (Jin et al., 2005).
In the fMRI experiment, we measured the fMRI response to a test stimulus in either the attended or unattended orientation, which is equivalent to presenting the +20° stimulus to the model and obtaining the model's overall response. Thus, we calculated the population response to the +20° stimulus and compared the area under the curves of the population responses for the attended and neutral conditions. We further assume that fMRI response is linearly related to the underlying neural response.
With all the aforementioned parameters fixed (i.e., tuning width, the width of the adaptation profile, and the profile of shift in the preferred orientation), we varied a single parameter–the maximum decrease in response in the attended condition (i.e., the amount of depression in the black dashed curve in Figure 6A)–to simultaneously fit the magnitude of the TAE and fMRI response adaptation. We found that with a maximum decrease of 30% neural activity, the perceived vertical shifted 1° away from the adapting orientation (Figure 6C) and the amount of fMRI response decreased by 29.8% (Figure 6D).
Supplementary Material
The Supplemental Data for this article can be found online at http://www.neuron.org/cgi/content/full/55/2/313/DC1/.
Acknowledgments
This work is supported by an NIH grant (EY016200-01A2) to M.C. and a grant from the Seaver Foundation to New York University. We thank D. Heeger, M. Landy, and members of the Carrasco lab for helpful discussions and comments.
References
- Backus BT, Fleet DJ, Parker AJ, Heeger DJ. Human cortical activity correlates with stereoscopic depth perception. J Neurophysiol. 2001;86:2054–2068. doi: 10.1152/jn.2001.86.4.2054. [DOI] [PubMed] [Google Scholar]
- Baldassi S, Verghese P. Attention to locations and features: different top-down modulation of detector weights. J Vis. 2005;5:556–570. doi: 10.1167/5.6.7. [DOI] [PubMed] [Google Scholar]
- Blakemore C, Carpenter RH, Georgeson MA. Lateral inhibition between orientation detectors in the human visual system. Nature. 1970;228:37–39. doi: 10.1038/228037a0. [DOI] [PubMed] [Google Scholar]
- Blaser E, Pylyshyn ZW, Holcombe AO. Tracking an object through feature space. Nature. 2000;408:196–199. doi: 10.1038/35041567. [DOI] [PubMed] [Google Scholar]
- Boynton GM. Adaptation and attentional selection. Nat Neurosci. 2004;7:8–10. doi: 10.1038/nn0104-8. [DOI] [PubMed] [Google Scholar]
- Boynton GM, Finney EM. Orientation-specific adaptation in human visual cortex. J Neurosci. 2003;23:8781–8787. doi: 10.1523/JNEUROSCI.23-25-08781.2003. [DOI] [PMC free article] [PubMed] [Google Scholar]
- Carandini M, Ferster D. A tonic hyperpolarization underlying contrast adaptation in cat visual cortex. Science. 1997;276:949–952. doi: 10.1126/science.276.5314.949. [DOI] [PubMed] [Google Scholar]
- Carpenter RH, Blakemore C. Interactions between orientations in human vision. Exp Brain Res. 1973;18:287–303. doi: 10.1007/BF00234599. [DOI] [PubMed] [Google Scholar]
- Carrasco M. Covert attention increases contrast sensitivity: Psychophysical, neurophysiological, and neuroimaging studies. In: Martinez-Conde S, Macknik SL, Martinez LM, Alonso JM, Tse PU, editors. Visual Perception. Amsterdam: Elsevier; 2006. pp. 33–70. [DOI] [PubMed] [Google Scholar]
- Chawla D, Rees G, Friston KJ. The physiological basis of attentional modulation in extrastriate visual areas. Nat Neurosci. 1999;2:671–676. doi: 10.1038/10230. [DOI] [PubMed] [Google Scholar]
- Cook EP, Maunsell JH. Attentional modulation of behavioral performance and neuronal responses in middle temporal and ventral intraparietal areas of macaque monkey. J Neurosci. 2002;22:1994–2004. doi: 10.1523/JNEUROSCI.22-05-01994.2002. [DOI] [PMC free article] [PubMed] [Google Scholar]
- DeYoe EA, Carman GJ, Bandettini P, Glickman S, Wieser J, Cox R, Miller D, Neitz J. Mapping striate and extrastriate visual areas in human cerebral cortex. Proc Natl Acad Sci USA. 1996;93:2382–2386. doi: 10.1073/pnas.93.6.2382. [DOI] [PMC free article] [PubMed] [Google Scholar]
- Dragoi V, Sharma J, Sur M. Adaptation-induced plasticity of orientation tuning in adult visual cortex. Neuron. 2000;28:287–298. doi: 10.1016/s0896-6273(00)00103-3. [DOI] [PubMed] [Google Scholar]
- Dragoi V, Rivadulla C, Sur M. Foci of orientation plasticity in visual cortex. Nature. 2001;411:80–86. doi: 10.1038/35075070. [DOI] [PubMed] [Google Scholar]
- Engel SA. Adaptation of oriented and unoriented color-selective neurons in human visual areas. Neuron. 2005;45:613–623. doi: 10.1016/j.neuron.2005.01.014. [DOI] [PubMed] [Google Scholar]
- Engel SA, Glover GH, Wandell BA. Retinotopic organization in human visual cortex and the spatial precision of functional MRI. Cereb Cortex. 1997;7:181–192. doi: 10.1093/cercor/7.2.181. [DOI] [PubMed] [Google Scholar]
- Fang F, Murray SO, Kersten D, He S. Orientation-tuned FMRI adaptation in human visual cortex. J Neurophysiol. 2005;94:4188–4195. doi: 10.1152/jn.00378.2005. [DOI] [PubMed] [Google Scholar]
- Gardner JL, Sun P, Waggoner RA, Ueno K, Tanaka K, Cheng K. Contrast adaptation and representation in human early visual cortex. Neuron. 2005;47:607–620. doi: 10.1016/j.neuron.2005.07.016. [DOI] [PMC free article] [PubMed] [Google Scholar]
- Gibson JJ, Radner M. Adaptation, aftereffect and contrast in the perception of tilted lines. J Exp Psychol. 1937;20:453–467. [Google Scholar]
- Grill-Spector K, Malach R. fMR-adaptation: a tool for studying the functional properties of human cortical neurons. Acta Psychol (Amst) 2001;107:293–321. doi: 10.1016/s0001-6918(01)00019-1. [DOI] [PubMed] [Google Scholar]
- Heeger DJ, Ress D. What does fMRI tell us about neuronal activity? Nat Rev Neurosci. 2002;3:142–151. doi: 10.1038/nrn730. [DOI] [PubMed] [Google Scholar]
- Hopf JM, Schoenfeld MA, Heinze HJ. The temporal flexibility of attentional selection in the visual cortex. Curr Opin Neurobiol. 2005;15:183–187. doi: 10.1016/j.conb.2005.03.008. [DOI] [PubMed] [Google Scholar]
- Huk AC, Heeger DJ. Pattern-motion responses in human visual cortex. Nat Neurosci. 2002;5:72–75. doi: 10.1038/nn774. [DOI] [PubMed] [Google Scholar]
- Jenkinson M, Bannister P, Brady M, Smith S. Improved optimization for the robust and accurate linear registration and motion correction of brain images. Neuroimage. 2002;17:825–841. doi: 10.1016/s1053-8119(02)91132-8. [DOI] [PubMed] [Google Scholar]
- Jin DZ, Dragoi V, Sur M, Seung HS. Tilt aftereffect and adaptation-induced changes in orientation tuning in visual cortex. J Neurophysiol. 2005;94:4038–4050. doi: 10.1152/jn.00571.2004. [DOI] [PubMed] [Google Scholar]
- Kamitani Y, Tong F. Decoding the visual and subjective contents of the human brain. Nat Neurosci. 2005;8:679–685. doi: 10.1038/nn1444. [DOI] [PMC free article] [PubMed] [Google Scholar]
- Kastner S, Pinsk MA, De Weerd P, Desimone R, Ungerleider LG. Increased activity in human visual cortex during directed attention in the absence of visual stimulation. Neuron. 1999;22:751–761. doi: 10.1016/s0896-6273(00)80734-5. [DOI] [PubMed] [Google Scholar]
- Krekelberg B, Boynton GM, van Wezel RJ. Adaptation: from single cells to BOLD signals. Trends Neurosci. 2006;29:250–256. doi: 10.1016/j.tins.2006.02.008. [DOI] [PubMed] [Google Scholar]
- Larsson J. PhD Thesis. Karolinska Institute; Stockholm: 2001. Imaging vision: functional mapping of intermediate visual processes in man. [Google Scholar]
- Larsson J, Heeger DJ. Two retinotopic visual areas in human lateral occipital cortex. J Neurosci. 2006;26:13128–13142. doi: 10.1523/JNEUROSCI.1657-06.2006. [DOI] [PMC free article] [PubMed] [Google Scholar]
- Larsson J, Landy MS, Heeger DJ. Orientation-selective adaptation to first- and second-order patterns in human visual cortex. J Neurophysiol. 2006;95:862–881. doi: 10.1152/jn.00668.2005. [DOI] [PMC free article] [PubMed] [Google Scholar]
- Levitt H. Transformed up-down methods in psychoacoustics. J Acoust Soc Am. 1971;49(Suppl 2):467. [PubMed] [Google Scholar]
- Ling S, Carrasco M. When sustained attention impairs perception. Nat Neurosci. 2006;9:1243–1245. doi: 10.1038/nn1761. [DOI] [PMC free article] [PubMed] [Google Scholar]
- Liu T, Slotnick SD, Serences JT, Yantis S. Cortical mechanisms of feature-based attentional control. Cereb Cortex. 2003;13:1334–1343. doi: 10.1093/cercor/bhg080. [DOI] [PubMed] [Google Scholar]
- Liu T, Pestilli F, Carrasco M. Transient attention enhances perceptual performance and FMRI response in human visual cortex. Neuron. 2005;45:469–477. doi: 10.1016/j.neuron.2004.12.039. [DOI] [PMC free article] [PubMed] [Google Scholar]
- Liu T, Stevens ST, Carrasco M. Comparing the time course and efficacy of spatial and feature-based attention. Vision Res. 2007;47:108–113. doi: 10.1016/j.visres.2006.09.017. [DOI] [PubMed] [Google Scholar]
- Martinez-Trujillo JC, Treue S. Feature-based attention increases the selectivity of population responses in primate visual cortex. Curr Biol. 2004;14:744–751. doi: 10.1016/j.cub.2004.04.028. [DOI] [PubMed] [Google Scholar]
- Maunsell JH, Treue S. Feature-based attention in visual cortex. Trends Neurosci. 2006;29:317–322. doi: 10.1016/j.tins.2006.04.001. [DOI] [PubMed] [Google Scholar]
- McAdams CJ, Maunsell JH. Effects of attention on orientation-tuning functions of single neurons in macaque cortical area V4. J Neurosci. 1999;19:431–441. doi: 10.1523/JNEUROSCI.19-01-00431.1999. [DOI] [PMC free article] [PubMed] [Google Scholar]
- Montaser-Kouhsari L, Rajimehr R. Attentional modulation of adaptation to illusory lines. J Vis. 2004;4:434–444. doi: 10.1167/4.6.3. [DOI] [PubMed] [Google Scholar]
- Muller MM, Andersen S, Trujillo NJ, Valdes-Sosa P, Malinowski P, Hillyard SA. Feature-selective attention enhances color signals in early visual areas of the human brain. Proc Natl Acad Sci USA. 2006;103:14250–14254. doi: 10.1073/pnas.0606668103. [DOI] [PMC free article] [PubMed] [Google Scholar]
- Murray SO, Wojciulik E. Attention increases neural selectivity in the human lateral occipital complex. Nat Neurosci. 2004;7:70–74. doi: 10.1038/nn1161. [DOI] [PubMed] [Google Scholar]
- O'Craven KM, Rosen BR, Kwong KK, Treisman A, Savoy RL. Voluntary attention modulates fMRI activity in human MT-MST. Neuron. 1997;18:591–598. doi: 10.1016/s0896-6273(00)80300-1. [DOI] [PubMed] [Google Scholar]
- Parker AJ, Newsome WT. Sense and the single neuron: probing the physiology of perception. Annu Rev Neurosci. 1998;21:227–277. doi: 10.1146/annurev.neuro.21.1.227. [DOI] [PubMed] [Google Scholar]
- Pouget A, Dayan P, Zemel R. Information processing with population codes. Nat Rev Neurosci. 2000;1:125–132. doi: 10.1038/35039062. [DOI] [PubMed] [Google Scholar]
- Reynolds JH, Chelazzi L. Attentional modulation of visual processing. Annu Rev Neurosci. 2004;27:611–647. doi: 10.1146/annurev.neuro.26.041002.131039. [DOI] [PubMed] [Google Scholar]
- Rezec A, Krekelberg B, Dobkins KR. Attention enhances adaptability: evidence from motion adaptation experiments. Vision Res. 2004;44:3035–3044. doi: 10.1016/j.visres.2004.07.020. [DOI] [PubMed] [Google Scholar]
- Saenz M, Buracas GT, Boynton GM. Global effects of feature-based attention in human visual cortex. Nat Neurosci. 2002;5:631–632. doi: 10.1038/nn876. [DOI] [PubMed] [Google Scholar]
- Saenz M, Buracas GT, Boynton GM. Global feature-based attention for motion and color. Vision Res. 2003;43:629–637. doi: 10.1016/s0042-6989(02)00595-3. [DOI] [PubMed] [Google Scholar]
- Schoenfeld M, Hopf JM, Martinez A, Mai H, Sattler C, Gasde A, Heinze HJ, Hillyard S. Spatio-temporal Analysis of Feature-Based Attention. Cereb Cortex. 2007 doi: 10.1093/cercor/bhl154. in press. Published online January 4, 2007. [DOI] [PubMed] [Google Scholar]
- Schroeder CE, Mehta AD, Foxe JJ. Determinants and mechanisms of attentional control over cortical neural processing. Front Biosci. 2001;6:672–684. doi: 10.2741/schroed. [DOI] [PubMed] [Google Scholar]
- Sclar G, Lennie P, DePriest DD. Contrast adaptation in striate cortex of macaque. Vision Res. 1989;29:747–755. doi: 10.1016/0042-6989(89)90087-4. [DOI] [PubMed] [Google Scholar]
- Serences JT, Schwarzbach J, Courtney SM, Golay X, Yantis S. Control of object-based attention in human cortex. Cereb Cortex. 2004;14:1346–1357. doi: 10.1093/cercor/bhh095. [DOI] [PubMed] [Google Scholar]
- Sereno MI, Dale AM, Reppas JB, Kwong KK, Belliveau JW, Brady TJ, Rosen BR, Tootell RB. Borders of multiple visual areas in humans revealed by functional magnetic resonance imaging. Science. 1995;268:889–893. doi: 10.1126/science.7754376. [DOI] [PubMed] [Google Scholar]
- Singer W, Gray CM. Visual feature integration and the temporal correlation hypothesis. Annu Rev Neurosci. 1995;18:555–586. doi: 10.1146/annurev.ne.18.030195.003011. [DOI] [PubMed] [Google Scholar]
- Spivey MJ, Spirn MJ. Selective visual attention modulates the direct tilt aftereffect. Percept Psychophys. 2000;62:1525–1533. doi: 10.3758/bf03212153. [DOI] [PubMed] [Google Scholar]
- Treue S, Martinez Trujillo JC. Feature-based attention influences motion processing gain in macaque visual cortex. Nature. 1999;399:575–579. doi: 10.1038/21176. [DOI] [PubMed] [Google Scholar]
- Wenderoth P, Johnstone S. The different mechanisms of the direct and indirect tilt illusions. Vision Res. 1988;28:301–312. doi: 10.1016/0042-6989(88)90158-7. [DOI] [PubMed] [Google Scholar]
- Yantis S. Goal-directed and stimulus-driven determinants of attentional control. In: Monsell S, Driver J, editors. Control of Cognitive Processes: Attention and Performance XVIII. Cambridge, MA: MIT Press; 2000. pp. 73–103. [Google Scholar]
Associated Data
This section collects any data citations, data availability statements, or supplementary materials included in this article.
Supplementary Materials
The Supplemental Data for this article can be found online at http://www.neuron.org/cgi/content/full/55/2/313/DC1/.