Abstract
Tumor blood vessels are thought to contain genetically normal and stable endothelial cells (ECs), unlike tumor cells, which typically display genetic instability. Yet, chromosomal aberration in human tumor-associated ECs (hTECs) in carcinoma has not yet been investigated. Here we isolated TECs from 20 human renal cell carcinomas and analyzed their cytogenetic abnormalities. The degree of aneuploidy was analyzed by fluorescence in situ hybridization using chromosome 7 and chromosome 8 DNA probes in isolated hTECs. In human renal cell carcinomas, 22–58% (median, 33%) of uncultured hTECs were aneuploid, whereas normal ECs were diploid. The mechanisms governing TEC aneuploidy were then studied using mouse TECs (mTECs) isolated from xenografts of human epithelial tumors. To investigate the contribution of progenitor cells to aneuploidy in mTECs, CD133+ and CD133− mTECs were compared for aneuploidy. CD133+ mTECs showed aneuploidy more frequently than CD133− mTECs. This is the first report showing cytogenetic abnormality of hTECs in carcinoma, contrary to traditional belief. Cytogenetic alterations in tumor vessels of carcinoma therefore can occur and may play a significant role in modifying tumor- stromal interactions.
Tumor angiogenesis is necessary for solid tumor progression and metastasis.1 Inhibiting the development of abnormal blood vessels associated with cancer is a promising therapeutic strategy for treating cancer. Bevacizumab, an antivascular endothelial growth factor-neutralizing antibody, prolongs the survival of patients with advanced cancer of the colon,2 breast,3 or kidney4 when used with conventional chemotherapeutic drugs. However, such therapeutic treatments are not sufficient to cure cancer. One of the probable reasons is drug resistance caused by the compensatory response of tumor cells.5 Long-term suppression of the expression of one angiogenic protein can lead to the emergence of the expression of other angiogenic proteins. Secondary acquisition of resistance to antiangiogenic drugs by endothelial cells (ECs) might be another reason.
An important concept in tumor angiogenesis is that tumor blood vessels contain ECs that are genetically normal and stable, unlike tumor cells, which typically display genetic instability.6 However, tumor vessels and tumor-associated ECs (TECs) differ from their normal counterparts in many respects.7,8,9,10,11,12 Tumor vessels have different structural characteristics, such as fewer pericytes, leakiness, and uneven thickness of the basement membrane.9 Furthermore, some studies have reported that TECs possess molecular characteristics distinct from those of normal ECs (NECs).8,10,11 In addition, ECs derived from human renal cell carcinomas (RCCs) express biological features that are different from those of NECs.13
It has been reported that ECs from hematopoietic tumors harbor chromosomal aberrations. In these tumors, TECs may transdifferentiate from hematopoietic tumor cells.12,14
We have reported that ECs in nonhematopoietic malignant tumors (melanoma and liposarcoma) are cytogenetically abnormal. In mouse xenograft models, fluorescence in situ hybridization (FISH) analysis shows that freshly isolated mouse TECs (mTECs) are aneuploid and have abnormal multiple centrosomes.15,16 Our previous study showed that mTECs, unlike ECs in lymphomas with hematopoietic origin, did not transdifferentiate to or fuse with tumor cells because there were no human chromosomes from tumor cells in the mTEC nuclei. However, it remains to be elucidated whether these cytogenetic aberrations in mTECs isolated from malignant tumors are relevant to human TECs (hTECs) from human epithelial malignant tumors.
In the present study, we investigated chromosomal aberration in hTECs freshly isolated from RCCs (spontaneous human tumors) by FISH analysis. To study the mechanism of TEC aneuploidy, we analyzed cell-cell fusion and the relationship between progenitor marker-positive cells and TEC aneuploidy in cross-species tumor models.
Materials and Methods
Human Tissue Samples
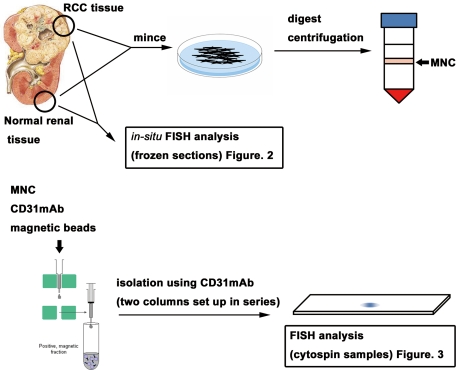
Tissues from 20 cases of renal tumor clinically diagnosed as RCC were resected surgically (histological types: 16 clear cell carcinomas, 2 papillary carcinomas, 1 chromophobe RCC, and 1 clear cell carcinoma with sarcomatoid changes). Age of the patients ranged from 37 to 81 years. Samples were obtained from 16 males and 4 females (Table 1). The protocols were approved by the Institutional Ethics Committee, and written informed consent was obtained from each patient before surgery. Samples were excised immediately after operation, from the tumor tissues, and when possible, from corresponding normal renal tissues 5–10 cm away from the tumor. One portion of the sample was immediately snap-frozen in liquid nitrogen and stored at −80°C for immunohistology, and another portion was placed in HBSS on ice until EC isolation. Final diagnosis of RCC was confirmed by pathological examination of formalin-fixed surgical specimens (Figure 1).
Table 1.
Background in 20 RCC Samples and Aneuploidy Rate in hTECs and hNECs
| Sample no. | M/F | Age (yr) | TNM* | Subtype | Grade,† INF, v | Chr.7 in hTEC (%) | Chr.8 in hNEC (%) | Chr.7 in hNEC (%) | Chr.8 in hNEC (%) |
|---|---|---|---|---|---|---|---|---|---|
| 1 | M | 61 | T1a, Nx, M0 | Clear cell | G2, INFb, v(−) | 37 | 37 | NA | NA |
| 2‡ | M | 80 | T3a, Nx, M0 | Clear cell | G2, INFa, v(−) | 43 | 38 | 5 | 3 |
| 3 | F | 56 | T1a, N0, M0 | Choromophobe | G3, INFa, v(−) | 38 | 32 | NA | NA |
| 4 | M | 65 | T2, N0, M1 (bone) | Clear cell | G2, INFa, v(−) | 48 | 35 | NA | NA |
| 5‡ | M | 60 | T1a, N0, M0 | Clear cell | G2, INFa, v(−) | 31 | 33 | 5 | 4 |
| 6 | F | 72 | T1a, Nx, M0 | Clear cell | G2, INFa, v(−) | 40 | 47 | NA | NA |
| 7‡ | M | 75 | T1a, Nx, M0 | Clear cell | G2, INFa, v(−) | 28 | 33 | 4 | 4 |
| 8 | M | 37 | T1a, Nx, M0 | Clear cell | G2, INFa, v(−) | 27 | 33 | NA | NA |
| 9‡ | M | 55 | T3a, N0, M0 | Clear cell | G3, INFb, v(+) | 31 | 45 | 4 | 3 |
| 10‡ | M | 70 | T1a, N0, M0 | Clear cell | G3, INFa, v(−) | 22 | 23 | 4 | 2 |
| 11‡ | F | 58 | T3a, Nx, M1 (bone) | Clear cell; sarcomatoid | G3 >> 2, INFb, v(−) | 22 | 27 | 4 | 4 |
| 12 | M | 62 | T1a, Nx, M0 | Papillary type2 | INFb, v(−) | 58 | 43 | NA | NA |
| 13‡ | M | 69 | T1b, Nx, M0 | Clear cell | G2, INFa, v(−) | 27 | 41 | 4 | 4 |
| 14‡ | M | 44 | T1a, Nx, M0 | Clear cell | G2, INFa, v(−) | 31 | 37 | 3 | 3 |
| 15‡ | M | 57 | T1b, Nx, M0 | Clear cell | G2, INFa, v(−) | 26 | 30 | 5 | 3 |
| 16 | M | 81 | T1a, Nx, M0 | Clear cell | G1, INFa, v(−) | 29 | 33 | NA | NA |
| 17‡ | F | 37 | T1b, Nx, M0 | Clear cell | G2 > 3, INFa, v(−) | 31 | 38 | 5 | 2 |
| 18‡ | M | 73 | T1a, Nx, M0 | Clear cell | G2, INFa, v(−) | 26 | 25 | 5 | 3 |
| 19‡ | M | 73 | T3a, Nx, M0 | Clear cell | G2, INFa, v(+) | 36 | 30 | 5 | 3 |
| 20‡ | M | 58 | T1b, Nx, M0 | Clear cell | G2, INFa, v(−) | 31 | 37 | 5 | 2 |
M/F, male/female; NA, not available; INF, infiltration pattern.
According to 1997 tumor-node-metastasis (TNM) staging guidelines.
According to Fuhrman system.
Magnetic beads cell sorting of normal renal endothelial cells were performed.
Figure 1.
Schematic representation of hTEC and hNEC isolation. One portion of RCC or normal kidney tissue was immediately snap-frozen for immunohistology and FISH analysis. Another portion of RCC or normal kidney tissue was immediately processed to isolate ECs by MACS. hTECs were freshly isolated from RCC tissue. hNECs were also isolated from normal kidney tissue, apart from the tumor in the same specimens. FISH analysis was performed to investigate aneuploidy in tumor cell-free conditions. MNC, mononuclear cell.
Isolation of hTECs and Human NECs
Excised human tumor and normal kidney tissues in HBSS were processed using a magnetic cell sorting system (MACS; Miltenyi Biotec, Tokyo, Japan) to isolate hTECs and human NECs (hNECs) promptly, as described previously.15 Briefly, excised tissues were minced and digested with collagenase II (Worthington, Freehold, NJ). Blood cells were removed by single sucrose step-gradient centrifugation with Histopaque 1077 (Sigma-Aldrich, St. Louis, MO), and cell suspensions were filtered. The cells were then incubated with anti-human CD31 antibody (eBioscience, San Diego, CA), and hTECs or hNECs were isolated by MACS according to the manufacturer’s instructions, using anti-mouse IgG microbeads (Miltenyi Biotec). They were plated and grown in EGM-2MV (Clonetics, San Diego, CA) and 15% fetal bovine serum (FBS). To improve the purity of hTECs or hNECs, magnetic sorting was performed using two MACS columns set up in series (Figure 1).
Cell Culture
The HSC-3 human oral squamous cell carcinoma line was supplied by the Japanese Cancer Research Bank (Tokyo, Japan). Cells were cultured in Dulbecco’s modified Eagle’s medium (Sigma-Aldrich) supplemented with 10% heat-inactivated FBS. The OSRC-2 human RCC cell line was purchased from the Riken Cell Bank (Tsukuba, Japan). The cells were cultured in RPMI 1640 medium (Sigma-Aldrich) supplemented with 10% heat-inactivated FBS. Human umbilical vascular ECs (HUVECs) and human microvascular ECs were purchased from Clonetics. The cells were cultured in EGM-2MV. MS-1 cells (mouse EC line) were purchased from the American Type Culture Collection (Manassas, VA). The cells were cultured in Dulbecco’s modified Eagle’s medium supplemented with 10% heat-inactivated FBS.
Isolation of mTECs and Mouse NECs
All animal procedures were performed in compliance with Hokkaido University guidelines, and the protocols were approved by the Institutional Animal Care and Use Committee. mTECs were isolated from epithelial tumors and OSRC-2 and HSC-3 cell xenografts in 8- to 10-week-old nude mice (Sankyo Labo, Tokyo, Japan) using MACS. Mouse NECs (mNECs) were isolated from mouse dermal tissue as control. To isolate mTECs or mNECs, we used fluorescein isothiocyanate (FITC)-anti-mouse CD31 antibody (BD Pharmingen, San Diego, CA) and anti-FITC microbeads (Miltenyi Biotec) following the procedure described above. mTECs and mNECs were plated onto 1.5% gelatin-coated culture plates and grown in EGM-2MV and 15% FBS. Diphtheria toxin (500 ng/ml; Calbiochem, San Diego, CA) was added to mTEC subcultures to kill any remaining human tumor cells.17
Immunochemistry
The frozen specimens obtained from human tissue samples were sectioned at a thickness of 8 μm. Freshly isolated hTECs, hNECs, mTECs, and mNECs (1 × 10⁴ of each cell type) were cytospun onto a glass slide for immunocytostaining and FISH, using Shandon Cytospin 4 (Thermo Shandon, Pittsburgh, PA).
Immunofluorescence was performed after fixation with 100% ice-cold acetone for 10 minutes and blocking with 2% goat and 5% sheep serum in PBS for 30 minutes. The following primary antibodies were used: anti-human CD31, anti-human VE-cadherin (BD Pharmingen), anti-human carbonic anhydrase IX (CA IX; R&D Systems, Minneapolis, MN), anti-mouse CD31 (BD Pharmingen), and FITC-anti-mouse CD133 (eBioscience). As secondary antibodies, Alexa Fluor 488 anti-mouse IgG, Alexa Fluor 568 anti-mouse IgG, and Alexa Fluor 488 anti-rat IgG (Molecular Probes, Eugene, OR) were used as required.
To analyze microvessel density in tumor sections, the number of CD31-stained vessels per unit area in tissue sections was determined using MetaMorph software (Molecular Devices, Tokyo, Japan).
FISH
After immunostaining of CD31, VE-cadherin, CA IX, or CD133, samples on glass slides were fixed for 45 minutes using Histochoice (Amresco, Solon, OH) as described previously.18 FISH was performed using a Cy3-human chromosome 7 locus-specific BAC probe (RPCI11-88E13) and a Cy3/Spectrum Green-human chromosome 8 BAC probe (RP11-89M20) in human samples and a Cy3-mouse chromosome 17 locus-specific BAC probe (RP23-146B6) and FITC-human Cot-1 in mouse samples (Chromosome Science, Sapporo, Japan). All samples were counterstained with 4′,6-diamidino-2-phenylindole (DAPI; Roche, Indianapolis, IN). Hybridization signals were observed and analyzed using an Olympus IX71 fluorescence microscope (Olympus, Tokyo, Japan) for each experiment. Chromosomes were counted in at least 100 nuclei in each sample. Aneuploid cells were counted three times in each sample. Cells with a single signal of each probe were not included in the analysis because it was difficult to judge whether the single signal was due to monosomy or incomplete hybridization. Statistical analysis was performed using the Mann-Whitney U-test. A P value of <0.05 was considered significant.
Isolation of RNA and Quantitative RT-PCR
RNA was isolated using the RNeasy micro kit (Qiagen, Valencia, CA), according to the manufacturer’s instructions. The RNase-free DNase set (Qiagen) treatment was incorporated into RNA isolation according to the protocol. The primers were as follows: mouse centromere-associated protein-E (CENP-E), forward 5′-TGAGCAGCAGAAAGAAAGCA-3′, reverse 5′-TCCATCTCCACCTTTTCCAG-3′; mouse glyceraldehyde-3-phosphate dehydrogenase, forward 5′-TCTGACGTGCCGCCTGGAG-3′, reverse 5′-TCGCAGGAGACAACCTGGTC-3′; human CENP-E, forward 5′-GAAGAGATCCCAGTGCTTCA-3′, reverse 5′-TGAGTCCTTGGTTGTGGACT-3′; and human glyceraldehyde-3-phosphate dehydrogenase, forward 5′-TCAAGAAGGTGGTGAAGCAG-3′, reverse 5′-AAAGGTGGAGGAGTGGGTGT-3′. Five micrograms of RNA was used in a 15-μl reaction, and quantitative RT-PCR was performed using the DyNAmo SYBR green qPCR kit (Finnzymes, Espoo, Finland), according to the manufacturer’s instructions. Cycling conditions were set according to the manufacturer’s instructions, based on the use of Opticon Monitor version 3.0 (Bio-Rad, Hercules, CA). Briefly, the cycling schedule was as follows: polymerase activation for 15 minutes at 95°C and then PCR for 30 cycles of 15 seconds at 95°C, 15 seconds at 57°C, and 20 seconds at 72°C. Expression levels of CENP-E mRNA were normalized to glyceraldehyde-3-phosphate dehydrogenase.
Results
Aneuploid ECs in Human RCC Tissue Sections
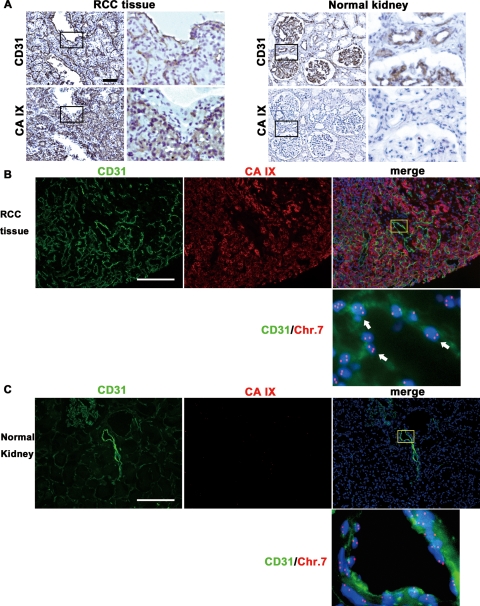
We tested the hypothesis that ECs in human RCC have chromosomal aberrations. Immunostaining was performed to identify microvascular ECs with anti-CD31 antibody and tumor cells with anti-CA IX antibody, followed by FISH on 20 frozen tumor sections. It has been reported that CA IX is a marker of RCC.19 We confirmed that CA IX staining was positive in only tumor cells but not in tumor vessels in RCC tissue (Figure 2A). CA IX expression was not detected in normal kidney tissue. Thus, we could distinguish tumor cells from ECs and reject the possibility of contamination of tumor cells in hTECs using anti-CA IX and anti-CD31 antibodies.
Figure 2.
FISH analysis in human RCC and normal renal tissue sections. A: CA IX immunostaining in RCC tissue and normal kidney tissue. Upper panels show CD31 staining in vascular ECs. Lower panels show that CA IX was expressed in tumor cells in RCC tissue but not in normal kidney tissue. Scale bar, 100 μm. B and C: FISH analysis in RCC tissue and normal kidney tissue immunostained for CD31 and CA IX. RCC tissue (B) and normal kidney (C) were stained for CD31 and CA IX. After immunohistochemistry, FISH was performed using a chromosome 7 DNA probe (red). Nuclei were counterstained with DAPI (blue). B shows that CD31 was expressed on ECs and CA IX was expressed on tumor cells separately in RCC tissue. ECs (green) with 3 or more chromosome 7 signals (red) were detected in RCC vessels (white arrows). C shows lack of CA IX expression in normal renal tissue sections. No aneuploid ECs were evident in normal renal vessels. Scale bars, 100 μm.
FISH analysis of immunostained samples confirmed the presence of CD31+ aneuploid cells, determined as aneuploid ECs, in tumor vessels at higher magnification (Figure 2B, white arrow). In contrast, there were no aneuploid ECs in normal renal vessels (Figure 2C). These results suggest that ECs in RCC vessels harbor cytogenetic alterations.
Aneuploidy in Freshly Isolated, Uncultured Human RCC ECs
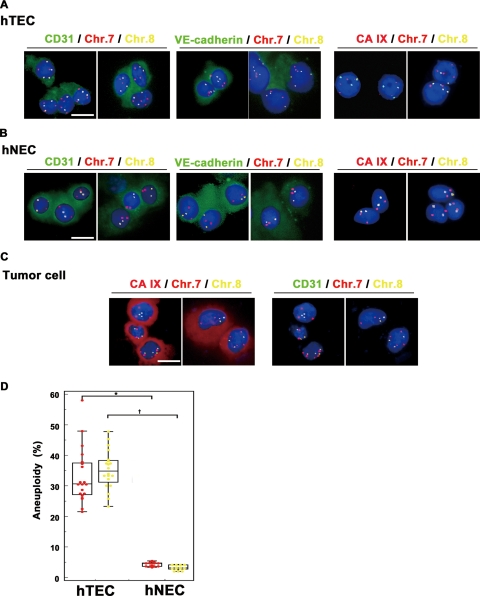
Since aneuploid ECs in a frozen section could represent the overlapping of aneuploid tumor cells, we freshly isolated hTECs and investigated their aneuploidy in tumor cell-free conditions. hTECs were isolated from all 20 specimens by MACS with antiCD31 antibody. In 13 of 20 specimens, hNECs were isolated from normal renal tissue apart from the tumor as a normal counterpart. In all samples, >98% of hTECs and hNECs were positive for CD31 as well as another endothelial marker, VE-cadherin. However, CA IX (RCC marker) expression was not observed in either hTECs or hNECs (Figure 3, A and B). Furthermore, CA IX+CD31− cells (tumor cells) were detected only in the negative fraction of primary EC isolates (Figure 3C). These results indicated that all hTECs were isolated with high purity. FISH analysis of hTECs and hNECs showed that the nuclei of hTECs harbored three or more signals of chromosome 7 and chromosome 8 probes, thus showing aneuploidy, in all 20 samples (Figure 3A), whereas the nuclei of hNECs had two signals, showing diploidy (Figure 3B). The percentages of aneuploid cells were 33.1 ± 8.8% (chromosome 7) and 35.3 ± 6.2% (chromosome 8) among hTECs (n = 20), and 4.4 ± 0.7% (chromosome 7) and 3.2 ± 0.8% (Chr 8) among hNECs (n = 13). A significant (P < 0.001) difference was observed in the percentage of aneuploid cells between hTECs and hNECs (Figure 3D). There was no correlation between the percentage of aneuploid cells and tumor stage, tumor grade, patient’s age, or sex (data not shown). FISH analysis of freshly isolated and cytospun samples strengthened the evidence of TEC aneuploidy in human RCC tissue sections.
Figure 3.
FISH analysis in freshly isolated and cytospun hTECs and hNECs. A and B: FISH analysis of freshly isolated and cytospun hTECs and hNECs. hTECs (A) and hNECs (B) were stained for CD31, VE-cadherin, or the RCC marker CA IX. FISH was performed using chromosome 7 (red) and chromosome 8 (yellow) DNA probes. Nuclei were counterstained with DAPI (blue). hNECs and hTECs were positive for VE-cadherin as well as CD31. No CA IX expression was observed in hNECs and hTECs. In FISH analysis, three or more chromosome 7 (red) and chromosome 8 (yellow) signals were detected in hTECs, indicating aneuploidy (A). On the other hand, hNECs showed two signals, indicating diploidy (B). C: Tumor cells (CA IX+CD31− cells with aneuploidy) were detected in the negative fraction of primary EC isolates. D: Aneuploidy was observed in isolated hTECs in all RCC samples by FISH analysis using chromosome 7 and chromosome 8 DNA probes. hTECs harbored more aneuploid cells compared with hNECs (∗P < 0.001, †P < 0.001). Scale bars, 10 μm. To determine the percentage of aneuploid cells, 100 nuclei were evaluated in each sample. Aneuploid cells were counted three times in each sample. Statistical analysis was performed using the Mann-Whitney U-test. A value of P < 0.05 was considered significant.
Aneuploidy in mTECs
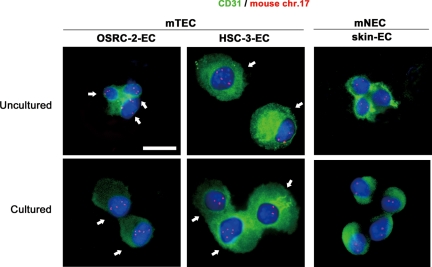
mTECs were isolated from human epithelial tumor xenografts grown in nude mice. OSRC-2-ECs and HSC-3-ECs were isolated from renal clear cell carcinoma (OSRC-2) and oral squamous cell carcinoma (HSC-3) xenografts, respectively. mNECs (skin ECs) were isolated from mouse dermal tissue as a control. More than 98% of uncultured mTECs and mNECs were positive for CD31, as shown by immunostaining (Figure 4). FISH analysis of purified mouse ECs before culture showed that the nuclei of OSRC-2-ECs and HSC-3-ECs had three or more chromosome 17 signals.
Figure 4.
FISH analysis in uncultured and cultured mTECs and mNECs. mTECs isolated from xenografts of human epithelial tumors were aneuploid. Cultured and uncultured mTECs were positive for CD31 (green). Nuclei were counterstained with DAPI (blue). Three or more chromosome 17 signals (red) were detected among uncultured mTECs (white arrows). Scale bar, 10 μm.
In contrast, skin ECs had two signals, showing diploidy (Figure 4). Quantitative analysis indicated that 55% of OSRC-2-ECs and 36% of HSC-3-ECs were aneuploid. When the cells were cultured, FISH analysis showed that the frequency of mTEC aneuploidy increased to 96 and 55% for OSRC-2-ECs (passage 13) and HSC-3-ECs (passage 11), respectively (Table 2). These results are consistent with our previously reported demonstration of aneuploidy in mTECs isolated from nonepithelial tumors, liposarcoma, and melanoma.15 These results suggested that ECs in various types of tumors, epithelial or nonepithelial, can sometimes be aneuploid. We performed the following experiments using these uncultured mTECs (OSRC-2-ECs and HSC-3-ECs) to address the mechanism of TEC aneuploidy.
Table 2.
Percentage of Aneuploid Cells in mTEC and mNECs
| Percentage of aneuploid cells
|
|||
|---|---|---|---|
| mTEC
|
mNEC skin-EC | ||
| OSRC-2-EC | HSC-3-EC | ||
| Uncultured | 55% (P0) | 38% (P0) | 3% (P0) |
| Cultured | 96% (P13) | 55% (P11) | 8% (P12) |
When cultured, the degree of mTEC aneuploidy increased in both OSRC-2-ECs and HSC-3-ECs compared with skin ECs.
Absence of Fusion between ECs and Human Tumor Cells in OSRC-2-ECs and HSC-3-ECs
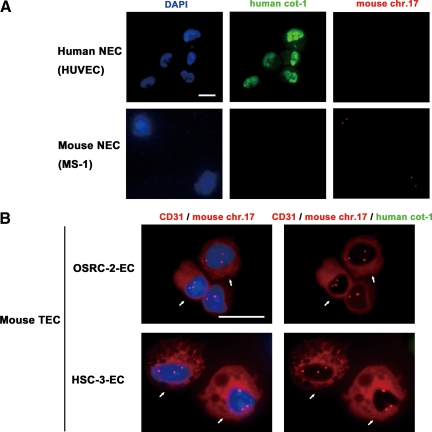
Mouse fibroblasts can be polyploid, harboring both mouse and human chromosomes, in human breast carcinoma xenografts grown in mice.20 To clarify the fusion between mouse ECs and human tumor cells in mTECs before culture, uncultured mTECs (OSRC-2-ECs and HSC-3-ECs) were cytospun onto glass slides, immunostained with mouse anti-CD31 (red), and probed with green (human) fluorescent Cot-1. Furthermore, to determine whether fusion occurred between aneuploid mTECs and human tumor cells, dual-color FISH analysis was performed, using Cy3-mouse chromosome 17 locus-specific probes (red) and FITC-human Cot-1 (green). Before analyzing the mTECs, we performed a dual-color FISH procedure on human EC (HUVECs) and mouse EC (MS-1) samples and confirmed that human Cot-1 hybridized with nuclei in >97% of HUVECs in a diffuse manner but not with nuclei in MS-1 (Figure 5A). Dual-color FISH analysis performed on mTECs showed that the CD31+ mTECs that were stained with Alexa Fluor 568 (red) had three signals of the mouse chromosome 17 probe labeled with Cy3 (red), showing aneuploidy in both OSRC-2-ECs and HSC-3-ECs (Figure 5B, white arrow). However, no nuclei of aneuploid mTECs hybridized to human Cot-1 (green, 0%; Figure 5B, white arrow). In this experiment, we analyzed 300 aneuploid mTECs stained with anti-CD31 in each sample. In fact, no human FISH signal in mTECs was detected, including aneuploid mTECs that were stained with mouse anti-CD31 and hybridized with a mouse chromosome 17 probe. These results showed that there was no fusion between mTECs and human tumor cells in our cross-species tumor xenograft model.
Figure 5.
Immunocytochemistry and dual-probe FISH analysis in uncultured mTECs. A: Probes for dual-probe FISH were tested for specificity before use with mTECs. An FITC-human Cot-1 DNA probe hybridized in human ECs and HUVECs but not in mouse ECs (MS-1). On the other hand, a Cy-3-mouse chromosome 17 locus-specific probe hybridized in MS-1 cells but not HUVECs. Scale bar, 10 μm. B: Uncultured mTECs were immunostained with anti-CD31, followed by dual-probe FISH using a Cy3 mouse chromosome 17 locus-specific probe and a FITC-human Cot-1 DNA probe. Nuclei were counterstained with DAPI (blue). CD31+ cells (red) with three or more chromosome 17 signals (red), identifying them as aneuploid mTECs, were detected (white arrows). Aneuploid mTECs did not hybridize with human Cot-1 (green), suggesting there was no fusion between human tumor cells and mTECs. Scale bar, 10 μm.
Aneuploidy in CD133+ mTECs
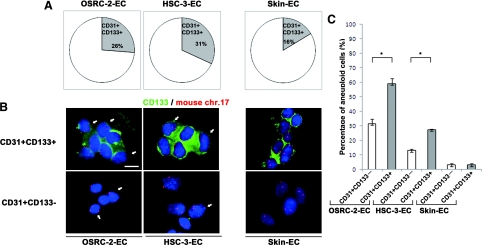
Next, to analyze the involvement of endothelial progenitor cells (EPCs) in mTECs in vivo, we investigated the percentage of progenitor marker-positive cells among freshly isolated mTECs and its correlation with aneuploidy. We also investigated the percentage of progenitor marker-positive cells among mNECs freshly isolated from mouse dermal tissue. The percentage of CD133+ cells was 26% in OSRC-2-ECs, 31% in HSC-3-ECs, and 16% in skin ECs (Figure 6A). FISH analysis showed aneuploidy in CD133+ mTECs (Figure 6B). The percentage of aneuploid cells detected among CD133+ mTECs (CD31+CD133+) was 59.1 ± 3.5% (OSRC-2-ECs) and 27.4 ± 0.6% (HSC-3-ECs), whereas that among CD133− mTECs (CD31+CD133−) was 31.5 ± 3.2% (OSRC-2-ECs) and 13.0 ± 1.0% (HSC-3-ECs; Figure 6C). There was a significant difference in the percentage of aneuploid cells between CD31+CD133+ and CD31+CD133− cells in mTECs (P < 0.05). On the other hand, the aneuploidy rate was 3.0 ± 0.9% in CD133+ mNECs (CD31+CD133+) and 3.0 ± 1.0% in CD133− mNECs (CD31+CD133−), both of which are within the normal range for FISH analysis with this probe. These results suggest that aneuploidy of mTECs may be related to stem cell-related marker-expressing cells.
Figure 6.
Percentage of CD133+ cells among mTECs/mNECs and its correlation with aneuploidy. A: The percentage of CD133+ cells in mTECs was 26% (OSRC-2-ECs) and 31% (HSC-3-ECs), whereas that in mNECs was 16%. B: Uncultured mTECs or mNECs were immunostained with CD133 followed by FISH. Nuclei were counterstained with DAPI (blue). Three or more chromosome 17 signals (red) were detected in CD133+ (green) and CD133− mTECs (white arrows), whereas CD133+ and CD133− mNECs cells were diploid. C: Among mTECs, aneuploid cells were observed more frequently in CD31+CD133+ cells than in CD31+CD133− cells (∗P < 0.05). Scale bar, 10 μm.
Down-Regulation of CENP-E Expression in Aneuploid TECs
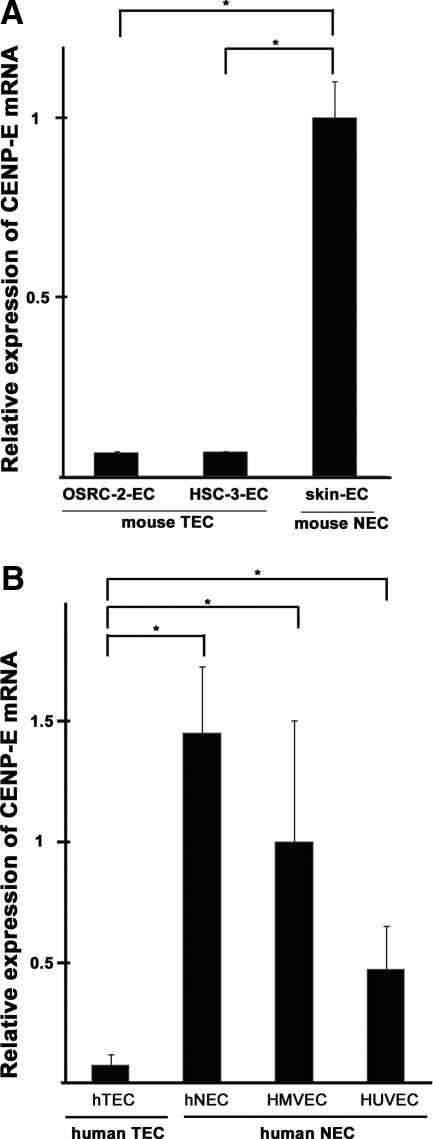
It has been reported that CENP-E is related to aneuploidy; cells with a reduced level of CENP-E become aneuploid because of the random missegregation of chromosomes.21 Levels of CENP-E mRNA were analyzed in mTECs and mNECs by quantitative RT-PCR. The CENP-E mRNA level was significantly lower in mTECs (in both OSRC-2-ECs and HSC-3-ECs) compared with mNECs (skin ECs; Figure 7A). Furthermore, we analyzed CENP-E expression in human ECs, for which we could expand cell number in culture. hTECs showed lower levels of CENP-E mRNA expression than hNECs (Figure 7B). These results suggest the possibility that aneuploidy, which is one of the results of chromosome missegregation, may result from down-regulation of CENP-E in both mTECs and hTECs.
Figure 7.
Down-regulation of CENP-E expression in aneuploid TECs. A: CENP-E mRNA expression levels were compared between mTECs and mNECs by quantitative RT-PCR. CENP-E expression was significantly lower in mouse TECs (both OSRC-2-ECs and HSC-3-ECs) compared with mNECs (skin ECs) (∗P < 0.05, †P < 0.05). B: CENP-E mRNA levels in isolated hTECs, hNECs, human microvascular ECs (HMVECs), and HUVECs. Compared with all human NECs (hNECs, HMVECs, and HUVECs), hTECs expressed significantly lower levels of CENP-E (∗P < 0.05).
Discussion
In the present study, we demonstrated several new lines of evidence: i) hTECs isolated from human RCC show aneuploidy, ii) mTECs isolated from epithelial tumor xenografts are aneuploid (there was no transdifferentiation or fusion of human tumor cells with mTECs), iii) CD133+ mTECs display more aneuploidy than CD133− mTECs, and iv) the CENP-E gene, which is related to the missegregation of chromosomes, is down-regulated in hTECs and mTECs.
We previously reported aneuploidy in mTECs isolated from nonepithelial tumors, liposarcoma, and melanoma.15 However, chromosomal aberrations of hTECs isolated from human malignant epithelial tumors have not been reported.
In this study, we used CA IX as a tumor marker in RCC. CA IX expression serves as a strong biomarker for kidney cancer, but it is uniformly negative in nontumor tissue.19 In our immunohistochemical studies, CA IX was positively immunostained in tumor cells but not in microvascular ECs in RCC. We could distinguish tumor cells from ECs using CA IX and CD31. Aneuploid cells detected in CD31+CA IX− cells were identified as aneuploid ECs in RCC vessels (CD31+CA IX− cells) by FISH analysis.
However, it could be argued that these signals result from tumor cell overlapping. Another concern is that whole EC nuclei are not always included in a single section because the diameter of tumor EC nuclei often exceeds 8 μm, which is the thickness of the frozen section. To evaluate the ploidy of hTECs quantitatively, we used hTECs freshly isolated from human RCC tissues. FISH analysis of freshly isolated and cytospun ECs provided additional evidence of hTEC aneuploidy in human RCC tissue sections. For comparative analysis, we also isolated hNECs from locations in the same specimens, apart from the tumor, during total nephrectomy. hTECs showed aneuploidy (average 33% with chromosome 7 probes and 35% with chromosome 8 probes) in all 20 samples, whereas hNECs were diploid with the 3–4% score, which is in normal range and is considered to be background.
The aneuploid hTECs described here provide new evidence for chromosomal instability in ECs in human epithelial tumors. In human hematopoietic tumors such as leukemias and lymphomas, TECs harbor the same chromosomal aberrations as tumors; for example, ∼40% of TECs harbor lymphoma-specific chromosomal translocations in B cell lymphomas.12 In these tumors, the mechanism of chromosomal aberrations in TECs was assumed to be transdifferentiation of tumor cells into ECs or derivation from common hemangioblasts.
However, the mechanisms underlying TEC aneuploidy in malignant epithelial tumors are not yet understood. We addressed the mechanisms of TEC aneuploidy using cross-species tumor models that allow host cells to be distinguished from tumor cells. In the mouse epithelial tumor xenograft model, >35% of mTECs were aneuploid, even when not cultured. Because of the species specificity when using anti-mouse CD31 in immunocytochemistry and the mouse chromosome 17 FISH probe, we were able to confirm that CD31+ aneuploid mTECs were of mouse origin. This result is consistent with our previously reported demonstrations of aneuploidy in mTECs isolated from nonepithelial tumors, liposarcoma, and melanoma.15 ECs in various types of tumors, epithelial or nonepithelial, may be aneuploid, suggesting chromosomal instability of mTECs.
In the human breast carcinoma xenograft model in mice, the mouse fibroblasts isolated from xenografts of human breast carcinoma were aneuploid, harboring both mouse and human chromosomes. This result suggests that the fibroblasts fused with tumor cells.20 In our uncultured mTECs, fusion between mTECs and human tumor cells was not seen because aneuploid mTECs were not found to hybridize with human Cot-1 in the dual-probe FISH analysis.
Bone marrow-derived endothelial progenitor cells are mobilized by stimulation of tumor-derived angiogenic factors such as vascular endothelial growth factor, which induce them to migrate toward the tumor and get incorporated into the developing neovasculature.22,23 Endothelial progenitor cells are undifferentiated, highly proliferative cells24 that have several characteristics distinguishing them from mature pre-existing or circulating ECs shed from blood vessel walls. Furthermore, endothelial progenitor cells express endothelial and stem cell markers such as CD133.25,26
In the present study, we investigated the percentage of CD133+ cells in uncultured and freshly isolated mTECs and mNECs. In uncultured mTECs, the percentage of CD31+CD133+ cells ranged from 26 to 32%. Interestingly, CD31+CD133+ cells showed more aneuploidy compared with CD31+CD133− cells. On the other hand, among uncultured mNECs, CD31+CD133+ cells did not include aneuploid cells. We speculate that immature ECs in tumors may have escaped cell cycle arrest and maintained aneuploidy in the tumor microenvironment. Progenitor cells with cell cycle deficiency harbor aneuploidy, and as the cells mature, their checkpoint efficiency increases.27 Our data demonstrating frequent aneuploidy in CD31+CD133+ cells support the hypothesis that progenitor cells contribute to mTECs aneuploidy.
It has been reported that defects in the mitotic checkpoint lead to aneuploidy in tumor cells.28 We therefore speculated that aneuploid mTECs and hTECs have a mitotic checkpoint deficiency. We analyzed the mRNA levels of CENP-E, which has roles in chromosome segregation and modulation of the spindle checkpoint. The CENP-E expression level in aneuploid TECs was significantly lower than that in NECs. Down-regulation of CENP-E may be one of the mechanisms of TEC aneuploidy.
Although the consequences of TEC aneuploidy remain unclear, aneuploidy in TECs provides evidence that TECs are indeed abnormal, unlike NECs. In fact, we found that the biological phenotypes of aneuploid mTECs differ from those of diploid mNECs. The mTECs were more sensitive to growth factors such as vascular endothelial growth factor, basic fibroblast growth factor, and epidermal growth factor.16,29 Furthermore, mTECs showed a different phenotype, including a higher growth rate and activation of growth factor receptors (data not shown; manuscript in preparation). hTECs with genetic instability may acquire resistance to chemotherapeutic drugs. Indeed, TECs can display resistance to the antiangiogenic activity of interferon γ,30 vincristine,13 or doxorubicin.31 Our mTECs also showed resistance to drugs such as fluorouracil (data not shown; manuscript in preparation). Moreover, survival factors that are abundant in the tumor microenvironment, such as cytokines and growth factors, may cause epigenetic changes not only in tumor cells but also in TECs.32,33
Here we show that hTECs, like tumor cells, are cytogenetically abnormal. This is contrary to the traditional concept that TECs are normal and genetically stable. Our observations suggest that aneuploidy in TECs is not a rare phenomenon that is seen only in hematopoietic tumors but is actually a common feature of most malignant tumors. Regardless of the actual mechanisms involved, our results showing the presence of chromosomal aberrations in hTECs indicate another aspect of abnormality of tumor stromal cells in carcinoma.
Interactions between cancer cells and the surrounding stroma can select stromal cells that modulate tumor behavior.34,35 Moreover, it was recently shown that genetic alteration in stromal cells may help account for the clinical diversity of cancer.36,37 Aneuploid TECs that organize tumor tissue surrounding the stroma might affect tumor progression and metastasis. It will be important to target abnormal tumor stroma to develop more effective cancer therapies.
Acknowledgments
We thank Dr. Tatsuhiro Shibata for discussions and critical reading of the manuscript and Ms. Midori Muranaka for technical assistance.
Footnotes
Address reprint requests to Kyoko Hida, D.D.S.c., Ph.D., Division of Vascular Biology, Hokkaido University Graduate School of Dental Medicine, N13 W7, Kita-ku, Sapporo 060-8586, Japan. E-mail: khida@den.hokudai.ac.jp.
Supported by grants-in-aid for scientific research from the Ministry of Education, Science, and Culture of Japan (to K.H. and M.S.) and the Haraguchi Memorial Foundation for Cancer Research, the Akiyama Foundation, and the Takeda Science Foundation (to K.H.).
T.A. and K.H. contributed equally to this work.
References
- Folkman J. Angiogenesis in cancer, vascular, rheumatoid and other disease. Nat Med. 1995;1:27–31. doi: 10.1038/nm0195-27. [DOI] [PubMed] [Google Scholar]
- Hurwitz H, Fehrenbacher L, Novotny W, Cartwright T, Hainsworth J, Heim W, Berlin J, Baron A, Griffing S, Holmgren E, Ferrara N, Fyfe G, Rogers B, Ross R, Kabbinavar F. Bevacizumab plus irinotecan, fluorouracil, and leucovorin for metastatic colorectal cancer. N Engl J Med. 2004;350:2335–2342. doi: 10.1056/NEJMoa032691. [DOI] [PubMed] [Google Scholar]
- Miller KD, Chap LI, Holmes FA, Cobleigh MA, Marcom PK, Fehrenbacher L, Dickler M, Overmoyer BA, Reimann JD, Sing AP, Langmuir V, Rugo HS. Randomized phase III trial of capecitabine compared with bevacizumab plus capecitabine in patients with previously treated metastatic breast cancer. J Clin Oncol. 2005;23:792–799. doi: 10.1200/JCO.2005.05.098. [DOI] [PubMed] [Google Scholar]
- Escudier B, Pluzanska A, Koralewski P, Ravaud A, Bracarda S, Szczylik C, Chevreau C, Filipek M, Melichar B, Bajetta E, Gorbunova V, Bay JO, Bodrogi I, Jagiello-Gruszfeld A, Moore N. Bevacizumab plus interferon α-2a for treatment of metastatic renal cell carcinoma: a randomised, double-blind phase III trial. Lancet. 2007;370:2103–2111. doi: 10.1016/S0140-6736(07)61904-7. [DOI] [PubMed] [Google Scholar]
- Folkman J. Angiogenesis: an organizing principle for drug discovery? Nat Rev Drug Discov. 2007;6:273–286. doi: 10.1038/nrd2115. [DOI] [PubMed] [Google Scholar]
- Folkman J. Tumor angiogenesis: therapeutic implications. N Engl J Med. 1971;285:1182–1186. doi: 10.1056/NEJM197111182852108. [DOI] [PubMed] [Google Scholar]
- Allinen M, Beroukhim R, Cai L, Brennan C, Lahti-Domenici J, Huang H, Porter D, Hu M, Chin L, Richardson A, Schnitt S, Sellers WR, Polyak K. Molecular characterization of the tumor microenvironment in breast cancer. Cancer Cell. 2004;6:17–32. doi: 10.1016/j.ccr.2004.06.010. [DOI] [PubMed] [Google Scholar]
- Lu C, Bonome T, Li Y, Kamat AA, Han LY, Schmandt R, Coleman RL, Gershenson DM, Jaffe RB, Birrer MJ, Sood AK. Gene alterations identified by expression profiling in tumor-associated endothelial cells from invasive ovarian carcinoma. Cancer Res. 2007;67:1757–1768. doi: 10.1158/0008-5472.CAN-06-3700. [DOI] [PubMed] [Google Scholar]
- McDonald DM, Choyke PL. Imaging of angiogenesis: from microscope to clinic. Nat Med. 2003;9:713–725. doi: 10.1038/nm0603-713. [DOI] [PubMed] [Google Scholar]
- Seaman S, Stevens J, Yang MY, Logsdon D, Graff-Cherry C, St. Croix B. Genes that distinguish physiological and pathological angiogenesis. Cancer Cell. 2007;11:539–554. doi: 10.1016/j.ccr.2007.04.017. [DOI] [PMC free article] [PubMed] [Google Scholar]
- St Croix B, Rago C, Velculescu V, Traverso G, Romans KE, Montgomery E, Lal A, Riggins GJ, Lengauer C, Vogelstein B, Kinzler KW. Genes expressed in human tumor endothelium. Science. 2000;289:1197–1202. doi: 10.1126/science.289.5482.1197. [DOI] [PubMed] [Google Scholar]
- Streubel B, Chott A, Huber D, Exner M, Jager U, Wagner O, Schwarzinger I. Lymphoma-specific genetic aberrations in microvascular endothelial cells in B cell lymphomas. N Engl J Med. 2004;351:250–259. doi: 10.1056/NEJMoa033153. [DOI] [PubMed] [Google Scholar]
- Bussolati B, Deambrosis I, Russo S, Deregibus MC, Camussi G. Altered angiogenesis and survival in human tumor-derived endothelial cells. FASEB J. 2003;17:1159–1161. doi: 10.1096/fj.02-0557fje. [DOI] [PubMed] [Google Scholar]
- Gunsilius E, Duba HC, Petzer AL, Kahler CM, Grunewald K, Stockhammer G, Gabl C, Dirnhofer S, Clausen J, Gastl G. Evidence from a leukaemia model for maintenance of vascular endothelium by bone-marrow-derived endothelial cells. Lancet. 2000;355:1688–1691. doi: 10.1016/S0140-6736(00)02241-8. [DOI] [PubMed] [Google Scholar]
- Hida K, Hida Y, Amin DN, Flint AF, Panigrahy D, Morton CC, Klagsbrun M. Tumor-associated endothelial cells with cytogenetic abnormalities. Cancer Res. 2004;64:8249–8255. doi: 10.1158/0008-5472.CAN-04-1567. [DOI] [PubMed] [Google Scholar]
- Hida K, Klagsbrun M. A new perspective on tumor endothelial cells: unexpected chromosome and centrosome abnormalities. Cancer Res. 2005;65:2507–2510. doi: 10.1158/0008-5472.CAN-05-0002. [DOI] [PubMed] [Google Scholar]
- Arbiser JL, Raab G, Rohan RM, Paul S, Hirschi K, Flynn E, Price ER, Fisher DE, Cohen C, Klagsbrun M. Isolation of mouse stromal cells associated with a human tumor using differential diphtheria toxin sensitivity. Am J Pathol. 1999;155:723–729. doi: 10.1016/S0002-9440(10)65171-1. [DOI] [PMC free article] [PubMed] [Google Scholar]
- Gussoni E, Wang Y, Fraefel C, Miller RG, Blau HM, Geller AI, Kunkel LM. A method to codetect introduced genes and their products in gene therapy protocols. Nature Biotechnol. 1996;14:1012–1016. doi: 10.1038/nbt0896-1012. [DOI] [PubMed] [Google Scholar]
- Liao SY, Aurelio ON, Jan K, Zavada J, Stanbridge EJ. Identification of the MN/CA9 protein as a reliable diagnostic biomarker of clear cell carcinoma of the kidney. Cancer Res. 1997;57:2827–2831. [PubMed] [Google Scholar]
- Jacobsen BM, Harrell JC, Jedlicka P, Borges VF, Varella-Garcia M, Horwitz KB. Spontaneous fusion with, and transformation of mouse stroma by, malignant human breast cancer epithelium. Cancer Res. 2006;66:8274–8279. doi: 10.1158/0008-5472.CAN-06-1456. [DOI] [PubMed] [Google Scholar]
- Weaver BA, Silk AD, Montagna C, Verdier-Pinard P, Cleveland DW. Aneuploidy acts both oncogenically and as a tumor suppressor. Cancer Cell. 2007;11:25–36. doi: 10.1016/j.ccr.2006.12.003. [DOI] [PubMed] [Google Scholar]
- Asahara T, Murohara T, Sullivan A, Silver M, van der Zee R, Li T, Witzenbichler B, Schatteman G, Isner JM. Isolation of putative progenitor endothelial cells for angiogenesis. Science. 1997;275:964–967. doi: 10.1126/science.275.5302.964. [DOI] [PubMed] [Google Scholar]
- Lyden D, Hattori K, Dias S, Costa C, Blaikie P, Butros L, Chadburn A, Heissig B, Marks W, Witte L, Wu Y, Hicklin D, Zhu Z, Hackett NR, Crystal RG, Moore MA, Hajjar KA, Manova K, Benezra R, Rafii S. Impaired recruitment of bone-marrow-derived endothelial and hematopoietic precursor cells blocks tumor angiogenesis and growth. Nat Med. 2001;7:1194–1201. doi: 10.1038/nm1101-1194. [DOI] [PubMed] [Google Scholar]
- Rafii S, Lyden D, Benezra R, Hattori K, Heissig B. Vascular and haematopoietic stem cells: novel targets for anti-angiogenesis therapy? Nat Rev Cancer. 2002;2:826–835. doi: 10.1038/nrc925. [DOI] [PubMed] [Google Scholar]
- Gehling UM, Ergun S, Schumacher U, Wagener C, Pantel K, Otte M, Schuch G, Schafhausen P, Mende T, Kilic N, Kluge K, Schafer B, Hossfeld DK, Fiedler W. In vitro differentiation of endothelial cells from AC133-positive progenitor cells. Blood. 2000;95:3106–3112. [PubMed] [Google Scholar]
- Yin AH, Miraglia S, Zanjani ED, Almeida-Porada G, Ogawa M, Leary AG, Olweus J, Kearney J, Buck DW. AC133, a novel marker for human hematopoietic stem and progenitor cells. Blood. 1997;90:5002–5012. [PubMed] [Google Scholar]
- Damelin M, Sun YE, Sodja VB, Bestor TH. Decatenation checkpoint deficiency in stem and progenitor cells. Cancer Cell. 2005;8:479–484. doi: 10.1016/j.ccr.2005.11.004. [DOI] [PubMed] [Google Scholar]
- Kops GJ, Weaver BA, Cleveland DW. On the road to cancer: aneuploidy and the mitotic checkpoint. Nat Rev Cancer. 2005;5:773–785. doi: 10.1038/nrc1714. [DOI] [PubMed] [Google Scholar]
- Amin DN, Hida K, Bielenberg DR, Klagsbrun M. Tumor endothelial cells express epidermal growth factor receptor (EGFR) but not ErbB3 and are responsive to EGF and to EGFR kinase inhibitors. Cancer Res. 2006;66:2173–2180. doi: 10.1158/0008-5472.CAN-05-3387. [DOI] [PubMed] [Google Scholar]
- Wang JH, Wu QD, Bouchier-Hayes D, Redmond HP. Hypoxia up-regulates Bcl-2 expression and suppresses interferon γ induced antiangiogenic activity in human tumor derived endothelial cells. Cancer. 2002;94:2745–2755. doi: 10.1002/cncr.10520. [DOI] [PubMed] [Google Scholar]
- Grange C, Bussolati B, Bruno S, Fonsato V, Sapino A, Camussi G. Isolation and characterization of human breast tumor-derived endothelial cells. Oncol Rep. 2006;15:381–386. [PubMed] [Google Scholar]
- Ferrara N, Kerbel RS. Angiogenesis as a therapeutic target. Nature. 2005;438:967–974. doi: 10.1038/nature04483. [DOI] [PubMed] [Google Scholar]
- Kerbel RS, Yu J, Tran J, Man S, Viloria-Petit A, Klement G, Coomber BL, Rak J. Possible mechanisms of acquired resistance to anti-angiogenic drugs: implications for the use of combination therapy approaches. Cancer Metastasis Rev. 2001;20:79–86. doi: 10.1023/a:1013172910858. [DOI] [PubMed] [Google Scholar]
- Shekhar MP, Werdell J, Santner SJ, Pauley RJ, Tait L. Breast stroma plays a dominant regulatory role in breast epithelial growth and differentiation: implications for tumor development and progression. Cancer Res. 2001;61:1320–1326. [PubMed] [Google Scholar]
- Mueller MM, Fusenig NE. Tumor-stroma interactions directing phenotype and progression of epithelial skin tumor cells. Differentiation. 2002;70:486–497. doi: 10.1046/j.1432-0436.2002.700903.x. [DOI] [PubMed] [Google Scholar]
- Fukino K, Shen L, Patocs A, Mutter GL, Eng C. Genomic instability within tumor stroma and clinicopathological characteristics of sporadic primary invasive breast carcinoma. J Am Med Assoc. 2007;297:2103–2111. doi: 10.1001/jama.297.19.2103. [DOI] [PubMed] [Google Scholar]
- Zalcman G, Bergot E, Hainaut P. Breast-cancer stromal cells with TP53 mutations. N Engl J Med. 2008;358:1635–1636; author reply 1636. [PubMed] [Google Scholar]


